<\/i>","library":"fa-solid"},"layout":"horizontal","toggle":"burger"}" data-widget_type="nav-menu.default">

Top

PAX’s H1 2023 Revenue Down 15% YoY as E-payment Terminal Business Hurt by Unfavourable Macroeconomics

  • Revenue contribution from LACIS, EMEA and APAC regions drop YoY in H1 2023.
  • Revenue contribution from APAC region should improve in H2 2023 with India and SEA’s strengthening performances.
  • PAX expects a double-digit percentage decline in 2023 revenue.

PAX Global Technology’s H1 2023 revenue fell 14.7% YoY to$456 million, as the company’s electronic payment terminal business was constrained by slowing global economic growth and high-interest rates. Meanwhile, revenue from itspaymentterminal-related services segment surged 35.6% YoY during the period, mainly due to the growth in revenue generated from the Software as a Service (SaaS) solutions, maintenance, and installation services.

PAX revenue by segment

During PAX’s earnings call, CEO Jack Lu discussed a few key topics including the adoption of Android smart solutions, macroeconomic challenges and forward-going management strategies.

Macroeconomic Situation and Payment Trend

CEO Jack Lu:“Despite short-term macroeconomic challenges, the proliferation of electronic payments continues to be a significant and ongoing global trend. The continued advancement of payment technology, along with growing consumer appetite for convenient and secure payment options, as well as the cashless initiatives promoted by governments worldwide, have continued to open up new opportunities for PAX solutions.”

Our analyst take:“PAX’s strong portfolio across different sectors, combined with its POS terminal management platform, offers a one-stop solution for businesses. PAX is helping businesses scale their operations by providing seamless payment options. The company has strategically set up a dedicated division called Zolon to expand businessInternetof Things (BIoT). PAX’s service segment revenue is expected to receive a further boost from its BIoT solutions, including SaaS (e.g. MAXSTORE) and commercial POS solutions (e.g. Elys). The enterprise IoT solution will mainly target cloud-based services for businesses to secure recurring revenues.”

Management Strategy

CEO Jack Lu:“Looking ahead, the global payment industry continues to embrace a prosperous future. PAX will continue to explore more potential business opportunities by acquiring banks, PSPs and distribution partners, offering future-oriented payment solutions for merchants and consumers across the globe.”

Our analyst take:“The payment industry has undergone fundamental changes in recent years, with a surge in the global acceptance of electronic payment options among consumers and merchants. Governments and financial institutions worldwide now place greater emphasis on their electronic payment acceptance infrastructure and are aiming to implement a more efficient and transparent financial ecosystem. The huge value and potential of the payment terminal market will be further unlocked going forward. PAX’s ongoing strategy is aligned to capture this huge market opportunity and we believe its expanding global presence and increasing investment in R&D will help it drive innovation and increase market share.”

PAX revenue by region

H1 2023 Result Summary:

  • PAXreported gross profit margin of 44% in H1 2023, up400 bps YoY,driven by lower costs stemming from a weaker yuan and a change in its geographical sales mix. PAX’sSaaSecosystem rose84%YoY in H1 2023 and contributed positively to the company’s overall revenue growth. The company had more than10 millionconnected terminals being managed on itsMAXSTOREplatformduring the period.
  • In H1 2023, PAX registered a decline in revenue from theLatin America and Commonwealth of Independent States (LACIS),Europe, Middle East and Africa (EMEA)andAsia-Pacific (APAC)Only theUnited States and Canada (USCA)region saw a record-breaking growth of 20% YoY during the period.
  • The LACISregion posted an 18% YoY decline in H1 2023 revenue to reach$175 million, constrained by the conservative business sentiment in Brazil stemming from challengingeconomic
  • The EMEAregion recorded$148 millionin revenue, down 19% YoY in H1 2023, mostly due to economic uncertainties, especially in Europe and the Gulf Cooperation Council (GCC), resulting in a temporary slowdown in market demand. However, PAX is confident that its strong brand recognition and products, as well as a reputable network of channel partners, will continue to positively influence growth in the region.
  • The APACregion saw a 24% YoY decline in revenue to$57 million, hurt by the longer-than-expected sales cycle in India, which offset the growth of other markets in the region. However, going forward, several APAC countries are expected to contribute increased sales revenues as PAX’s brand recognition improves and new products hit the market.
  • During H1 2023, PAX secured a steady increase in shipment volumes from the SEA region as countries like Indonesia and Singapore ramped up the adoption of PAXAndroidsmart products as they move to modernize their electronic payment systems. Riding on this wave, along with India’s strengthening contribution, the APAC region should perform well in H2 2023.
  • The USCAregion registered a record-breaking growth of 20% YoY in H1 2023 with$76 millionin revenue, mostly driven by increasing market demand for diverse payment options and value-added services. PAX Smart Android solutions have maintained strong sales momentum and positive market reception of the newly launched Elys Solution.
  • In July 2023, PAX was elected to the Board of Advisors of thePCI Security StandardsCouncil (PCI SSC), making it the first and only Chinese company to join the board – this proves how good its products are. PAX should leverage the PCI SSC news to keep gaining market share in the US and Europe.
  • PAX’s expertise in AndroidSmartPOStechnology has enabled it to lead the Android SmartPOS solutions space. However, it faces strong competition in other use cases and form factors from international players like Ingenico and Verifone and homegrown Chinese players like Newland, Tianyu and Castles.
  • With an unwavering dedication to the payment terminal sector for the past two decades, PAX has built extensive expertise, capital prowess and a diversified global footprint supported by a strong portfolio across different sectors catering to different needs of merchants and businesses. This has helped PAX become risk resilient and adaptable to volatile environments.
  • PAX has a bleak outlook for 2023, given themacroeconomicobstacles, decelerating global economic growth, and elevated interest rates. The company has anticipated a double-digit percentage decrease in revenue for the year. Similarly, competitors like Newland, Tianyu and Castles are also grappling with these macroeconomic challenges for their payment terminal businesses.

Related Reports:

MediaTek to Focus on Automotive, Edge AI for Growth

  • The company saw a slight growth in Q2 revenues due to the improving demand for 5G SoCs.
  • Inventory came down to a relatively normal level.
  • MediaTek and NVIDIA have tied up to develop a full-scale product roadmap for the automotive industry.
  • 重要的收入预计将看到MediaTek’s auto and custom ASIC segments from 2026.

[rev_slider alias=”mediatek-earnings”][/rev_slider]

MediaTek’srevenues were slightly up sequentially but down 43% annually in Q2 2023. Inventory has gradually come down to a relatively normal level, but the demand for智能手机swill remain slow due to the global macroeconomic situation and therefurbished智能手机market. Against this backdrop, MediaTek is diversifying its portfolio by focusing on theauto, smart edge and customASIC segments.The company is estimated to take over two years to get material revenues from these segments.

AI and ASIC Opportunity

CEO:“As for ASIC, we recently see growing enterprise ASIC business opportunities in AI and datacenter markets. With our strong IP and SoC integration capabilities, we aim to continue to grow this business in the future.”

Parv Sharma’s analyst take: “With the growth in generative AI, the demand for edge AI processing has accelerated. Being one of the top players in edge devices, MediaTek is well-positioned to benefit from this shift. The company will focus on winning enterprise ASIC projects but catching up with major players like Broadcom and Marvell will take time, as customers typically work with existing suppliers for repeat projects.”

Growing focus on auto and partnership with NVIDIA

CEO:“We’re very excited about the recently announced partnership between MediaTek and NVIDIA to develop a full-scale product roadmap for the automotive industry. We believe our industry-leading low-power processors and 5G, WiFi connectivity solutions, combined with NVIDIA’s strong capability in software and AI cloud, will help us become highly competitive in the future connected software-defined vehicles market and shorten our time to market to accelerate our growth.”

Shivani Parashar’s analyst take:“联发科推出Dimensity汽车关注有限公司ckpit and connectivity solutions. With its partnership with NVIDIA, the company aims to develop a full-scale product roadmap for the automotive industry. Auto design cycles are long so it will take some time (2026-2027) for the company to increase revenues from this segment. Overall, we can say the auto segment will become a long-term revenue growth driver for MediaTek.”

Customer and channel inventories come down

CEO:“We observed that customer and channel inventories across major applications have gradually reduced to a relatively normal level. Recent demand from our customers has shown certain level of stabilization. However, our customers are still managing their inventory cautiously as global consumer electronics end market demand remains soft. For the near-term, we expect our business to gradually improve in the second half of the year”

Shivani Parashar’s analyst take: “According to our supply chain checks, inventory levels are coming down and will get back to normal in the second half of 2023. OEMs will start restocking but will be cautious due to weak consumer demand and global macroeconomic conditions.”Mediatek revenues Result summary

  • Slight improvement in revenues: MediaTek recorded$3.2 billionin revenues in Q2 2023, a slight increase of 2% QoQ but a decrease of43% YoYdue to the weakglobal demandfor end products and the second-hand smartphone market. Customer and channel inventories across major applications have come down to a relatively normal level.
  • Maintained mobile segment revenue due to 5G SoCs:The mobile phonesegment contributed 46% to the company’s revenue in Q2 2023, which declined by51%YoY and increased by 2% QoQ. The demand for 5G SoCs improved during the quarter. The new flagship Dimensity SoC will be launched in the coming month.
  • New opportunities for smart edge:The smart edge segment contributed 47% to the company’s revenue in Q2, growing 2% sequentially. The demand for connectivity remained stable in the quarter. Business opportunities are growing for the ASIC segment.
  • Price discipline: MediaTek will focus on maintaining gross margin, following price discipline at a time of uncertainty in the global semiconductor industry.
  • Favorable guidance: MediaTek guided Q3 revenues in the range of$3.3 to $3.5 billion, growing 4%-11% sequentially. Gross margins are expected to be around47%while the operating expense ratio is expected to be around 32% in Q2 2023. The smartphone, connectivity and PMIC segments will see revenue growth. The smart TV segment will witness declining revenues in the third quarter due to excess inventory.
  • Autosegment is picking up:Automotivewill contribute$200 to $300million to MediaTek’s revenue in 2023. More significant revenue can be seen from 2026. The current auto design pipeline revenue for MediaTek is over $1 billion.

Related posts

Netgear Q2 Gets Premium Push, Inventory Stabilization Seen in Q3

  • Netgear’s Q2 2023 revenue declined 22.3% YoY to $173.4 million.
  • Inventory correction in H1 2023 totaled $66 million.
  • Orbi, Nighthawk, 5G mobile hotspots and Pro AV will drive revenues in Q3 2023.
  • Netgear expects the Q3 2023 revenues to be in the range of $175-$190 million.

[rev_slider alias=”carousel”][/rev_slider]

Netgear’s revenue declined 22.3% YoY in Q2 2023 to $173.4 million, coming at the higher end of the guidance primarily due to an increase in orders from the service provider channel. The company experienced an inventory correction worth $29 million in Q2 2023, taking the H1 2023 inventory corrections to $66 million. As the inventory levels begin to stabilize, we expect the inventory spills will be 20% lower in H2 2023 compared to H1 2023.

Premium offerings, Pro AV switches shine amid revenue declines in both segments

  • Connected home and SMB (small and medium business) segments suffered declines of24%和21%YoY, respectively, in Q2 2023 primarily due to inventory corrections at channel partners.
  • Gross margin continued to be above30%in the second quarter as premium product sales grew and freight costs went down.
  • However, the operating margin continued to be in thenegativeregion as inventory correction amounted toover $29 million.It is expected to improve in Q3 with an improved mix of higher-ASP products in the connected home and SMB segments.
  • The retail market is starting to stabilize with consumer demand increasing toward premium networking equipment as the number of Wi-Fi-enabled devices continues to increase. As home networks become more crowded with bandwidth-hungry devices, the demand for Mesh routing devices will increase with time to ease out home networks.

Netgear Revenue by Segment, Q1 2020 - Q2 2023

  • The end consumer devices have become more feature-rich, especially withAI(artificial intelligence) which now requires more bandwidth, low latency and more reliable Wi-Fi connection. This has led to strong consumer demand for premium routers offering such features.
  • 夜鹰Orbi和一系列的路由器to perform well forNetgearalong with 5G mobile hotspots and experienced a YoY increase in shipments in Q2 2023.
  • Pro AV-managed switches continued to outperform other end devices in the SMB segment to deliver a growth of more than40% YoY in Q2 2023.Netgear is significantly committed to building leadership in IP-over-AV switches and continues to invest more to grow this segment.
  • Other SMB products experienced a major drop in sales due to macroeconomic headwinds affecting enterprise spending in the past couple of quarters, delaying the upgrades to newer Wi-Fi technologies.

Netgear Revenue by Region, Q1 2020V- Q2 2023

Revenues from service providers, in APAC and Europe decline significantly

  • Though service provider revenue increased sequentially in Q2 2023 to $25 million, it suffered adecline of 30% YoY.Revenues were at the higher end of the guidance due to an increase in orders from a major service provider.
  • Netgearshipped around6 million unitsof wired and wireless networking devices, compared to2.2 million在去年同期。它运426,000units of all types of routers and gateways.
  • Sales in APAC and Europe declined20%and 40% YoY, respectively, due to an economic slowdown in these regions, especially Greater China and South Korea.

Paid subscribers to reach 875,000 by year-end, inventory corrections to stabilize

  • Netgear is on the path to achieve a paid subscriber base of875,000by the end of 2023 as it touched800,000 in Q2 2023.Revenue from subscriptions grew8% YoYin Q2 2023 to end at$10.3 million
  • With concerns about internet security on the rise, especially with a growing number of smart devices, online internet security software is expected to gain momentum in the second half of this year.

Netgearexpects the revenue to be in the range of$175 million to $190 million in Q3 2023, as inventory correction is expected to ease out. However, it will still take two more quarters for Netgear to bring down inventory-carrying levels to less than 10 weeks.

Netgear paid subscibers

Key takeaways

  • Counterpoint expects an increase in shipments for 5G mobile hotspots in H2 2023 as the consumer demand for such products is on the rise. Netgear is expected to launch a couple of Wi-Fi 7 Orbi Mesh routers and quadband Nighthawk routers in Q3 2023.
  • However,Wi-Fi 7upgrade cycle is expected to begin sometime in mid-2024, as IEEE is yet to announce the schedule of the certification program forWi-Fi 7.Therefore, Wi-Fi 6/6E is expected to form more than 50% of the market in the next two years.
  • Netgear is expected to open more company-owned premium retail outlets which will help it to provide a better customer experience and a competitive edge in the market.
  • Consumer awareness around online internet security remains low. Netgear can play a part in increasing consumer awareness through its D2C (direct-to-consumer) communication channels.
  • Macroeconomic headwinds have slowed down enterprise spending, thus delaying the Wi-Fi upgrade cycle toward Wi-Fi 6/6E.
  • 5G FWA market has been performing well across most of the regions. With more regions opting to reduce the digital divide through FWA, the market promises to offer further growth and become a challenger to fixed broadband technologies.

Related Research

Price Cuts Boost Tesla Revenue in Q1, Profit Slumps Compared to 2022

  • 2 million vehicle deliveries are achievable in 2023 if the macroeconomic situation doesn’t worsen.
  • Gross profit was down 17% YoY to $4.5 billion due to price cuts, raw material inflation, exchange rate impacts and other factors.
  • 3.9、妇女的能量存储被运往在Q1 2023, Tesla’s highest yet.

Tesla’s Q1 2023 deliveries stood at422,875 vehiclesglobally and registered a total revenue of$23.3 billion, a YoY increase of almost 25%. WithTeslaannouncing price cuts for its models starting from January, vehicle deliveries also saw a36% YoY boost.Tesla’s sales increased significantly across the US and China, accounting for 40% and 33% of its global deliveries, respectively. Almost 98% of Tesla’s sales came from the Model Y and Model 3. During Q1, the Model Y became thebest-selling carinEuropeand thebest-selling non-pickupvehicle in theUS.The Model 3’s sales also increased significantly in Europe, with almost 29,000 of them being sold in the continent during Q1. As the Berlin factory only produces the Model Y, all the Model 3s sold in Europe were imported from China.Tesla Revenue Q1 23_Counterpoint Research

Financial highlights

  • Revenue from Tesla’sautomotive segmentstood at nearly$20 billion, an 18% YoY increase. Automotive sales accounted for almost 95% of the revenue but revenue from the sale of regulatory credits and vehicle leasing declined significantly.
  • Tesla’srevenuefromother businesslines, such as energy deployment and services, increased by 78% YoY to$3.3 billion.During Q1, Tesla deployed a recordMegapack storage, totaling3.9 GWhand growing 360% YoY, the highest in a single quarter.
  • Automotive quarterly report Although Tesla generated strong revenue in Q1,gross profit declinedby 17% YoY to $4.5 billion andnet profit declinedby 23% to $2.5 billion. High vehicle deliveries and growth in other business lines helped the revenue, but the lowered vehicle ASPs, high raw material costs due to inflation,increased logistics costs, costs associated with the ramping up of the 4680-cell production, lower-than-expected utilization of the Berlin factory and negative exchange rate impacts all played a role in the lowered profits compared to a year ago.
  • Tesla’s Q1 operating profit was 11.42%, a decline of 4.6% sequentially.Teslaclaims to have abetter positionthan its competitors who are still struggling through the challenges ofreducing EV unit costs.Tesla aims to leverage its position as a cost leader, which it has achieved through increased penetration of in-house designed controllers, batteries and drive units.
  • Q1 R&D expenses were $771 million, 3.3% of total revenue. Tesla is developing a 360-degree ecosystem –Tesla OS.This will help the companyreduce dependencyon third-party software and cloud subscriptions for its day-to-day work, besides helping in thevertical integrationof software-based services and better cost control.

Tesla Production and Deliveries Q1 23 Counterpoint Research

Outlook

Tesla’s strong position in the auto market has also helped its market outlook.Price cuts取得了Tesla’s vehiclesmore affordableand with its Model Y and Model 3 becoming eligible for thetax credit subsidyin the US, we expectTesla to capture over 50% of the country’s EV market.In its earnings call, Tesla alsosignaled more price cuts.It also plans to open another factory in Shanghai to focus on the production of cells and batteries as part of its 100-GW cell factory capacity announced last year.

Tesla expects to start deliveries of its long-awaitedCybertruckinQ3 2023.The company is also working on its next-generation vehicle platform.

With a strong start, Tesla aims for1.8 million global deliveriesduring 2023, but2 millionis achievable if themacroeconomicsituation does not deteriorate significantly.

Related posts

Tesla Reports Record Revenue, Deliveries in Q4 2022

  • Tesla’s total revenue stood at $24.3 billion in Q4 2022 with 37% YoY growth.
  • Tesla deployed 2.46 GWh of energy storage during Q4, a growth of almost 152% YoY.
  • Tesla’s vehicle deliveries are expected to exceed 1.7 million units globally in 2023.

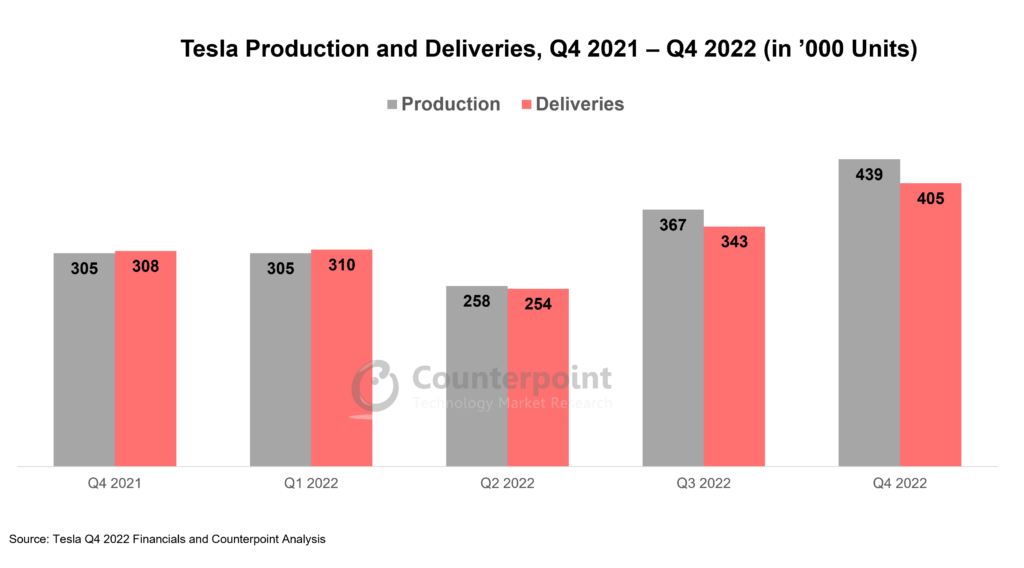
Riding on record 405,278 vehicle deliveries in Q4 2022, Tesla registered a record total revenue of $24.3 billion during the quarter, an increase of 37% YoY. Deliveries rose 31.3% YoY in Q4, bringing the 2022 annual total to1.3 million units.TheUS was the leading marketin Q4, followed by China and Europe. The annual deliveries of Tesla’s premium Model X and Model S grew 167% YoY to reach 66,000 units.

Tesla’s sales inChinafell short of expectations again due to the COVID-19 outbreak. Production at the Shanghai factory, which exported more than 106,000 units in Q4, was halted during the last week of December. Although no specific reason was stated officially, rising COVID-19 cases among workers were a likely cause for the unexpected production halt. On the other hand, the weekly Model Y production in the Berlin factory touched 3,000 units. The rising production in Germany has helped Tesla gain a strong grip onEurope’s EV market.The Model Y remained Europe’s top-selling car model during November and December. Tesla’s in-house 4680 cell production rate also reached 1,000 cars per week.

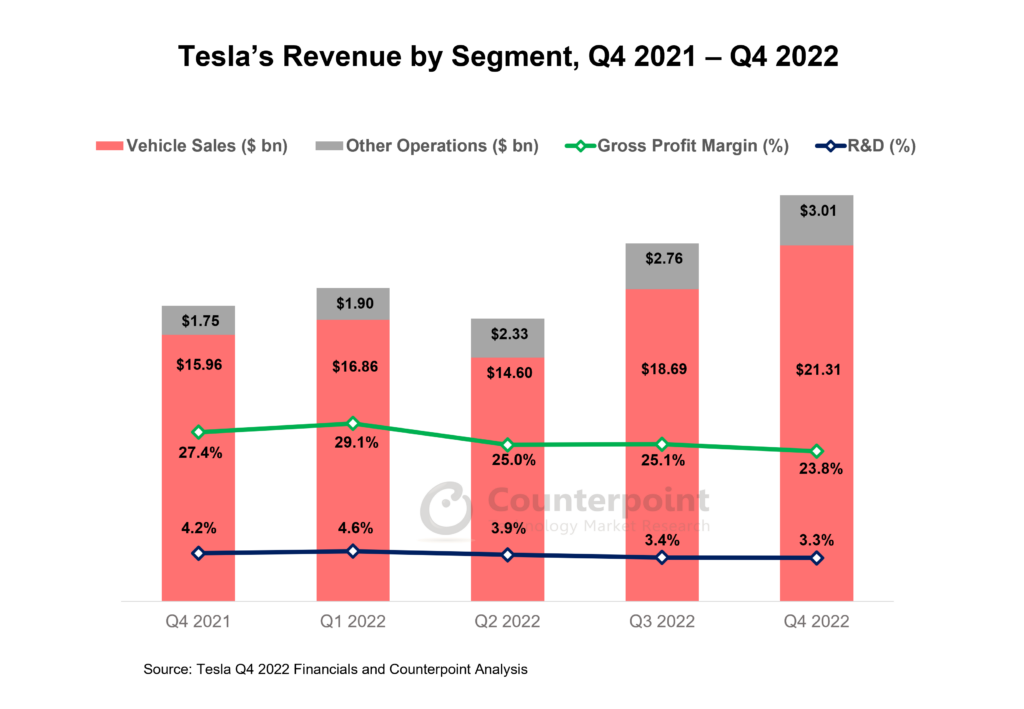
Tesla Revenue by segment Q4 2021 - Q4 2022 Counterpoint Research

Financial summary

  • Tesla’stotal revenueduring Q4 2022 stood at $24.3 billion, an increase of 37% YoY. The company generated more than $20 billion from automotive sales. During Q4, the widespread release ofTesla’s full self-driving(FSD) feature generated $0.32 billion in revenue, indicating that the company is striving to increase the proportion of software revenue in its overall product mix.
  • Revenue from Tesla’sother businesseslike energy storage, solar panel deployment, charging and vehicle servicing grew by almost 72% YoY to exceed $3 billion. Other businesses contributed 12% of Tesla’s Q4 revenue.
  • Tesla deployed 2.46 GWh ofenergy storageduring Q4. At 151.7%, it saw the highest YoY growth till now.
  • Tesla’s total revenue for 2022 exceeded $81.4 billion, a 51% YoY growth.
  • During Q4,gross profitalso increased by 19% YoY and stood at $5.7 billion. In October, Tesla reducedvehicle prices in Chinaafter increasing them a couple of times during H1 2022. Initially, it was thought the increase in demand would make up for the price cut but the negative foreign exchange impact restricted further gross profit growth.
  • Tesla’sinventoryin Q4 stood at 34,423 units, bringing the annual total to 55,760 units. The COVID-19 outbreak in China and the increased production in the Berlin factory are probable causes of the higher inventory. In addition, Tesla is facing stiff competition as legacy automakers and new players are offering more affordable EVs. In January 2023, Tesla lowered prices globally, which may help in clearing out inventories and achieving economies of scale.

Tesla production and deliveries, Q4 2021-Q4 2022 Counterpoint Research

Outlook

Tesla’s strong fundamentals are expected to keep the company ahead of most other electric vehicle brands globally. Tesla announced price cuts in January 2023, which has resulted in the demand ballooning to twice the production. Besides, pilot production of the Tesla Semi began in 2022 and the vehicle is expected to hit the road soon. The company also plans to start production of theCybertruckin mid-2023. Furthermore, Tesla recently announced an investment of $3.6 billion to set up a 100GW capacity cell factory and a high-volume semi factory. Tesla’s 2023 vehicle deliveries are projected to exceed 1.7 million units, with a 31% YoY growth. This seems attainable if the company’s recent price cuts remain in effect for most of the year.

相关的帖子:

Good Show in Vehicle Solution, B2B Segments Helps LG Fight Macro Headwinds

  • Q3 2022 revenue increased 8% YoY to reach ₩16.12 trillion helped by higher sales of vehicle solutions.
  • Vehicle solutions revenue jumped 46% YoY during the quarter, helped by the improved global semiconductor supply and increased auto production in China.
  • Operating profit increased 33% YoY to reach ₩0.79 trillion.

LG Electronics(LG) reported an 8% YoY growth in Q3 2022 revenue to reach ₩16.12 trillion despite considerable macro headwinds but helped by higher sales in its vehicle solutions and business-to-business segments. Quarterly gross profit rose 5% YoY to ₩5.05 trillion while operating profit grew sharply by 33% YoY to reach ₩0.79 trillion.

During the quarter, investor sentiment was weak due to a steep devaluation of the South Korean won against the US dollar, hurt by strongeconomicheadwinds. The Korea Composite Stock Price Index (KOSPI) fell 6.5% in Q3 2022, which negatively affected LG’s performance.

LG收入部分,第三季度2021 - 2022年第三季度

Financial highlights:

  • Revenue from the consumer electronics segment fell 1% YoY to ₩11.19 trillion due to increased logistics costs and lower demand for premium products like TVs. This segment contributed to 69% of total revenue during the quarter.
  • Among all the segments, vehicle solutions was the best performer. The segment’s revenue jumped 46% YoY to ₩2.35 trillion during the quarter helped by the relative improvement in the globalsemiconductorsupply chain. The segment accounted for 15% of the company’s total revenue.Chinafaced a lot of factory shutdowns in the preceding quarter due to regulations related to the COVID-19 pandemic. As factories reopened in Q3, there was an increase in production which helped meet the heightened demand for electronics components in the automotive industry. This, combined with an improved cost structure, helped LG achieve strong growth figures for the period.
  • Revenue from other businesses grew 23% YoY reaching ₩2.60 trillion. Despite an increase in sales, the profitability of this segment decreased 63% due to lower demand for IT products and higher raw material costs.
  • LG’s gross profit increased 5% YoY to reach ₩5.04 While the company’s operating profit grew sharply, gross profit growth was relatively muted because of increased market competition, low consumer demand, increased raw material prices, increased marketing expenses and the energy crisis.

Market outlook:

The current global business environment is quite difficult, burdened by rising inflation, supply chain disruptions,geo-politicaltensions, increased logistic costs and the energy crisis, which have weighed negatively on consumer sentiment across industries. LG plans to prioritize on the development of new software platforms and adjust its channel inventory to overcome the ongoing crisis. LG will focus on its premium consumer electronics products and will likely maintain maximum margins to secure high profits. The company will also apply cost-saving initiatives to reduce raw material costs.

The vehicle solutions segment has the highest potential to expand as the global semiconductor shortage is easing out and OEMs like Honda, GM and Stellantis are working to jointly produce battery cells. Moreover, LG has secured an order worth ₩1 trillion fromTeslato supply automotive camera modules for the Tesla Model 3, Model Y and Cybertruck. These new deals will drive LG’s vehicle solutions segment to a great future.

LG is also strengthening its focus on new technologies likemetaverseandrobotics.最近与KT公司合作经验and its AI robot service business. LG will also establish an R&D centre and develop robots for logistics, education and healthcare services. LG’s strategic partnership with TmaxMetaverse will boost development across metaverse solutions and web-based metaverse services. The company will have the opportunity to capitalize on these technologies by the time they mature at the end of the decade, which will help it boost revenue.

相关的帖子

LG Electronics Revenue at New Record High in Q1 2022

  • Revenue reached a new record high of $14.48 billion during the quarter.
  • Operating profit recovered to a respectable level.
  • Other businesses registered the highest QoQ revenue growth of 51%.

In 2021, LG shut its智能手机business, which was generating nearly 6% of its total revenue. The closure of this segment has not affected the company much.LG’s revenue increased by more than 16% YoY in Q1 2022 to reach a new record high of $14.48 billion. 46% of this revenue was generated by strong demand for premium products across overseas markets. LGInnotek’s numbers are not included in this analysis.

Revenue from the vehicle solution business grew sequentially. Vehicle sales have been facing a tough time globally due to component shortages but LG is benefiting from the slight rebound. It has alsosigned dealswith leading auto OEMs like Mercedes-Benz, to whom it will provide ADAS andcockpitsolutions. Besides the electronics and vehicle solution segments, LG’s other businesses also witnessed growth in Q1 2022. There has been a sustainable growth in the sales of products for the B2B segment. Moreover, LG’s energy-related solutions (LG Chem) business, which has been included in other segments, contributed to a steep revenue rise. Price hikes of certain high-demand products also contributed to the high revenue generation during Q1 2022.

The revenue could have been more in the absence of the latest COVID-19 lockdowns in China and the Russia-Ukraine war. Also, therestricted supplyof a few key raw materials and increased logistics costs negatively impacted the production.

LG Revenue by segment Q1 2021-Q1 2022_Counterpoint Research

Q1 2022 Financial Highlights

  • Revenue from the consumer electronics segment stood at $10.03 billion, an increase of 3.2% QoQ. This segment contributed to nearly 69% of the total revenue.
  • Revenue from the vehicle solutions segment stood at $1.56 billion, an increase of 13.3% QoQ. This segment contributed 10.8% of the total revenue. By strengthening business risk management and continuously improving the cost structure across products, LG reduced this segment’s losses by 33% in just two quarters.
  • Revenue from other businesses reached $2.89 billion, an increase of 49% QoQ. This huge increase was due to the transfer of LG’s electric battery business to this segment from the vehicle solutions segment.
  • LG’s gross profit reached $4.93 billion, a 28% QoQ increase. Gross profit was down during the last quarter due to supply chain disruptions following COVID-19 and increased raw material prices.

MarketOutlook

LG Electronics’ future looks promising with the adoption of newer and advanced technologies across segments. Technologies like Plug-in for Intelligence Equipment (PIE) and Machine-learning based Vision Inspection system (MAVIN) are helping the company to minimize material loss and logistic delays. All these developments will have a positive impact on the coming quarter’s financials.

In the vehicle solutions segment, we expect to see a rise in business as demand forsmart cartechnology combined with increased demand forin-vehicle connectivityis increasing. Being a leader in this segment, LG will leverage its position by forming various JVs and partnerships that will boost its future revenue generation from this segment. Apart from providing hardware solutions for automotive, LG is also entering the automotive software solutions space with its recent acquisition of TISAX and Cybellum.

Apart from the electronics and vehicle solutions segments, developments in LG’s other segments like energy storage and sales have been noteworthy. Recent partnerships for energy solutions have provided the segment with the necessary boost. Moreover, the increasing demand for EVs will only help the energy solution segment to grow from this point onwards.

相关的帖子

Tesla Reports Record Revenue in Q1 2022; Rising Raw Material Cost a Challenge

  • Tesla vehicle deliveries crossed 310,000 units in Q1 2022, a YoY increase of 68%.
  • Revenue reached a record high of $18.8 billion during the quarter.
  • 特斯拉业务的46%以上nal expenses in Q1 2022 went to R&D.

The initial months of 2021 were not favorable for automakers. Semiconductor shortages derailed the post-COVIDrecovery, affecting vehicle sales worldwide. But the shortages haveeaseda bit one year later and auto sales are reviving. Automakers expect to recover the losses made during the last two years, soon. However, traditional automakers are unable to cope with the rising demand for pure EVs, whereas Tesla’s ability to address this demand has rewarded it not only with higher vehicle sales in Q1 2022 but also a record revenue of $18.8 billion. Tesla has also started deliveries to car rental service provider Hertz against its huge 100,000-vehicle order, which is also a reason for high vehicle production and delivery during the quarter.

Tesla’s Q1 2022 revenue would have been more without the fresh COVID wave that has hit Shanghai and surrounding areas, affecting the company’s production there. From the second week of March, rising cases of a new COVID variant have forced automakers operating around Shanghai to suspend production.

The urge to achieve L4 autonomy by the end of 2023 and to roll out robotaxis by early 2025 can be a major reason forTesla’sbig R&D spend. Besides, Tesla could also be conducting research on developing new battery chemistry. Thesoaring prices of some key battery components like nickel and lithium have put the auto OEMs in a spot. Most EV makers around the globe have been forced to raise prices by a few thousand dollars to cope with the rising prices of battery-related raw materials.

After Tesla’sShanghai plantbecame operational, the company’s sales boomed globally, especially in China. In 2021, China remained its top market followed by the US and Europe. Apart from vehicle sales, Tesla has a strong network of charging stations and insurance services. Till Q1 2022, Tesla had 3,724 superchargers and 33,657 supercharger connectors worldwide.

Tesla Revenue by Segment Q1 2022_Counterpoint Research

Q1 2022 Financial Results

  • DuringQ12022, Tesla delivered more than 300,000 units ofvehicles, an increase of 68% YoY. Model 3/Y accounted for more than 95% of deliveries.
  • Total revenuestood at $18.7 billion, an 81% YoY increase. Nearly 90% of the total revenue came from vehicle sales.
  • Tesla’s other services like energy storage, charging and insurance contributed to the remaining 10% of the revenue. Revenue from energy-related services and insurance services saw YoY growth of 24.7% and 43.23% respectively.
  • Keeping parity with vehicle sales and revenue growth, Tesla’sgross profitduringQ12022 reached $5.4 billion. Compared to the same period last year, the gross profit grew by a whopping 146%. Gross profit from vehicle sales saw a jump of 132% YoY.
  • R&D costhas also been on the rise. During Q1 2022, it stood at nearly $1 billion, a 30% increase YoY. More than 46% of the operating expenses were incurred in the R&D segment, implying Tesla is working seriously on some new technology under the hood.
  • Vehicle inventoryfor Tesla is quite different from other OEMs. During Q1 2022, Tesla delivered more vehicles than it produced, putting the quarterly inventory at -1.5%. This implies that Tesla has been clearing older stock that remained unsold during 2020 and 2021. Tesla keeps a delicate balance between production and deliveries, which helps it to maintain an image that its vehicles are in high demand.

Tesla Production and Deliveries, Q1 2021 - Q1 2022_Counterpoint Research

Market Outlook

Tesla’s future seems strong as it never stops innovating and keeps providing better and newer features to its customers. But within a couple of years, Tesla will face strong competition from traditional OEMs like Volkswagen, Toyota andStellantis, which released their ambitious vehicle electrification plans last year. Though it will be difficult for them to overtake Tesla sales any time soon, Tesla will witness a reduction in its share across major markets. The reason behind this is the price band in which Tesla operates. It mostly operates in the high-to-premium price band, whereas the traditional OEMs are planning to launch vehicles in the budget segment. The rising cost of a few key raw materials and inflationary impact on production have pushed Tesla to increase itsvehicle pricesworldwide a couple of times. This might play against the sentiment of new customers, which will, in turn, affect the next quarter’s financials.

相关的帖子

Q2 2021: Apple Achieves Record June Quarter Shipments, Xiaomi Becomes the Second-Largest Smartphone Brand Globally

  • Global smartphone market grew 19% YoY but declined by 7% QoQ as 329 million units were shipped, led by Samsung.
  • Xiaomi eclipses 50 million smartphones, becoming the world’s second-largest smartphone brand for the first time ever.
  • Samsung retained the number one spot with shipments reaching 58 million units in Q2 2021, however, its market share declined to 18% as compared to 22% in Q1 2021 as its shipments declined by 24% QoQ.
  • realme grew by 135% YoY and 17% QoQ, crossing cumulative shipments of 100 million smartphones since its entry into the smartphone market.
  • Global smartphone shipment revenues grew by 25% YoY to $96 billion in Q2 2021 setting a second-quarter record.

Seoul, Taipei, Beijing, London, Denver, Boston, Toronto, New Delhi, Hong Kong – July 29th, 2021

Global smartphone shipments declined by 7% QoQ in Q2 2021, according to the latest research from Counterpoint’s Market Monitor service. This was primarily due to ongoing component shortages as well as the implementation or extension of COVID-19 restrictions across Asia and Europe. Shipments, however, grew by 19% YoY as inoculation rates increased in several major economies preventing the need for lockdowns as stringent as those seen in the same quarter of last year.

Shipment Chart 5

Commenting on OEM rankings, Research Director, Tarun Pathak noted, “While Samsung retained the top spot, its market share fell by over 3% to 18% in Q2 2021. Shipments were down due to weak seasonal demand in some of its key regions such as India, Central and Latin America and Southeast Asia followed by production disruption in Vietnam due to COVID-19. Xiaomi had its best-ever quarter as it was able to increase its market share in China, Southeast Asia and Europe. WhileApplefell to the third spot, it captured record second-quarter shipments thanks to persistent demand and supply for its iPhone 12 series. OPPO and vivo retained their spots in the top five as OPPO continued expanding to overseas markets and vivo managed to lead theChinamarket for the second quarter in a row.”

Highlighting the revenue dynamics, Research Analyst, Aman Chaudhary noted, “Global smartphone wholesale shipment revenues eclipsed $96 billion*, up 25% YoY but declined 16% sequentially. This comes at a time when the industry was facing supply constraints. Apple captured a record second-quarter revenue share of 41% driven by continuing demand for the iPhone 12 Series followed by Samsung, OPPO, Xiaomi and vivo. However, Xiaomi had a strong quarter in terms of revenue as well, becoming the only brand within the top five to grow its revenue sequentially. It captured its highest-ever revenue share of over 9% driven by the strong performance of Redmi Note and the Mi 11 series.”

Revenue Chart 2

Commenting on Xiaomi’s record shipments, Senior Analyst, Harmeet Singh Walia noted, “Xiaomi crossed 50 million shipments for the first time ever driven by a combination of premium and low-to-mid price segment devices. Xiaomi’s exceptional performance comes despite a decline in India due to the spread of new COVID-19 variants. The increased shipments can be attributed to its growth in regions including Europe, Southeast Asia and Central and Latin America where it captured market share vacated by Samsung and Huawei. Southeast Asia and Europe were bright spots for Xiaomi as demand for mid-tier devices increased during the quarter.”

Key Takeaways:

  • Samsung’squarterly shipments declined by 24% QoQ and grew by a meagre 7% YoY reaching 57.9 million units in Q2 2021 due to supply constraints. Samsung’s revenue fell by 30% QoQ despite increasing by 7% YoY in Q2 2021. Samsung is diversifying its product mix and channel strategy in regions such asIndia, Europe and Central and Latin America. Samsung has also shifted focus towards premium devices over the mid-range series on the supply side in regions such as theUSwhere supply constraints and low inventory limited its growth.
  • Xiaomirecorded a QoQ shipment growth of 8% while its shipments grew by a staggering 98% YoY driven by the strong demand for Redmi 9, Note 9 and Note 10 series. Demand for its premium Mi 11 series remained strong as well. This mix of premium and lower-to-mid segment devices enabled Xiaomi to achieve its highest-ever smartphone revenue in Q2 2021.
  • Apple’s智能手机shipments fell by 18% QoQ but grew by 30% YoY to reach 48.9 million units in Q2 2021. This is because demand for iPhone 12 series remained high while its supply was not hit as severely by chip shortages because of its strong industry relationships, careful supply chain management, expedited shipping, and ability to cut days from factory to point-of-sale. Apple saw its revenue increase by 52% YoY.
  • OPPO’sshipments declined by 12% QoQ to 33.6 million units in Q2 2021. Its market share declined to 10% compared with last quarter’s 11%. However, driven by its global expansion and steady performance in China, it saw a growth of 37% compared with the same quarter last year when it enjoyed 9% market share. Following the shipment trends, OPPO’s YoY revenue also declined by 10% QoQ while increasing by over 50% YoY.
  • vivo‘s shipments declined by 8% QoQ but grew by 44% YoY to reach 32.5 million units in Q2 2021. vivo’s growth was driven by a strong performance in the China market, where it has retained the leadership position for a second consecutive quarter. vivo saw a quarterly decline in revenues of 10%, in line with the decline in its shipments over the same period. However, it saw YoY revenue growth of 69% driven by solid performances of its mid-tier models such as S9, Y52s and Y31.
  • Among other major OEMs,OnePlus, realme, and Lenovo Groupgrew the fastest. OnePlus grew by 170% YoY in Q2 2021 with its Nord N series doing particularly well in the North America and Western Europe markets. realme grew by 135% YoY in Q2 2021 as a result of its continuing success in China as well as its expansion in Southeast Asia where its C-series, launched in March this year, did exceptionally well. realme also reached the landmark of hitting 100 million in cumulative shipments since launch. Apart from this, it also reached 50 million units in cumulative shipments in India during the quarter, the fastest by any brand so far in India. Lenovo Group grew by 110% thanks to the success of its Moto E7 Plus in Latin America and Moto G Play 2021 in North America.

*Preliminary revenue, based on wholesale pricing.

Note: All shipments are preliminary and subject to change.

For press comments and inquiries please reach out to press (at) www.arena-ruc.com

You can also visit our Data Section (updated quarterly) to view the smartphone market share Globally and from the USA, China, and India.

Some of our other regional smartphone market analysis for Q2 2021 can be found below:

India Smartphone Market Stays Resilient During Second COVID-19 Wave, Crosses 33 Million Shipments

US Smartphone Market Grows 27% YoY in H1 2021 Despite Shortages; OnePlus, Motorola, Nokia HMD Gain as LG Exits

China Smartphone Market Sees Lowest Q2 Sales Since 2012; vivo Leads as Huawei Plummets

Background:

Counterpoint Technology Market Research is a global research firm specializing in products in the TMT (technology, media and telecom) industry. It services major technology and financial firms with a mix of monthly reports, customized projects and detailed analyses of the mobile and technology markets. Its key analysts are seasoned experts in the high-tech industry.

Analyst Contacts:

Tarun Pathak

Twitter Logo - PNG and Vector - Logo Download Linkedin - Free social media icons

Harmeet Singh Walia

Twitter Logo - PNG and Vector - Logo Download Linkedin - Free social media icons

Aman Chaudhary

Linkedin - Free social media icons

Varun Mishra

Twitter Logo - PNG and Vector - Logo Download Linkedin - Free social media icons

Karn Chauhan

Twitter Logo - PNG and Vector - Logo Download Linkedin - Free social media icons

Follow Counterpoint Research
Twitter Logo - PNG and Vector - Logo Download Linkedin - Free social media icons

Infographic: Q3-2014-Global Mobile Market Monitor

Our Quarterly Infographic for the Q3 2014 Market Monitor report has been published.

This quarter in Q3 2014, handsets grew 7% compared with last year. With the help of the iPhone 6 series launch, Apple topped value share with approx. 33% of industry revenue. Samsung’s Global handset market share decline to 22% from its peak of 27% in Q3-3013. Xiaomi emerged as one the top three vendors in terms of global shipments and double its revenue on YoY basis. LTE was the fastest growing segment crossing 100 million units in a quarter for the first time.

Please feel free to reach out to us for press or this research related questions atanalyst (at) www.arena-ruc.com

P.S. For the high quality PDF version please send an email request toinfo(at)www.arena-ruc.com

Infographic-Q3-2014-V5

Term of Use and Privacy Policy

Counterpoint Technology Market Research Limited

Registration

In order to access Counterpoint Technology Market Research Limited (Company or We hereafter) Web sites, you may be asked to complete a registration form. You are required to provide contact information which is used to enhance the user experience and determine whether you are a paid subscriber or not.
Personal Information When you register on we ask you for personal information. We use this information to provide you with the best advice and highest-quality service as well as with offers that we think are relevant to you. We may also contact you regarding a Web site problem or other customer service-related issues. We do not sell, share or rent personal information about you collected on Company Web sites.

How to unsubscribe and Termination

You may request to terminate your account or unsubscribe to any email subscriptions or mailing lists at any time. In accessing and using this Website, User agrees to comply with all applicable laws and agrees not to take any action that would compromise the security or viability of this Website. The Company may terminate User’s access to this Website at any time for any reason. The terms hereunder regarding Accuracy of Information and Third Party Rights shall survive termination.

Website Content and Copyright

这个网站是对位的财产和我s protected by international copyright law and conventions. We grant users the right to access and use the Website, so long as such use is for internal information purposes, and User does not alter, copy, disseminate, redistribute or republish any content or feature of this Website. User acknowledges that access to and use of this Website is subject to these TERMS OF USE and any expanded access or use must be approved in writing by the Company.
– Passwords are for user’s individual use
– Passwords may not be shared with others
– Users may not store documents in shared folders.
– Users may not redistribute documents to non-users unless otherwise stated in their contract terms.

Changes or Updates to the Website

The Company reserves the right to change, update or discontinue any aspect of this Website at any time without notice. Your continued use of the Website after any such change constitutes your agreement to these TERMS OF USE, as modified.
Accuracy of Information: While the information contained on this Website has been obtained from sources believed to be reliable, We disclaims all warranties as to the accuracy, completeness or adequacy of such information. User assumes sole responsibility for the use it makes of this Website to achieve his/her intended results.

Third Party Links: This Website may contain links to other third party websites, which are provided as additional resources for the convenience of Users. We do not endorse, sponsor or accept any responsibility for these third party websites, User agrees to direct any concerns relating to these third party websites to the relevant website administrator.

Cookies and Tracking

We may monitor how you use our Web sites. It is used solely for purposes of enabling us to provide you with a personalized Web site experience.
This data may also be used in the aggregate, to identify appropriate product offerings and subscription plans.
Cookies may be set in order to identify you and determine your access privileges. Cookies are simply identifiers. You have the ability to delete cookie files from your hard disk drive.
This site is registered onwpml.orgas a development site.