<\/i>","library":"fa-solid"},"layout":"horizontal","toggle":"burger"}" data-widget_type="nav-menu.default">

Top

European EV Sales Increased Over 13% YoY in Q1 2023 with Tesla Model Y as Bestseller

  • EV sales penetration dropped to 18.4% in Q1 2023 from 27.6% in Q4 2022
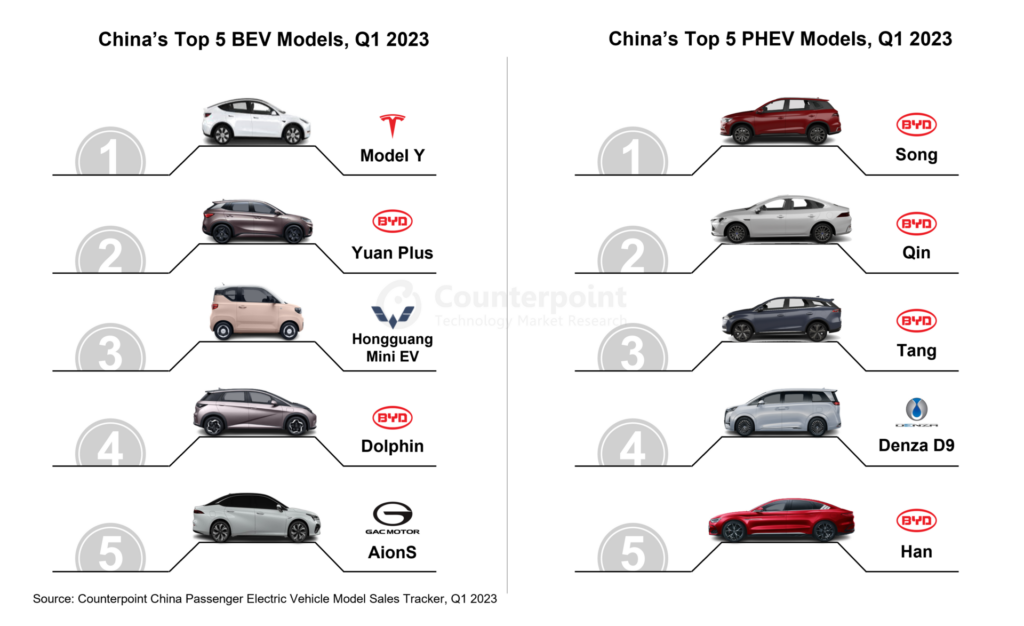
  • Tesla Model Y was the best-selling EV model across all major countries except Spain.
  • EV sales penetration is expected to exceed 25% again by the end of the year.

London, New Delhi,San Diego, Buenos Aires, Hong Kong, Beijing, Seoul – July 5, 2023

Europe’s passenger electric vehicle* (EV) sales increased by more than 13% YoY in Q1 2023, according to the latest research from Counterpoint’sEurope Passenger Electric Vehicle Model Sales Tracker. While overall passengercar salesin Europe are showing signs ofimprovement, they have not yet reached pre-COVID-19 levels. In terms ofoverall EV sales, Germany led the pack, closely followed by the UK, France, Italy, the Netherlands and Norway. Meanwhile, the share of EVs in total passenger vehicle sales was the highest in Norway and the Netherlands.

In Q1 2023,Battery EV(BEV) salesjumped 32% YoYwhile plug-in hybrid EV (PHEV) sales declined 13% YoY. Consequently, the EV share of total passenger vehicle salesdeclinedduring the quarter from that a year ago.

Meanwhile, there has beennotable progressin the European market for Hybrid EVs (HEV) and mild-hybrid EVs (MHEVs). This indicates that Europe is making efforts to tap into the lower-end EV market while simultaneously developing battery ecosystems and fostering a circular economy. These initiatives are being undertaken before placing a stronger emphasis on pure EV sales.

Europe EV Sales Share by brand

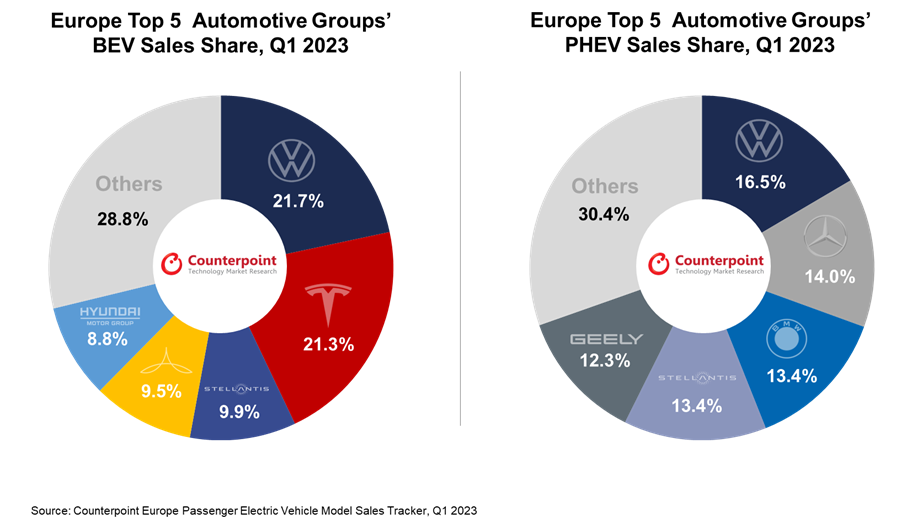
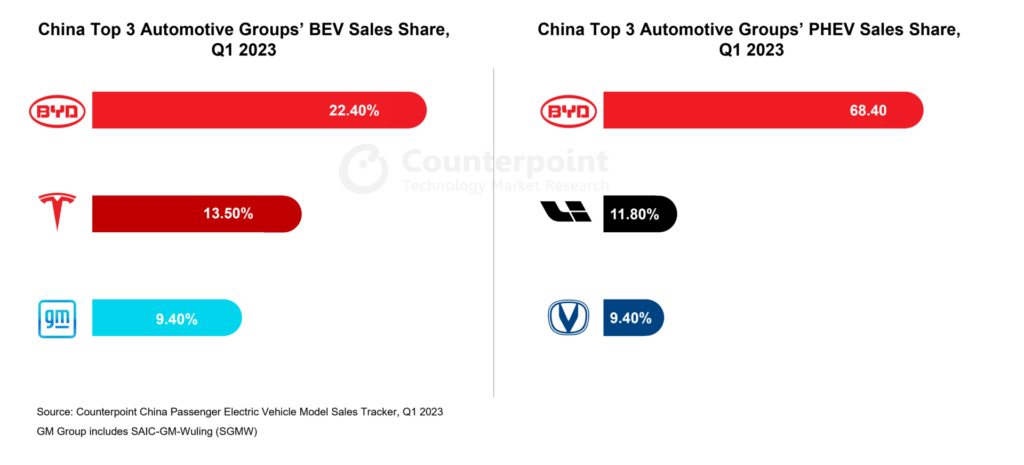
Commenting on the market dynamics,Senior Analyst Soumen Mandalsaid, “In Q1 2023, mostEuropean EV saleswere captured by the top five automotive groups – Volkswagen Group, Tesla, Stellantis, Mercedes-Benz and Hyundai-Kia. They accounted for nearlytwo-thirdsof the market share. When it comes to pure electric vehicles (BEVs),Teslaholds the second position, slightly behindVolkswagen. In the plug-in hybrid electric vehicle (PHEV) market, Volkswagen takes the lead, followed byMercedes-BenzandBMW.”

Chinese EV manufacturersstruggled to increase their market share in Europe during the quarter. However,MG, BYD, NIO, ORAandAiwaysmanaged to improve their sales compared to the previous year. On the other hand,LYNK & CO,HongqiandXpengfaced challenges in the European market. Nevertheless, we expect Chinese automakers to be able to enhance their market share in the coming quarters by offering cost-effective vehicles with advanced features, as the EV market is expected to perform better.”

Thetop-selling EV modelduring Q1 2023 was theTesla Model Y, followed by theVolvo XC40,Tesla Model 3, Volkswagen ID.3, and Audi Q4 e-tron. These top five models account for nearly a quarter of the total shipments. The Tesla Model Ydominatesthe market across major European countries, demonstrating Tesla’s strong brand presence in the region, except in Spain where it faces more competition.

European EV sales Q1 2023

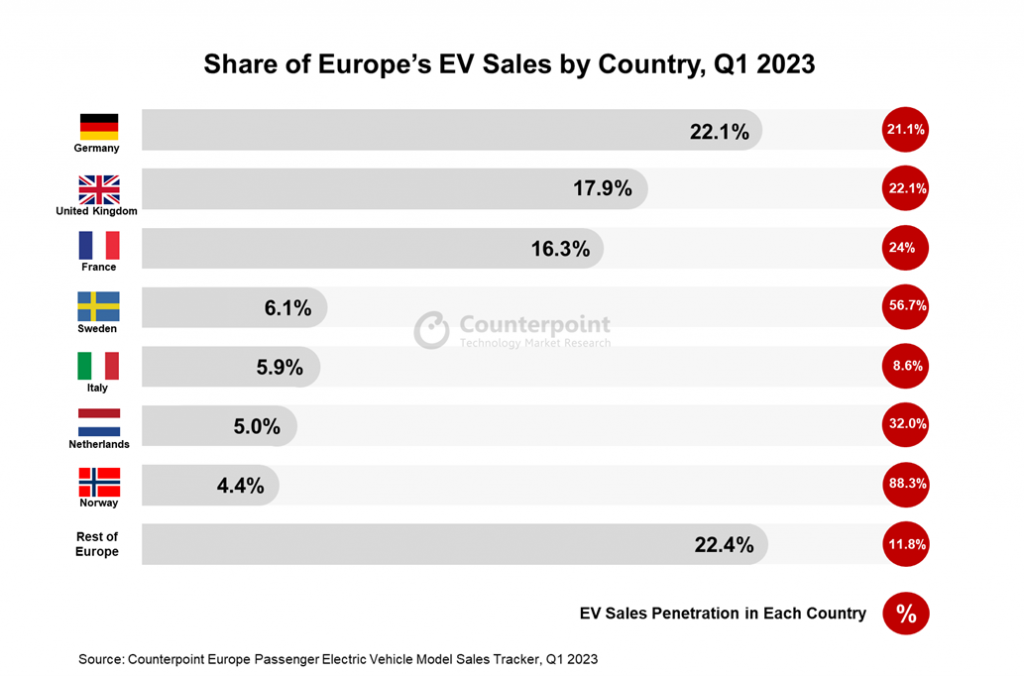
Discussing the market outlook,Research Vice President Peter Richardsonsaid, “The penetration of EVs in total passenger vehicle sales in Europe experienced adeclinethis quarter, dropping to 18.4% from 27.6% in Q4 2022. This is a significant shift compared to the previous trend of continuous QoQ growth. Except France, all major countries experienced this decline during Q1 2023.”

“Several factors contributed to this decline, including theunstable economic conditionsand the removal of EV subsidies by Norway. Germany, the largest EV market in Europe, experienced a decline as thelooming recessionandcautious consumer spendinghurt the EV market. These circumstances impacted the overall adoption of EVs in the region. However, since April, the European region has shown signs of recovery. As a result, we expect the share of EVs to rebound andsurpass 25%again by the end of this year.”

*Sales refer to wholesale figures, i.e. deliveries from factories by the respective brands/companies.

*The countries in this study include Austria, Belgium, Bulgaria, Croatia, Czech Republic, Denmark, Estonia, Finland, France, Germany, Greece, Hungary, Ireland, Italy, Luxembourg, the Netherlands, Norway, Poland, Portugal, Romania, Slovakia, Slovenia, Spain, Sweden, Switzerland, the UK and Ukraine.

*For EVs, we consider only BEVs and PHEVs. Hybrid EVs and fuel cell vehicles (FCVs) are not covered by this study.

The comprehensive and in-depth ‘Europe Passenger Electric Vehicle Sales Tracker, Q1 2018-Q1 2023’ is now available for purchase atreport.www.arena-ruc.com.

Feel free to reach us at press@www.arena-ruc.com for questions regarding our latest research and insights.

Background

Counterpoint Technology Market Research is a global research firm specializing in products in the TMT (technology, media and telecom) industry. It services major technology and financial firms with a mix of monthly reports, customized projects and detailed analyses of the mobile and technology markets. Its key analysts are seasoned experts in the high-tech industry.

Analyst Contacts

Abhik Mukherjee

Soumen Mandal

Neil Shah

Peter Richardson

Follow Counterpoint Research

press@www.arena-ruc.com

RelatedPosts

China EV Sales Defy Subsidy Cuts, Maintain Strong Growth in Q1 2023

  • BYD continued to lead China’s increasingly competitive EV market.
  • The market share of foreign brands declined by 4% points.
  • EV sales are expected to exceed 8 million units in 2023.

Beijing, New Delhi,London,San Diego, Buenos Aires, Hong Kong, Seoul – June 27, 2023

中国的客运电动汽车(EV)销售grew 29% YoY in Q1 2023, according to the latest research from Counterpoint’sChina Passenger Electric Vehicle Model Sales Tracker.Battery EVs(BEVs) made up nearly70%of the sales. There was a remarkable88% YoYsurge inplug-in hybridEV (PHEV) sales as well. Recently, PHEVs have been experiencing increased popularity in China. BYD secured its leading position with 79% sales growth and 9.8% points increase in market share YoY. Thetop 10 automotive groups, encompassing28 brands, collectively accounted for over80%of the totalpassenger EV sales.

Commenting on the market dynamics,Senior Research Analyst Soumen Mandalsaid, “The discontinuation of the 13-year-old New Energy Vehicle (NEV) purchase subsidy, paired with theTesla-triggered price war, had an adverse impact on domestic EV start-ups. Especially, smart EV brands such asNIO,XpengandNetareported disappointing sales figures compared to the previous quarter. Foreign brands, likeVolkswagen,BMW,Mercedes-Benz,Tesla,HyundaiandNissan, experienced a combined 4% points decrease in market share compared to a year ago. However, Tesla stands out as an exception. Other foreign brands havestruggled to offer strong competitionto domestic brands. Furthermore, Chinese brands such asBYD Auto,Dongfeng Motors,FAW,Great Wall MotorsandGeely Auto冒险超越国内边界建立吗their presence across Europe, Latin America and Asia-Pacific.”

China EV sales share Q1 2023 - China EV Sales Q1 2023

Eight of the top 10best-selling EV models were ofChinese originin Q1 2023. Except Tesla,no foreign modelswere able to secure a position in the top 10. Thetop 10 best-sellingmodelscollectivelyaccounted for46%of China’s passenger EV sales. Moreover, all the top 5 best-selling PHEV models in Q1 2023 were manufactured byBYD Auto.

China Top 5 models - China EV Sales Q1 2023

Discussing the market outlook,Associate Director Brady Wangsaid, “Thegrowth trajectoryof China’s passenger EV market is expected to continuethroughout 2023. Othersupportive policieshave beenimplementedto boost the market’sgrowthafter the elimination of NEV purchase subsidies. In May, China’s Development and Reform Commission released a strategic document aimed at promoting EV adoption in rural areas. This will encourage auto manufacturers to introduce more affordable models, enhance sales systems, and facilitate trade-in services for rural consumers. We expect China’s EV sales toexceed8 millionunits by the end of 2023.”

*Sales refer to wholesale figures, i.e. deliveries from factories by the respective brand/company.

*For EVs, we consider only BEVs and PHEVs. Hybrid EVs and fuel cell vehicles (FCVs) are not included in this study.

The comprehensive and in-depth ‘China Passenger Electric Vehicle Sales Tracker, Q1 2018-Q1 2023’ is now available for purchase atreport.www.arena-ruc.com.

Feel free to reach us at press@www.arena-ruc.com for questions regarding our latest research and insights.

Background

Counterpoint Technology Market Research is a global research firm specializing in products in the TMT (technology, media and telecom) industry. It services major technology and financial firms with a mix of monthly reports, customized projects and detailed analyses of the mobile and technology markets. Its key analysts are seasoned experts in the high-tech industry.

Analyst Contacts

Soumen Mandal

Neil Shah

Brady Wang

Counterpoint Research

press@www.arena-ruc.com

Related Posts

Good Show in Vehicle Solution, B2B Segments Helps LG Fight Macro Headwinds

  • Q3 2022 revenue increased 8% YoY to reach ₩16.12 trillion helped by higher sales of vehicle solutions.
  • Vehicle solutions revenue jumped 46% YoY during the quarter, helped by the improved global semiconductor supply and increased auto production in China.
  • Operating profit increased 33% YoY to reach ₩0.79 trillion.

LG Electronics(LG) reported an 8% YoY growth in Q3 2022 revenue to reach ₩16.12 trillion despite considerable macro headwinds but helped by higher sales in its vehicle solutions and business-to-business segments. Quarterly gross profit rose 5% YoY to ₩5.05 trillion while operating profit grew sharply by 33% YoY to reach ₩0.79 trillion.

During the quarter, investor sentiment was weak due to a steep devaluation of the South Korean won against the US dollar, hurt by strongeconomicheadwinds. The Korea Composite Stock Price Index (KOSPI) fell 6.5% in Q3 2022, which negatively affected LG’s performance.

LG Revenue By Segment, Q3 2021-Q3 2022

Financial highlights:

  • Revenue from the consumer electronics segment fell 1% YoY to ₩11.19 trillion due to increased logistics costs and lower demand for premium products like TVs. This segment contributed to 69% of total revenue during the quarter.
  • Among all the segments, vehicle solutions was the best performer. The segment’s revenue jumped 46% YoY to ₩2.35 trillion during the quarter helped by the relative improvement in the globalsemiconductorsupply chain. The segment accounted for 15% of the company’s total revenue.Chinafaced a lot of factory shutdowns in the preceding quarter due to regulations related to the COVID-19 pandemic. As factories reopened in Q3, there was an increase in production which helped meet the heightened demand for electronics components in the automotive industry. This, combined with an improved cost structure, helped LG achieve strong growth figures for the period.
  • Revenue from other businesses grew 23% YoY reaching ₩2.60 trillion. Despite an increase in sales, the profitability of this segment decreased 63% due to lower demand for IT products and higher raw material costs.
  • LG’s gross profit increased 5% YoY to reach ₩5.04 While the company’s operating profit grew sharply, gross profit growth was relatively muted because of increased market competition, low consumer demand, increased raw material prices, increased marketing expenses and the energy crisis.

Market outlook:

The current global business environment is quite difficult, burdened by rising inflation, supply chain disruptions,geo-politicaltensions, increased logistic costs and the energy crisis, which have weighed negatively on consumer sentiment across industries. LG plans to prioritize on the development of new software platforms and adjust its channel inventory to overcome the ongoing crisis. LG will focus on its premium consumer electronics products and will likely maintain maximum margins to secure high profits. The company will also apply cost-saving initiatives to reduce raw material costs.

The vehicle solutions segment has the highest potential to expand as the global semiconductor shortage is easing out and OEMs like Honda, GM and Stellantis are working to jointly produce battery cells. Moreover, LG has secured an order worth ₩1 trillion fromTeslato supply automotive camera modules for the Tesla Model 3, Model Y and Cybertruck. These new deals will drive LG’s vehicle solutions segment to a great future.

LG is also strengthening its focus on new technologies likemetaverseandrobotics. It recently partnered with KT Corporation to expand its AI robot service business. LG will also establish an R&D centre and develop robots for logistics, education and healthcare services. LG’s strategic partnership with TmaxMetaverse will boost development across metaverse solutions and web-based metaverse services. The company will have the opportunity to capitalize on these technologies by the time they mature at the end of the decade, which will help it boost revenue.

Related Posts

Tesla’s stellar Q3 performance

  • Tesla delivered nearly 343,900 vehicles during Q3 2022, an increase of 42.4% YoY
  • Logistics remains a major bottleneck for Tesla deliveries
  • Tesla can exceed 1.3 million unit deliveries by year end with current trajectory

Tesla rebounded during Q3, after experiencing a relativelyweak second quarter. During Q3, Tesla delivered nearly 343,900 vehicles, a 42.4% annual increase and a sequential increase of 35%. The combined deliveries of Model S and Model X grew by more than 100% YoY, reaching 18,670 units, while the combined deliveries of Model 3 and Model Y increased by 40% YoY. China is the leading market for Tesla followed by the USA and Europe.

Tesla’sShanghai Gigafactorysurpassed the previous quarterly production rate and remains the main export hub supplying to most markets outside North America. The gigafactory updated its production ramp in July this year. The Berlin Gigafactory is also producing more than 2,000 units of Model Y, weekly. A lot of work is left to bring the Berlin plant to full capacity as it is only slowly reaching its planned output. As winter approaches, and it is feared thatEuropewill experience an energy crisis, Musk somehow remains optimistic about vehicle production in the Berlin plant and expects that no production cuts will happen.

Tesla Revenue by segment-Q3 2022_Counterpoint

Q3 financial summary:

During Q3, Tesla’stotal revenuegrew by almost 56% YoY, reaching $21.4 billion. Tesla generated $18.6 billion from the vehicle segment, an increase of 55% YoY. This is largely due to increased global deliveries and higher vehicle ASPs.

Although revenue fromvehicle leasingduring Q3 has increased significantly by 61% YoY, revenue from the sale of automotive credits grew by just 2.5% YoY.

Revenue generated from the company’sother businesseslike energy storage, solar panel deployment, charging and vehicle servicing also grew by 62.5% YoY, exceeding $2.7 billion.

Gross profit, was $5.3 billion an increase of 47% YoY. But below expectation due to the high cost of raw materials, upgrading the production ramps (Berlin, Texas and 4680 cell factories) and increased logistic costs.

特斯拉汽车一直面临着一个严重的问题deliveries. There weren’t enough transport vehicles available with its logistic partners to handle the volume of Tesla deliveries. This increases the logistic cost which, in turn, is affecting theper-vehicle cost.

3.4% of the total revenue has been diverted towardsR&D expenditureduring Q3 2022. R&D spending stood at $0.73 billion, an increase of 20% YoY and sequentially growth of 10%. This is apparently due to the development of Tesla’s Optimus Robot and full-self driving (FSD) capability. This year Tesla postponed its AI Day to showcase a working prototype of its humanoid Optimus Robot whose software is very similar to the FSD system.

TheFSD betausers reached 160,000 in Q3, up from 100,000 in Q2. Tesla is also going for a wider release of its FSD beta during Q4 2022. Hence, new Tesla owners will have the option to avail FSD beta immediately. Currently, there is an eligibility criteria to avail the FSD beta. With the resignation of Andrej Karpathy, Tesla’s AI and Autopilot director, it was perceived that the company’s FSD development is likely to stall, but it seems Tesla has made good progress and is confident of its path toward full autonomy, despite some alarming failures among beta testers.

Tesla Pdn and deliveries-Q3 2022_Counterpoint

Outlook:

Despite a weak second quarter, Tesla’s yearly deliveries may cross 1.3 million units by the end of 2022. Tesla is expected to make its first delivery of the Tesla Semi truck to Pepsi on December 1stthis year. The Semi is claimed to have a range of 500 miles with cargo at ground level. We are also expecting to see the company’s long-advertised Cybertrucks becoming available by mid-2023. Alongside these, Tesla has also increased the production of its in-house designed 4680 cells. The constant production ramp upgrade in its gigafactories around the globe is likely to keep Tesla the market leader in thebattery electric vehicle segment.

Related Posts

China Cloud on Tesla’s Q2 2022 Numbers; Fundamentals Remain Strong

  • Tesla sold more than 254,000 vehicles in Q2 2022, an increase of 27% YoY, which was below general expectations.
  • This was the first time since the COVID-19-hit 2020 that the automaker experienced a sequential decline in sales.

After achieving phenomenal growth inQ1 2022, Tesla’sglobal salesduring Q2 2022 grew by just 27% YoY to over 254,000 units, falling short of expectations. In QoQ terms, the sales fell 18%. Business during Q2 2022 was affected by COIVD-19-related shutdowns in China. Production units in and around Shanghai were closed temporarily due to strict lockdown measures. As a result, Tesla sold just 89,000 cars across China during Q2 2022. Cumulative sales in China during April and May fell by more than 66% YoY. The situation improved only after the production returned to full capacity in June.

It was expected that the Berlin Gigafactory would boost Tesla’s sales inEuropeafter becoming operational in March 2022. But the production was lower than expected. A few rumored reasons for the low production are litigation with the German government and a shortage of human resources. The Berlin factory is currently focusing on the production and deliveries of the Model Y across Europe.

Tesla bets on in-house battery cell manufacturing

Tesla delivered its first batch of cars equipped with the in-house 4680 battery cells and structural battery packs during this quarter. These cells use a little amount of lithium. With lithium prices soaring worldwide, 4680 cells will help lower the vehicle manufacturing cost. The cells will power the Model Ys coming out of the Berlin Gigafactory. However, Tesla will shut the Berlin Gigafactory for a couple of weeks during autumn to upgrade the production system of 4680 cells.

Other businesses see 33% YoY growth

Although Tesla’s vehicle sales in Q2 2022 failed to meet expectations, its other businesses like energy deployment and storage, charging and other services grew more than its vehicle segment. Energy deployment, energy storage, charging and other services grew by 33% YoY. Tesla deployed 106 MW of solar panels and 1.13 GWh of energy storage during Q2 2022. It installed 247 new superchargers worldwide, bringing its global supercharger number to 3,971 units with more than 36,000 connectors.

Tesla converts 75% of its Bitcoins to fiat currency

During Q2 2022, Tesla also converted 75% of its Bitcoins to fiat currency. This was done to have a better cash position against the backdrop of COIVD-19-related uncertainties. This conversion reduced Tesla’s digital assets to $218 million and added $936 million in cash to Tesla’s balance sheet.

Tesla Revenue by Segment, Q2 2021-Q2 2022_Counterpoint
Source: Tesla Q2 2022 Financials and Counterpoint Analysis

Q2 2022 Financial Results

  • During Q2 2022, Tesla sold more than 254,000 vehicles at 27% YoY growth. The Model 3 and Model Y comprised more than 93% of these sales.
  • Revenue from vehicle sales stood at $14.6 billion. Total revenue grew by almost 42% YoY, with the COVID-19 impact on China reducing the QoQ number by about 10%. Revenue generated from automotive credit also declined slightly compared to Q2 2021.
  • The company’s other services, like energy storage, charging and insurance, contributed to 14% of its total revenue. Revenue from insurance and vehicle services saw a 54.2% YoY growth, while the energy storage and charging segment grew by just 8% YoY. The energy storage business was expected to perform better but was restricted due to semiconductor-related supply issues.
  • Tesla’s gross profit during Q2 2022 reached $4.2 billion and stood at 25%. Though the shutdown in China adversely affected the business, increase in US deliveries along with the higher average vehiclepricehelped Tesla earn 47% more profit YoY.
  • R&D costs grew 16% YoY during Q2 2022. Tesla is trying to achieve complete autonomy by 2024 by perfecting Full-Self Driving (FSD) software. But the resignation of Andrej Karpathy, the director of artificial intelligence and autopilot system at Tesla, in mid-July is likely to stall the progress of this project, which is expected to get delayed by a year.
特斯拉生产和交货,Q2 2021-Q2 2022_Counterpoint
Source: Tesla Q2 2022 Financials and Counterpoint Analysis

Market Outlook

Despite experiencing a dip during the second quarter of 2022, Tesla’s future outlook seems strong and promising with strong fundamentals. Tesla has secured the supply of LFP batteries for its Shanghai Gigafactory by signing a deal with BYD. Transitioning to LFP batteries and 4680 battery cells will help Tesla reduce vehicle manufacturing costs. Moreover, Tesla expects the Berlin Gigafactory production capacity to cross 100,000 units by the end of 2022. With all these developments, Tesla is expected to cross more than 1.2 million units of vehicle deliveries by the end of 2022.

Related Posts:

LG Electronics Revenue at New Record High in Q1 2022

  • Revenue reached a new record high of $14.48 billion during the quarter.
  • Operating profit recovered to a respectable level.
  • Other businesses registered the highest QoQ revenue growth of 51%.

In 2021, LG shut itssmartphonebusiness, which was generating nearly 6% of its total revenue. The closure of this segment has not affected the company much.LG’s revenue increased by more than 16% YoY in Q1 2022 to reach a new record high of $14.48 billion. 46% of this revenue was generated by strong demand for premium products across overseas markets. LGInnotek’s numbers are not included in this analysis.

Revenue from the vehicle solution business grew sequentially. Vehicle sales have been facing a tough time globally due to component shortages but LG is benefiting from the slight rebound. It has alsosigned dealswith leading auto OEMs like Mercedes-Benz, to whom it will provide ADAS andcockpitsolutions. Besides the electronics and vehicle solution segments, LG’s other businesses also witnessed growth in Q1 2022. There has been a sustainable growth in the sales of products for the B2B segment. Moreover, LG’s energy-related solutions (LG Chem) business, which has been included in other segments, contributed to a steep revenue rise. Price hikes of certain high-demand products also contributed to the high revenue generation during Q1 2022.

The revenue could have been more in the absence of the latest COVID-19 lockdowns in China and the Russia-Ukraine war. Also, therestricted supplyof a few key raw materials and increased logistics costs negatively impacted the production.

LG Revenue by segment Q1 2021-Q1 2022_Counterpoint Research

Q1 2022 Financial Highlights

  • Revenue from the consumer electronics segment stood at $10.03 billion, an increase of 3.2% QoQ. This segment contributed to nearly 69% of the total revenue.
  • Revenue from the vehicle solutions segment stood at $1.56 billion, an increase of 13.3% QoQ. This segment contributed 10.8% of the total revenue. By strengthening business risk management and continuously improving the cost structure across products, LG reduced this segment’s losses by 33% in just two quarters.
  • Revenue from other businesses reached $2.89 billion, an increase of 49% QoQ. This huge increase was due to the transfer of LG’s electric battery business to this segment from the vehicle solutions segment.
  • LG’s gross profit reached $4.93 billion, a 28% QoQ increase. Gross profit was down during the last quarter due to supply chain disruptions following COVID-19 and increased raw material prices.

MarketOutlook

LG Electronics’ future looks promising with the adoption of newer and advanced technologies across segments. Technologies like Plug-in for Intelligence Equipment (PIE) and Machine-learning based Vision Inspection system (MAVIN) are helping the company to minimize material loss and logistic delays. All these developments will have a positive impact on the coming quarter’s financials.

In the vehicle solutions segment, we expect to see a rise in business as demand forsmart cartechnology combined with increased demand forin-vehicle connectivityis increasing. Being a leader in this segment, LG will leverage its position by forming various JVs and partnerships that will boost its future revenue generation from this segment. Apart from providing hardware solutions for automotive, LG is also entering the automotive software solutions space with its recent acquisition of TISAX and Cybellum.

Apart from the electronics and vehicle solutions segments, developments in LG’s other segments like energy storage and sales have been noteworthy. Recent partnerships for energy solutions have provided the segment with the necessary boost. Moreover, the increasing demand for EVs will only help the energy solution segment to grow from this point onwards.

Related Posts

NIO Registers Nominal Growth in Q4 2021

NIO is a leader in China’s smart electric vehicle (EV) market. After starting its business in 2014, NIO delivered its first model, the ES8, in December 2017. Since then, it has grown rapidly. The company has also entered the international market with the launch of operations in Norway in the latter half of 2021.

In China, NIO operates in the premium price segment where it competes with brands like Audi, BMW and Tesla. However, NIO plans to launch a subsidiary brand for the low-tier and mid-tier segments. While this sub-brand will compete against automakers like Wuling, Volkswagen and Toyota, NIO as a brand will continue its operation in the premium segment.

Apart from its EV business, NIO also provides battery and vehicle charging solutions through its subsidiary NIO Power. In December 2021, NIO Power had more than 700 swapping stations across China, which had already provided a total of 5.3 million swaps. NIO also has 3,020 power chargers and 3,319 destination chargers in various locations across China.

Q4 2021 Results

In late March, NIO released its unaudited financial results for Q4 2021 that showed nominal progression across most metrics.

Vehicles Delivered

During Q4 2021, NIO delivered 25,034 units of cars, which is an increase of 2.4% QoQ and 44.3% YoY. NIO’s total vehicle sales grew 109% annually to reach 91,429 units in 2021. This growth was mainly driven by rising EV adoption in China and NIO’s business initiation in Norway.

Revenue

Keeping parity with vehicle sales, NIO’s total revenue for Q4 2021 stood at $1.55 billion, a 1% sequential increase. Revenue from vehicle sales was $1.45 billion, a 6.7% increase from the third quarter. For the full year of 2021, revenue from vehicle sales reached $5.2 billion, a 118% increase compared to 2020.

While around 92% of NIO’s 2021 revenue was generated through vehicle sales, revenue from power and services also increased.

Gross Profit

Although NIO saw nominal sales and revenue growth sequentially in Q4 2021, gross profit declined 14.7% QoQ to $266.7 million, giving a gross margin of 17.2%, which also decreased by 3% points QoQ. Regulatory credits helped its gross margin during Q3 2021.

Research and Development

During Q4 2021, the R&D cost was $257.2 million, amounting to more than one-third of the total R&D cost for 2021. This jump suggests NIO is working on several new vehicle projects as well as developing new services. In January last year, NIO launched its autonomous driving platform ‘NIO Autonomous Driving’. Though the platform is restricted to ADAS, it is expected that L4/L5 autonomy will be developed on this platform. Nio started the deliveries of ET7 in March this year. So, a part of R&D cost might have been mobilized even towards software development to make it a best-in-class product.

Market Outlook

With EV sales accelerating compared to previous years, the company expects to achieve revenue growth of 20.6% to 25.1% during the first quarter of 2022. However, China’s EV market is currently going through a slack period for two main reasons: Firstly, rising COVID infections are causing widespread city and even regional lockdowns, and secondly,raw material pricesfor EV batteries are rising (nickel and lithium prices have increased sharply).

Due to the rising costs, EV manufacturers are either increasing prices or sacrificing profit. Entry-level and mid-level brands are likely to be most impacted, but even premium brands will be affected eventually.

While OEMs are reluctant to increase their vehicle prices, Xpeng, another leading Chinese EV manufacturer, has recently increased its vehicle prices by at least $1,500. Even Tesla and BYD, which are believed to have strong and stable supply chains, have been forced to increase prices. NIO has resisted the move so far and expects to benefit from strong demand in the short term.

Related Posts

realme’s SEA smartphone shipments grew fastest in Q2 at 141% YoY, despite a declining market

  • realme entered the top 5 brands in all key SEA markets (Cambodia, Indonesia, Malaysia, Myanmar,
    Philippines, Singapore,Thailandand Vietnam) for the first time.
  • In other Asia Pacific markets like Australia, Taiwan, and Pakistan, realme was successful in becoming
    one of the top 5 brands. In Bangladesh, it grew 1000% QoQ (albeit from a low base) to take 6% of the
    market.

New Delhi, Mumbai, Hong Kong, Taipei, Seoul, San Diego, London, Buenos Aires – Aug 28th, 2020

According to the latest research from the Counterpoint Research Market Monitor service, realme continued to be the fastest-growing brand in the South East Asia (SEA) region, growing 141% YoY and 64% QoQ to capture 13% market share. Despite the SEA smartphone market declining 19% YoY amidst the COVID-19 outbreak, realme continued its growing streak and became one of the top 5 smartphone brands in all key markets in the region.

Exhibit 1: realme performance in key SEA markets Q2 2020

In the Philippines, realme grew 97% QoQ and surpassed Oppo, Xiaomi, and Samsung to take the second position; rising from the fifth spot in the previous quarter. Similarly, in Malaysia, realme surpassed Apple, Xiaomi, and Oppo to reach the third place in the market. realme is the popularizer of “5G” in Thailand, it ranked first in 5G shipments with a 43% share of the nascent 5G market. In Singapore, realme grew 100% QoQ to enter the top 5 brands for the first time.

With these growth figures, realme was successful in entering the top 5 brands in all key SEA markets (Cambodia, Indonesia, Malaysia, Myanmar, Philippines, Singapore, Thailand and Vietnam).

除了主要海市场,realme表现良好in other Asia Pacific markets like Bangladesh, Australia, Taiwan, and Pakistan. In Pakistan and Australia, realme ranked fourth, while in Taiwan it managed to grab the fifth spot. realme officially entered Bangladesh in February 2020, and within one quarter it managed to gain a 6% market share with 1000% YoY growth (albeit from a small base).

Commenting on realme’s growth,Research Analyst,Abhilash Kumarsaid, “The right channel strategies, effective marketing and good value-for-money products across all price bands helped realme defy the market decline. The COVID-19 pandemic led consumers towards online sales platforms where realme has a strong presence. Innovative initiatives like “Zero-touch shipping” during the outbreak helped realme keep the offline momentum as well. In addition, realme has been proactive in launching new models online without any postponements. Coupled with social media campaigns and strong word-of-mouth marketing, the brand has positioned itself strongly, especially among younger age profile segments.”

realme致力于将最先进的technology within corresponding price bands to its consumers. In addition to creating and implementing a future-orientated 5G expansion strategy; it is one of the first brands to bring 5G devices to the mass market price bands. It also introduced innovations such as “125W UltraDart Charge” fast charging technology and is one of the first brands to launch smartphones with the Snapdragon 865 and Snapdragon 765G chipsets. Also, its recent expansion beyond smartphones into the IoT space with products like the smart band, smartwatch, TWS, and smart TVs will help the brand build a more holistic ecosystem, further strengthening its position in the market.

Analyst Contacts:

Abhilash Kumar

Tarun Pathak

Shobhit Srivastava

Varun Mishra

Follow Counterpoint Research
press(at)www.arena-ruc.com

One brand that’s defying the global smartphone market slowdown: realme shows 800% growth in 3Q 2019

As our 2019Q3 numbers are being finalized we noticed one brand standing out in the global smartphone slowdown. Overall market size has been shrinking showing negative growth for 7 consecutive quarters. Most of the brands have also been experiencing negative growth. However there are a handful of brands like Xiaomi, Tecno showing positive growth. Among them there was one brand that really stood out. It was realme (spelled with all small cap). This rising brand was established on May 2018 so it’s just a year old. But it has become the fastest growing smartphone brand. It registered over 800% annual growth in Q3 2019. We think it shipped over 10 million smartphones and came in 7th place in the global smartphone market for the first time.

Indiaand Indonesia are the most important markets for realme, contributing to more than 80% of its shipments. In India, realme ranked 4th in the smartphone market with 16% share, its highest market share ever, in Q3 2019. Its aggressive online channel strategy helped it achieve this milestone. It was the number one online brand on Flipkart in Q3 2019 and second in the overall online market.

In Indonesia, realme was the fastest brand to reach one million units in Q3 2019 driven by strong sales of realme C2 and realme 3. It is now looking to expand its position in other South East Asian(SEA) markets as well. The brand has expanded rapidly across more than 20 countries.

The core strength of the brand lies in its fast execution. realme has been quick to bring premium features to the budget segment and mass market. For instance, it was among the first few brands to bring features such asquad-cam, 64MP rear camera, water-drop design, pop-up selfie, within the $100-$250 price band. This has resonated well especially among young consumers seeking value for money.

Overall, strong word-of-mouth, social media campaigns and connecting with young consumers has helped the brand grow as well. When it comes to marketing it has focused more on events, such as college festivals, that involve one-to-one connection with its core customers. It has stayed away from big budget marketing events that involve huge marketing spends.

The strong performance of realme shows there still is growth in the market despite the several quarters of negative growth in the global smartphone market. Targeting the right geographical markets, channels and consumers seems to be the winning recipe. The value for money proposition is also powerful in times of stagnant economic growth globally.

LATAM Smartphone Market Reached Highest Ever ASP in 2Q18

Growth during the quarter was led by OEMs’ aggressive sell-in.

New Delhi, Hong Kong, Seoul, London, Beijing, San Diego, Buenos Aires –August 21st, 2018

According to the latest research from Counterpoint’s Market Monitor service, in Q2 2018 the LATAM smartphone shipments grew 2% YoY in volume and 8% in value. Chile and Mexico were the markets that led the growth, driven in part by Huawei and Motorola.

Commenting on the findings Senior Analyst,Tina Lu, said, “LATAM’s smartphone sell-in grew a marginal 2%, despite the economic volatility created by political turbulence. Motorola and Huawei led the volume growth with high double-digit growth, benefiting from the aggressive launch of new products in the mid-range (USD $100-$250) segment.”

进一步增加,蒂娜说,“消费者在拉丁America are slowing down in their replacement rate but investing more money per purchase. Despite the multiple devaluations that most LATAM currencies have experienced during Q2 2018, the smartphone average selling price (ASP) reached USD187, around an 8% YoY increase. This was the region’s highest ASP ever. LATAM device prices are highly sensitive to currency fluctuations, as most of the countries in the region import devices, and those that require local manufacturing, still depend highly on sourcing parts internationally. Price band growth has been polarizing at both ends of the price spectrum.”

Exhibit 1: LATAM Smartphone Shipment Share by Brands

LATAM Smartphone Shipments (% Share)

Source: Counterpoint Research: Quarterly Market Monitor Q2 2018

Commenting on the region’s brand evolution, Research Analyst,Parv Sharma, said, “Consumers in the LATAM region need to trust the brand before adopting it. So, this leads to quite a concentrated market with the top five brands, representing almost three-quarters of all the smartphones shipped. These brands have all invested a great deal of resources both in terms of money and management time, within the region, to earn local consumer trust. Huawei enjoyed a 43% YoY growth, the biggest surge among the top five brands. Its success is a result of the company consistently building brand awareness in the region. It has also increased its presence in America Movil. But the channel is quite stacked with Huawei inventory. Motorola also had double digit volume increase, but its volume growth was leveraged by the C series which took a toll on its ASP.”

Exhibit 2: LATAM ASP evolution: Q2 2017 vs Q2 2018

LATAM Smartphone ASP Growth by Key Brands
Source: Counterpoint Research: Quarterly Market Monitor Q2 2018

Market Summary:

  • Samsung captured more than 36% of the LATAM market. It was, once again, the absolute leader in the market, but it lost share YoY.
  • Despite the decline in share, Samsung had a 25% increase in ASP, thanks to increasing midrange sales.
  • 摩托罗拉达到12.4%的市场份额。的刷新models in the E and G series have increased Motorola’s overall sell-in volumes. However, its Moto C is still the best-selling model and this success affected its ASP, driving it to decline 33% YoY.
  • Huawei reached 11.8% market share. It was third in the market, but just 0.8pp behind Motorola.
  • Huawei’s ASP increased 32% YoY. It is the brand with the highest growth amongst the top selling brands.
  • LG had the biggest YoY drop; a decline of more than 26%. It is the only brand in the top five chart that had flat YoY movement on ASP.
  • Apple remained almost flat with 4% market share, though it had more than 10% growth in ASP.
  • Apple’s ASP growth was driven by the launch of iPhone X which was offset by strong sales of iPhone 6 in the region.

The comprehensive and in-depthQ2 2018 Market Monitoris available for subscribing clients. Please feel free to contact us atpress@www.arena-ruc.comfor further questions regarding our in-depth latest research, insights or press enquiries.

The Market Monitor research is based on sell-in (shipments) estimates based on vendor’s IR results, vendor polling triangulated with sell-through (sales), supply chain checks and secondary research.

Analyst Contacts:

Tina Lu
+54 91160411221
tina@www.arena-ruc.com

Parv Sharma
+91 974-259-6030
parv@www.arena-ruc.com

Peter Richardson
+44 791-723-1934
peter@www.arena-ruc.com

Follow Counterpoint Research
press(at)www.arena-ruc.com

Term of Use and Privacy Policy

Counterpoint Technology Market Research Limited

Registration

In order to access Counterpoint Technology Market Research Limited (Company or We hereafter) Web sites, you may be asked to complete a registration form. You are required to provide contact information which is used to enhance the user experience and determine whether you are a paid subscriber or not.
Personal Information When you register on we ask you for personal information. We use this information to provide you with the best advice and highest-quality service as well as with offers that we think are relevant to you. We may also contact you regarding a Web site problem or other customer service-related issues. We do not sell, share or rent personal information about you collected on Company Web sites.

How to unsubscribe and Termination

You may request to terminate your account or unsubscribe to any email subscriptions or mailing lists at any time. In accessing and using this Website, User agrees to comply with all applicable laws and agrees not to take any action that would compromise the security or viability of this Website. The Company may terminate User’s access to this Website at any time for any reason. The terms hereunder regarding Accuracy of Information and Third Party Rights shall survive termination.

Website Content and Copyright

This Website is the property of Counterpoint and is protected by international copyright law and conventions. We grant users the right to access and use the Website, so long as such use is for internal information purposes, and User does not alter, copy, disseminate, redistribute or republish any content or feature of this Website. User acknowledges that access to and use of this Website is subject to these TERMS OF USE and any expanded access or use must be approved in writing by the Company.
– Passwords are for user’s individual use
– Passwords may not be shared with others
– Users may not store documents in shared folders.
– Users may not redistribute documents to non-users unless otherwise stated in their contract terms.

Changes or Updates to the Website

公司有权改变、更新or discontinue any aspect of this Website at any time without notice. Your continued use of the Website after any such change constitutes your agreement to these TERMS OF USE, as modified.
Accuracy of Information: While the information contained on this Website has been obtained from sources believed to be reliable, We disclaims all warranties as to the accuracy, completeness or adequacy of such information. User assumes sole responsibility for the use it makes of this Website to achieve his/her intended results.

Third Party Links: This Website may contain links to other third party websites, which are provided as additional resources for the convenience of Users. We do not endorse, sponsor or accept any responsibility for these third party websites, User agrees to direct any concerns relating to these third party websites to the relevant website administrator.

Cookies and Tracking

We may monitor how you use our Web sites. It is used solely for purposes of enabling us to provide you with a personalized Web site experience.
This data may also be used in the aggregate, to identify appropriate product offerings and subscription plans.
Cookies may be set in order to identify you and determine your access privileges. Cookies are simply identifiers. You have the ability to delete cookie files from your hard disk drive.