<\/i>","library":"fa-solid"},"layout":"horizontal","toggle":"burger"}" data-widget_type="nav-menu.default">

Top

Transsion Updates Q2 2023

Expansion, Premiumization Drive Transsion’s Record Quarter

September 4, 2023

Transsion Holdings reported revenues of RMB 25.03 billion for the first half of 2023, registering a growth of 8.3% YoY. Net profit grew 27.2% YoY primarily due to better product mix (higher proportion ofsmartphonesas compared to feature phones, with the former accounting for 92% of group revenues) and geographical expansion into higher-value markets.

Q2 2023 was the bright spot as revenues were up 30.7% while net profit grew 83.9%. It was the best quarter in Transsion’s history in both revenue and net profit terms. Gross margins also improved to 24.5%, up 2.4% from a year ago.

Much of Transsion’s turnaround in the key financial metrics above can be attributed to a rebound in macroeconomic fundamentals in theAfricanhome market and beyond. Most importantly, inflation rates have come down while food prices have stabilized. Local currencies have also found a stronger footing while several indebted countries across theemergingmarkets have managed to secure restructuring packages with lenders. As Africa’s most entrenched handset company, thanks to its deep channel penetration and marketing heft, Transsion once again benefitted the most from the upturn.

Transsion 2023年H1的运营成本增加了5%YoY as the company is ramping up its operations, particularly in newer markets. It has been aggressive with sales and marketing despite the cyclical downturn, with the spending on these activities increasing 23.6% YoY in H1 2023. R&D spending was also up 20.6% YoY to drive premiumization efforts and develop higher-value products to target the new markets. Costs attributed to management grew 6% YoY, whereas cash flow from operating activities turned positive, primarily due to the reduction in the cost of components and materials, as the company is reducing its inventory and moving towards a leaner operating model.Transsion group smartphone sales by region According to Counterpoint Research, Transsion’s smartphone sales volume grew 3% YoY in the first half of 2023 and 17% YoY in Q2 2023 as demand for TECNOsmartphonesincreased globally, especially in the company’s newer markets. This helped Transsion’s cash flow, as cash on hand increased 61% YoY to reach an all-time high of RMB 12.79 billion. The number of inventory days dropped further to 61, from 86 a year ago. Therefore, the inventory problem that has been troubling the company for the past year has successfully been managed.Average selling prices across different regions for transsion group Much of Transsion’s financial successes can be attributed to its continued commitment to entering new markets. In Q2 2023, Africa accounted for 57% of Transsion’s smartphone sales volume, a net drop of 8% from a year ago. Outside Africa, Transsion smartphone sales grew 35% in Q2 2023, most notably in Latin America, EasternEurope,Indiaand Southeast Asia.
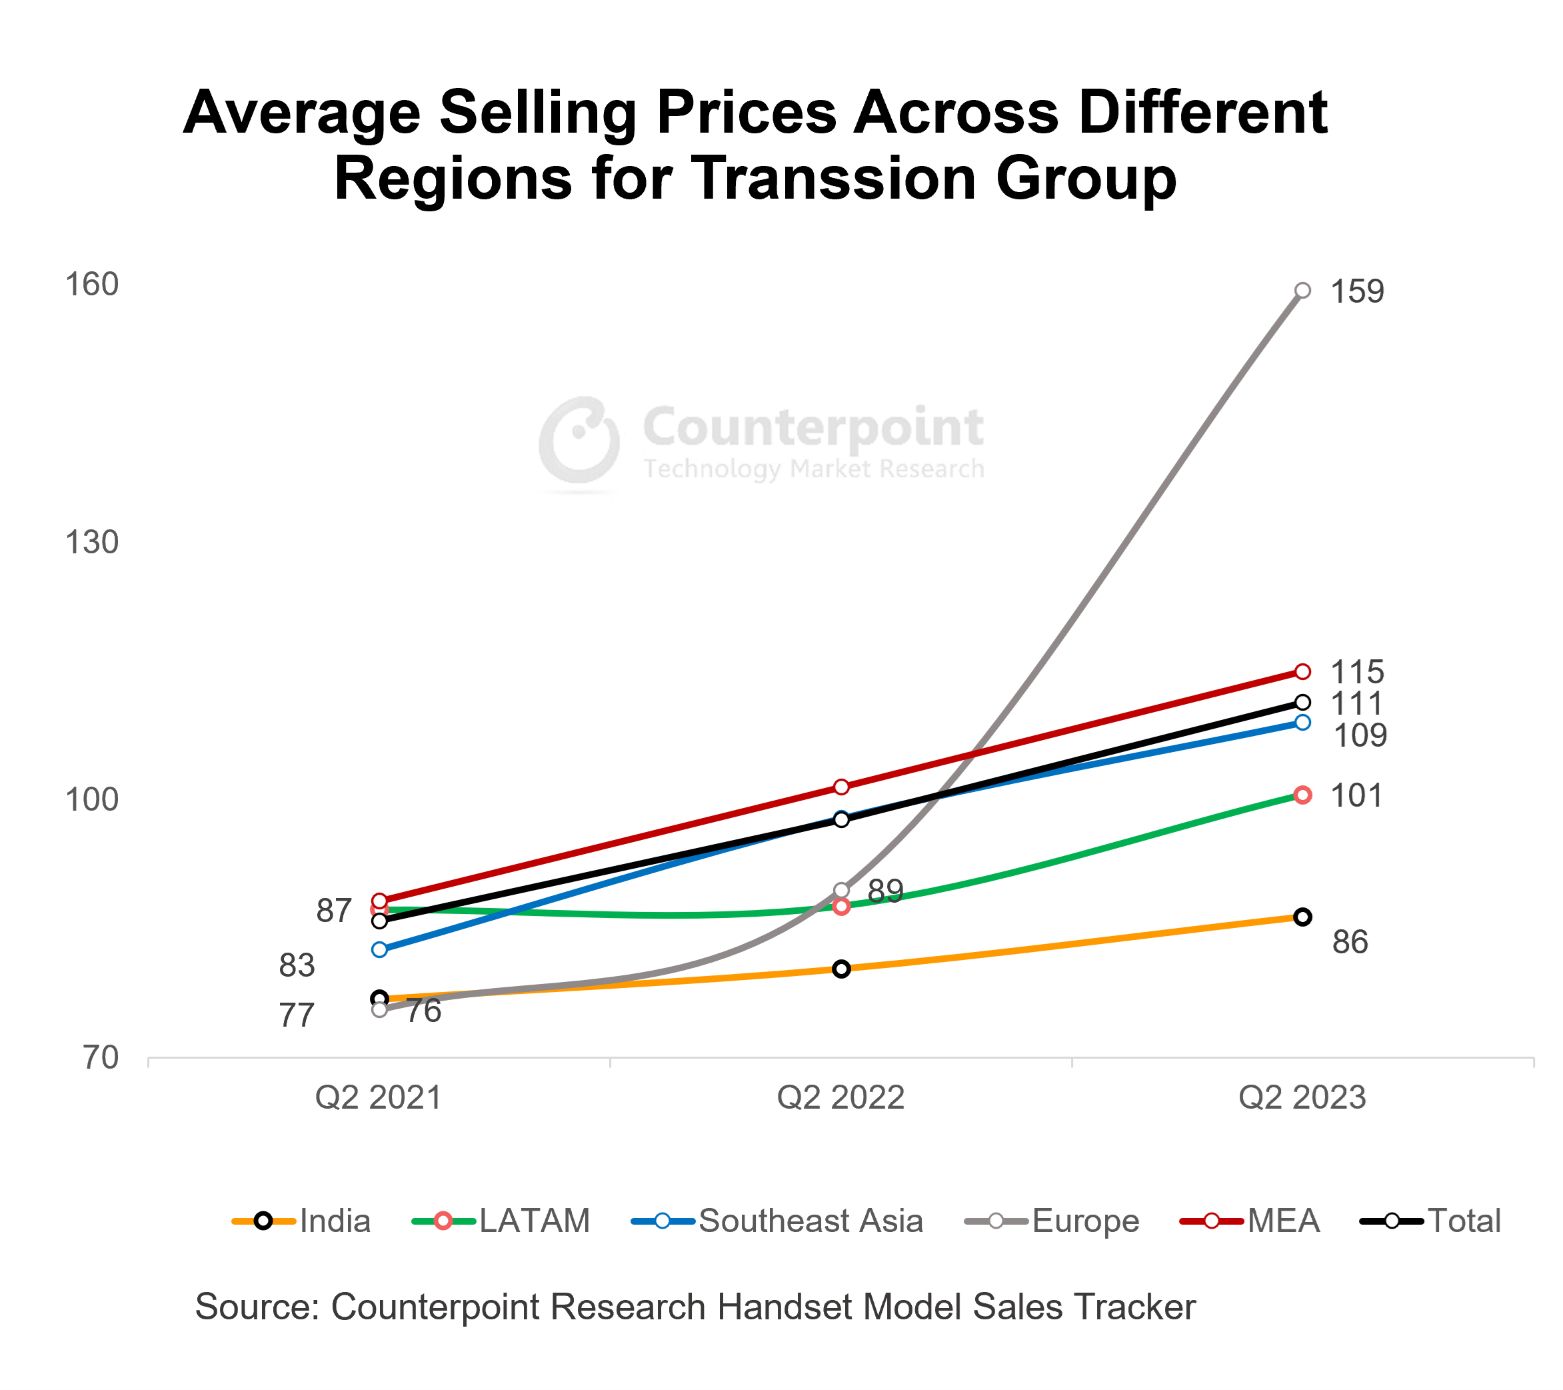
The reason for Transsion’s big increase in profitability is found in its ability to upsell to customers. Average selling prices (ASP) for Transsion smartphones rose by 14% YoY for two years in a row. The MEA region anchored the increase as a big expansion into the Middle East was the main factor. In a bid to replicate its success in Africa, Transsion has targeted the low end when entering new markets, but there is potential for the company to grow beyond the current level.

而马Transsion继续享受稳定的总值rgins of around 30% in Africa, the company does face a more competitive landscape in the rest of the world, with gross margins of 15%-20%. However, there is room for improvement as the company continues with its premiumization strategy. In a recent interview, Transsion VP Qi Zhang said the company would be launching a flipfoldablein September in another attempt to showcase its technical prowess in the premium segment.


Q3 Revenue Stays Resilient, But Profit Declines Sharply as Costs Balloon

December 13, 2022

Transsion Holdings has reported flat revenue growth for Q3 2022 at 12.9 billion RMB. However, net profit slumped 47.4% YoY due to macroeconomic headwinds, inventory destocking initiatives, competitive pressures, and higher R&D and market expenditure.

Transsion Group Quarterly Revenue and Net Profit Margin
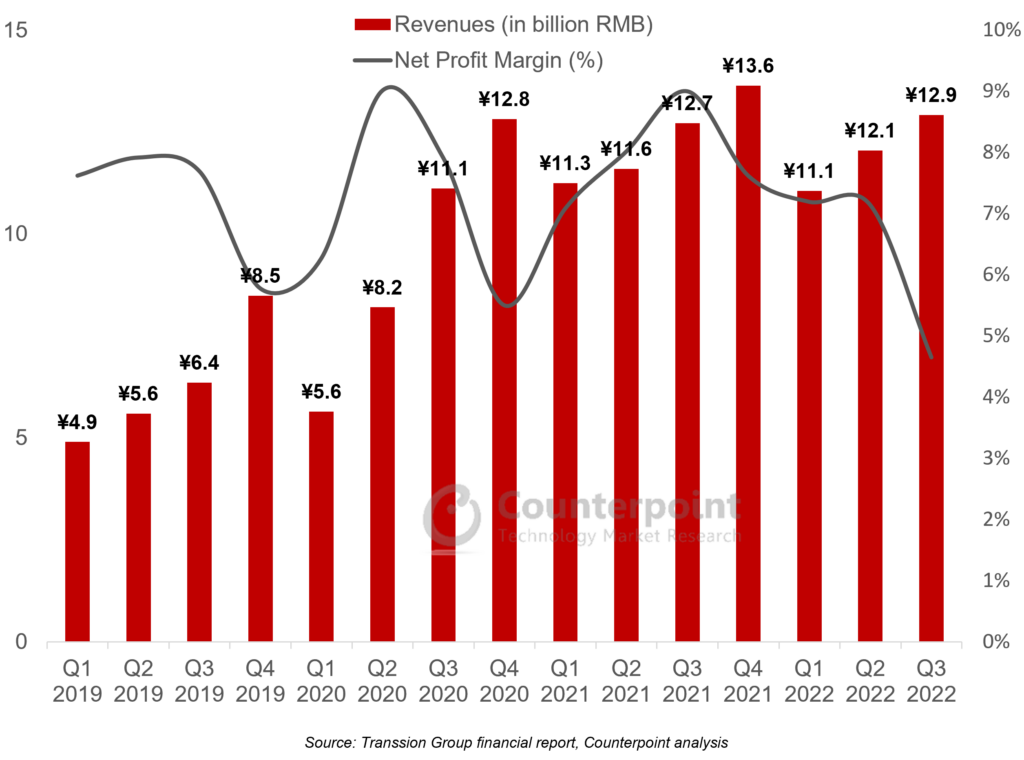
与再保险search - Transsion Group Quarterly Revenue and Net Profit Margin

Transsion’s Q3 smartphone shipments fell 18% YoY, as emerging market demand was hammered by macroeconomic concerns. Inflation rates ticked higher, continuing the pressure on lower-income consumers with high food and energy prices. Local currencies too continued to depreciate against the US dollar.

Despite the big drop in shipment numbers, Transsion’s revenues still achieved positive growth. This was due to a big increase in smartphone selling prices. TECNO and Infinix’s average selling prices (ASPs) rose 26% and 28% YoY respectively. Transsion was able to achieve this due to successful iterations of mainstream devices across TECNO and Infinix, while launching more sophisticated devices that have gathered popularity among aspiring switchers. On the other hand, bringing higher-value products to more mature markets in India and Southeast Asia meant higher contribution from higher-end products to the company’s revenue mix.

Transsion Group Financials Deep Dive – Sales, R&D and Inventory

与再保险search - Transsion Group Financials Deep Dive - Revenue & Inventory

与再保险search - Transsion Group Financials Deep Dive - Sales & R&D

Three items, in particular, caught our attention in Transsion’s Q3 report:

  • Inventory:Since the COVID-19 lockdowns, Transsion has moved decidedly away from the feature phone business and into the smartphone business. In parallel, inventory levels have also crept up, reaching an all-time high of 80% of quarterly revenues in Q2 2022, which caused discomfort for the management. In Q3, this level was brought down to a more manageable 57%, which put pressure on margins in the quarter but removed a significant uncertainty for future quarters, as the smartphone market is not expected to rebound until well into 2023.
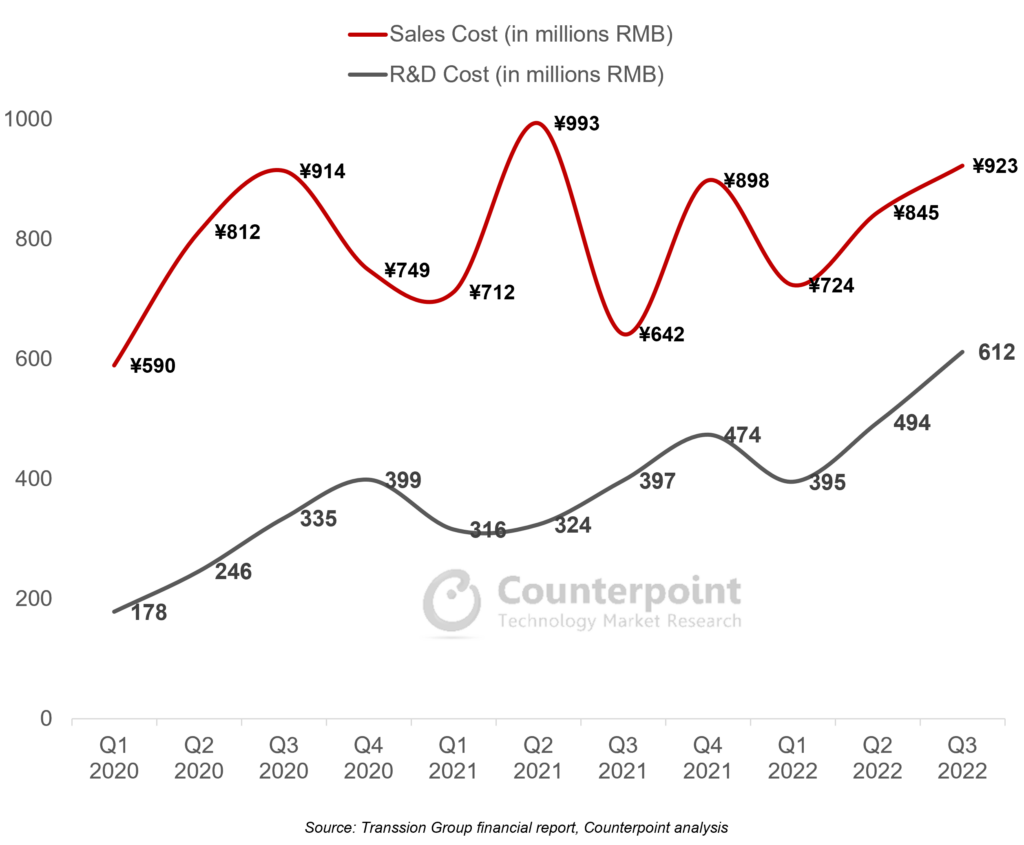
  • Sales cost:Other than the cost of goods sold, sales costs represent the biggest cost item in Transsion’s income statement. In a year when Transsion has reported slowing revenue growth, its sales costs have increased significantly as the company paves the way for an aggressive expansion into other regions. Transsion will be hoping the global smartphone market recovers quickly in 2023, but its investment case could come into doubt if smartphone shipments and market share do not pick up meaningfully in its key markets in the next few quarters.
  • R&D:Transsion花巨资研发,这是一个encouraging sign as the company aspires to move into higher-value smartphone segments and other smart device categories. We expect this trend to continue as the window of opportunity for entry-level devices narrows, considering device costs are expected to creep up, in line with the inflation rate.

Last quarter, we discussed Transsion’s stock options plan for 2022, which is linked to 2024 financial metrics. We expect the company to target 20-25% annual revenue growth rates for both 2023 and 2024. Much of this will depend on the company continuing to move up the smartphone value chain with 5G-capable devices, entry into IoT segments and monetization initiatives for its wide user base. Above all, the recovery of the global economy and smartphone market will be pivotal for Transsion as it gradually becomes more exposed to a wide range of different geographical locations.


Resilient Q2 Performance Driven by Pivot to Value, But Macroeconomic Challenges Remain

August 29, 2022

Transsion Holdings reported a 3.7% YoY increase in its Q2 2022 revenue to RMB 12.1 billion and a 4.5% YoY decline in net profit to RMB 1.04 billion. Considering the macroeconomic headwinds in Transsion’s core markets, the increase in revenue was a bright spot, especially compared with Q1 when the company posted a quarterly revenue drop for the first time since its market debut in September 2019.

Transsion Group Quarterly Revenue
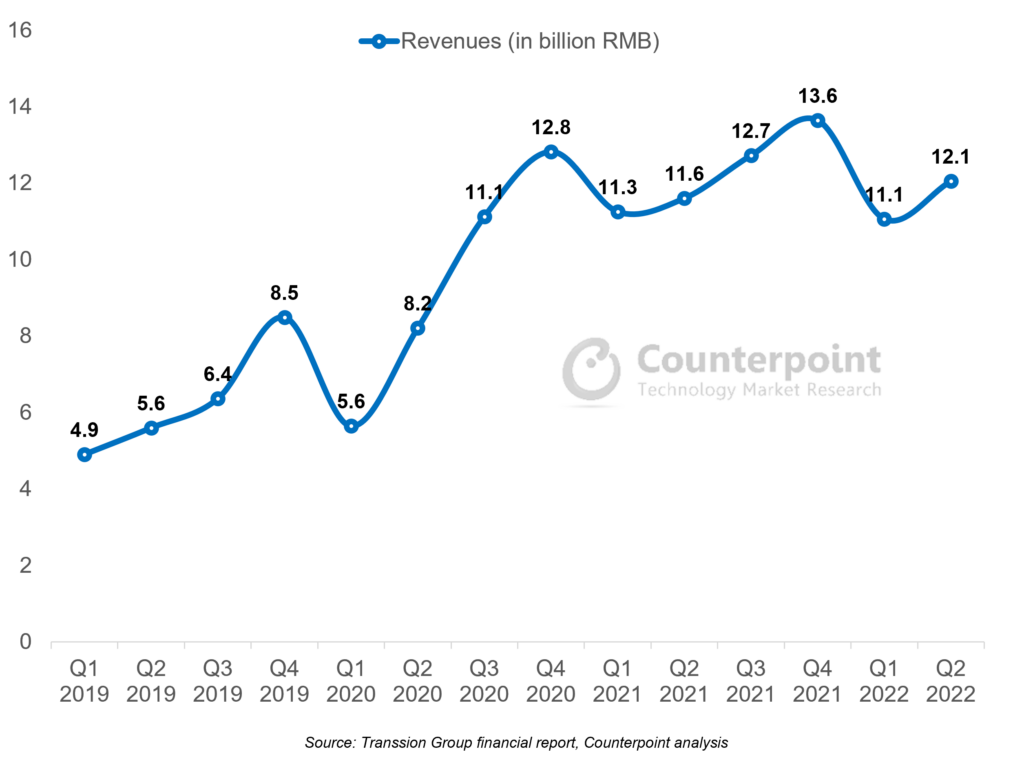
Transsion Group Quarterly Revenue

Transsion’s Q2 smartphone shipments grew 4.1% YoY, an impressive performance despite a shrinking global market, whichretreated 9%YoY during the quarter. Geopolitical tensions and high inflation rates have hurt the global smartphone market in general. Further, companies exposed to the low- to mid-end segments and emerging markets are more prone to secondary impacts, such as the strain on customers from high food and energy prices, weaker local currencies against the US dollar, and higher government taxes and levies on ‘non-essential’ imports like consumer electronics.

Transsion GroupQ2 2022 Smartphone Shipments Analysis – Growth and Regional Contribution
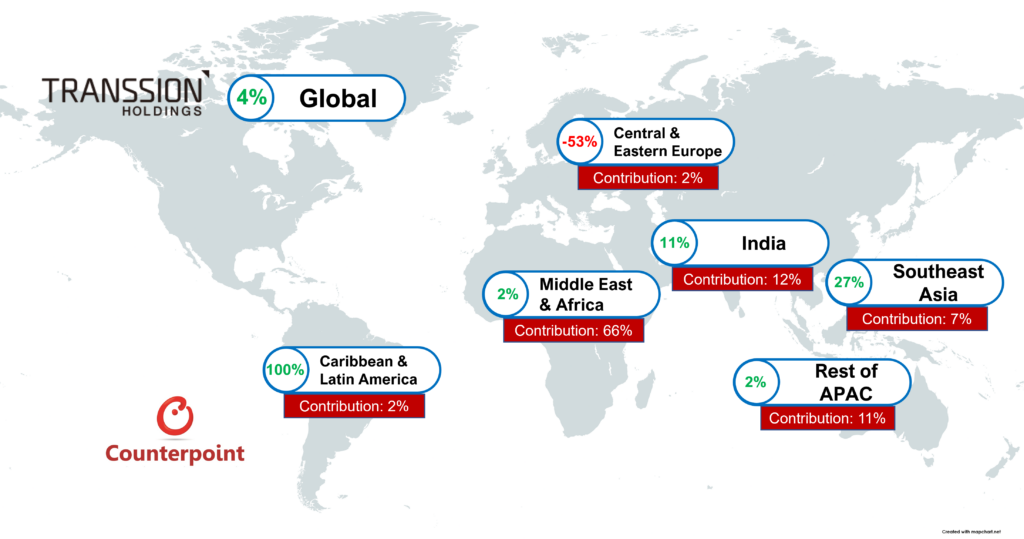
Transsion’s Q2 smartphone shipments grew 4.1% YoY, an impressive performance despite a shrinking global market, which retreated 9% YoY during the quarter. Geopolitical tensions and high inflation rates have hurt the global smartphone market in general. Further, companies exposed to the low- to mid-end segments and emerging markets are more prone to secondary impacts, such as the strain on customers from high food and energy prices, weaker local currencies against the US dollar, and higher government taxes and levies on ‘non-essential’ imports like consumer electronics. Transsion Group Q2 2022 Smartphone Shipments Analysis - Growth and Regional Contribution
Source: Counterpoint Market Monitor Service

Transsion defied these global trends through resilient performance in its Africa home market and strong growth in other regions, most noticeably in India and Southeast Asia. In both these regions, Transsion is ranked sixth in terms of shipments, helped by the company’s double-digit annual growth rate. Gaining a foothold in these new markets helps the company diversify its revenue sources and also allows the company to move up the pricing curve. According to Counterpoint’s Model Sales Service, Transsion’s smartphone average selling prices (ASP) increased 14% YoY, mainly driven by the success of the company’s TECNO and Infinix brands. The brands’ latest products received good market reception and are edging closer to the $150 mark.

Due to the increased pricing, Transsion’s Q2 normalized gross profit margin reached 22.9%, up 1.4% YoY, to reverse a six-quarter slump. However, the bottom line retreated, mainly due to a significant 40% increase in R&D spending. In our view, this is a positive sign that the company is moving out of its comfort zone of focusing only on pricing competitiveness in its African home market and committing to make more sophisticated products for the higher value markets.

尽管我们积极的评论,我们也认识到the significant challenges brought on by the macro environment, which is not likely to ease in the near term. In Q2 2022, we observed inventory challenges across handset and component makers, including Transsion. The company’s inventories reached RMB 9.6 billion as at the end of Q2, 27% higher than that in Q4 2021 and 73% more than in Q4 2020. Currently, inventory levels are 19% of the company’s 12-month trailing revenue, which could become an issue if it remains high or if revenue declines in the coming months.

We also note that the company’s recently announced stock options plan for 2022 is linked to its targeted 2024 financial metrics. The plan suggests that the company forecasts revenue and net profit to increase 15% and 32.25% respectively as a baseline case, or 20% and 44% respectively as a bull case by 2024. The targets are compared with the metrics from 2021, which was a strong financial year for Transsion, indicating that the company is extremely bullish about the next couple of years.


Growth Worries in Africa, India See First Revenue Drop Since COVID-19, But Diversification Efforts on Track

June 6, 2022

Transsion Holdings reported Q1 2022 earnings that saw revenues and net profit drop 1.8% and 7.6% YoY respectively. This is Transsion’s first revenue and profit drop since it went public in September 2019. The company’s performance during the quarter was impacted mainly by the stalled growth in its home market Africa and in India, which saw inflationary pressures hitting lower-income consumers significantly. Smartphone sales were down in the region for the first time since the pandemic. However, the company was cushioned by growth in other regions, and margins remained intact despite inventory build-up.

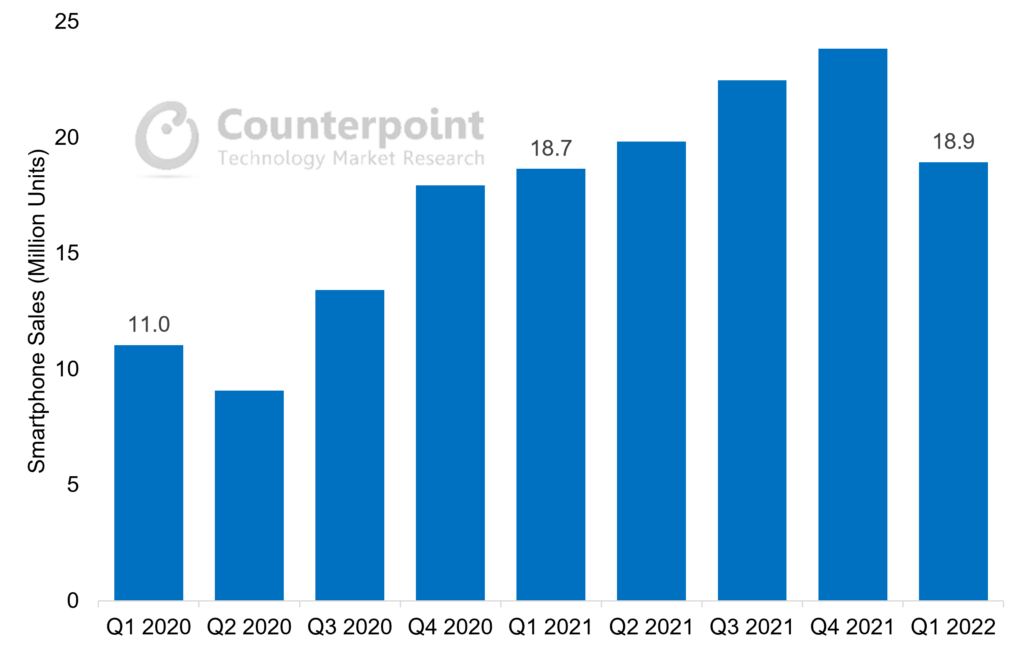
According to Counterpoint Research’sMarket Pulseservice, cumulative Transsion smartphone shipments reached 18.9 million units in Q1 2022. This was a small increase of 1.6%, the slowest YoY growth rate since the pandemic.

Transsion Group Quarterly Smartphone Sales
与再保险search - Transsion Group Quarterly Smartphone Sales
Source: Counterpoint Market Pulse Service

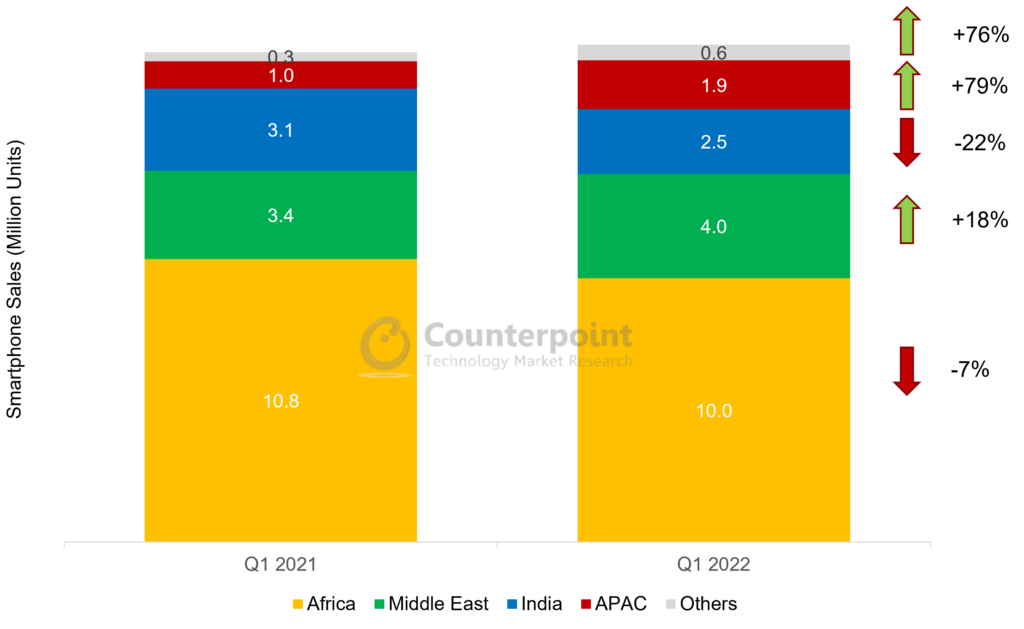
Looking further under the hood, there are significant regional disparities, however. In Africa, Transsion saw a 7% decline in smartphone sales in Q1 2022, mainly due to the inflationary impact on consumer sentiment. Most large African markets were already running double-digit inflation during 2021, but the Ukraine war had far-reaching consequences as food imports were hampered, affecting lower-income consumers more. Depreciating local currencies also put pressure on the company’s supply chain and margins.

In India, similar macro concerns and impact of the Omicron wave saw the smartphone market record the first Q1 drop ever. Here, Transsion smartphone sales dropped 22%. The market sentiment in India is expected to remain weak in Q2, but sales are likely to see growth due to the low base of Q2 2021 when the market was hit hard by the Delta wave.

另一方面,Transsion弹性执行ances in the Middle East and APAC, which show its diversification efforts are working. In both regions, the company is finding success in penetrating the entry-level segment in key countries like Pakistan and Bangladesh. Transsion’s 79% sales increase in APAC runs counter to the broader market. In the Middle East, the 18% sales increase is likely to extend further in 2022, as the region is expected to be the best-performing smartphone market due to the economic growth driven by oil revenue increases, mainly in Gulf Cooperation Council (GCC) countries.

Transsion Group Smartphone Sales by Region, Q1 2022 vs Q1 2021 (In million units)
与再保险search - Transsion Group Smartphone Sales by Region, Q1 2022 vs Q1 2021 (In million units)
Source: Counterpoint Market Pulse Service

Transsion’s normalized gross profit margins for Q1 2022 decreased to 21.4%, or 2% less than the same period in the previous year. Significant cost pressures persisted due to lingering supply chain disruptions, component shortages and high inventory levels. Rising revenues from other regions are also likely to cap the company’s margins, as it enjoys far higher margins in its home market Africa. However, Transsion now derives 87% of its revenues from the smartphone business, and as feature phone-to-smartphone migration continues for its emerging market customers, we see further room for the company’s revenues and margins to grow.


Transsion signs off 2021 in style: Smartphone market share continues to increase in emerging markets

April 28, 2022

Transsion Holdings reported 2021 results with revenues up 31.8% YoY and net profit up 45.5% YoY. These results were driven mainly by increasing smartphone sales and market share, which widened in the core African market, while achieving breakthroughs in key South Asian countries like Pakistan, Bangladesh and India. IoT and internet services, which accounted for 6.5% of the group’s revenues in 2021, also saw robust triple-digit growth.

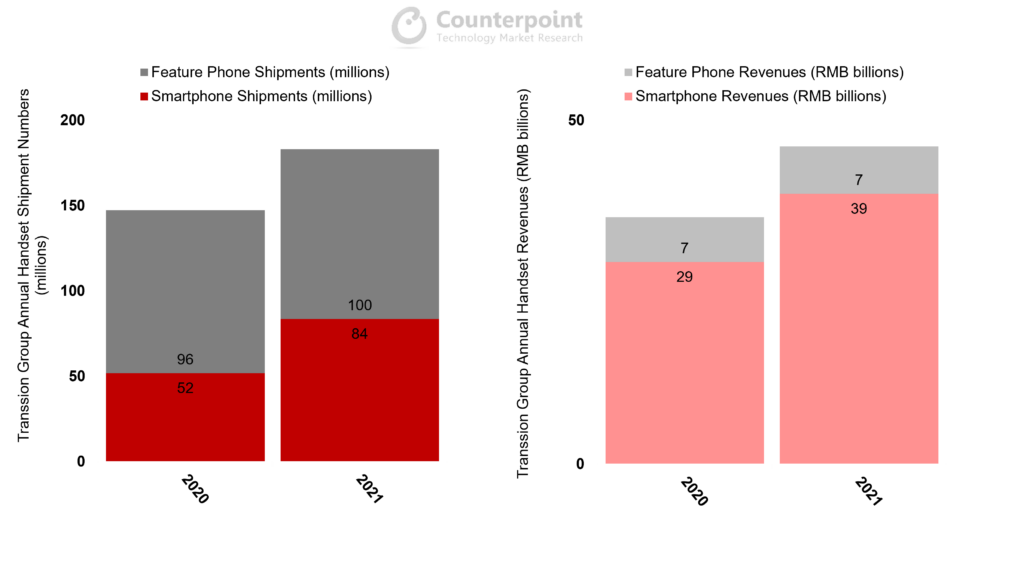
According to Counterpoint Research’sMarket Monitorservice, cumulative Transsion handset shipments reached 184 million units in 2021, an all-time high. Smartphones, in particular, grew 61%.

Transsion Group Handset Shipment and Revenue Analysis
与再保险search - Transsion Group Handset Shipment and Revenue Analysis

Sources: Counterpoint Market Monitor Service, Transsion Group financial statements

Transsion continued to do well in its home market Africa, where it already dominates with close to 45% share across its three brands. However, Africa accounted for only half of the shipment increases in 2021. In India, Transsion almost doubled its smartphone sales in one year, while the company is already the biggest smartphone OEM in Pakistan. As such, Transsion smartphone sales attributed to Africa decreased from 67% in 2020 to 56% in 2021. A widening geographical footprint, accompanied by an enriched portfolio, can help the company diversify its customer base and increase its technical prowess.

The company also reported surprisingly good revenue growth from other businesses. Revenues not attributed to handsets, which mainly include IoT and internet services, grew 68% YoY to RMB 3.2 billion. Their contribution to group revenues now stands at 6.5%. This is due to new products in the wearables, TWS, notebook and TV categories. But more importantly, Transsion’s ‘Matrix of Internet Products’ became meaningful growth engines. Apps under the Transsion umbrella saw installations increase 240% YoY, with three apps – Phoenix, Boomplay and Scooper (with MAUs of 100 million, 68 million and 27 million respectively) – becoming main gateways to the internet for African users. User and eventually revenue growth from apps will become ever more important factors in Transsion’s future strategy, particularly in Africa, as its handset business will inevitably hit road bumps in the future.

Transsion IoT & Internet Services Analysis
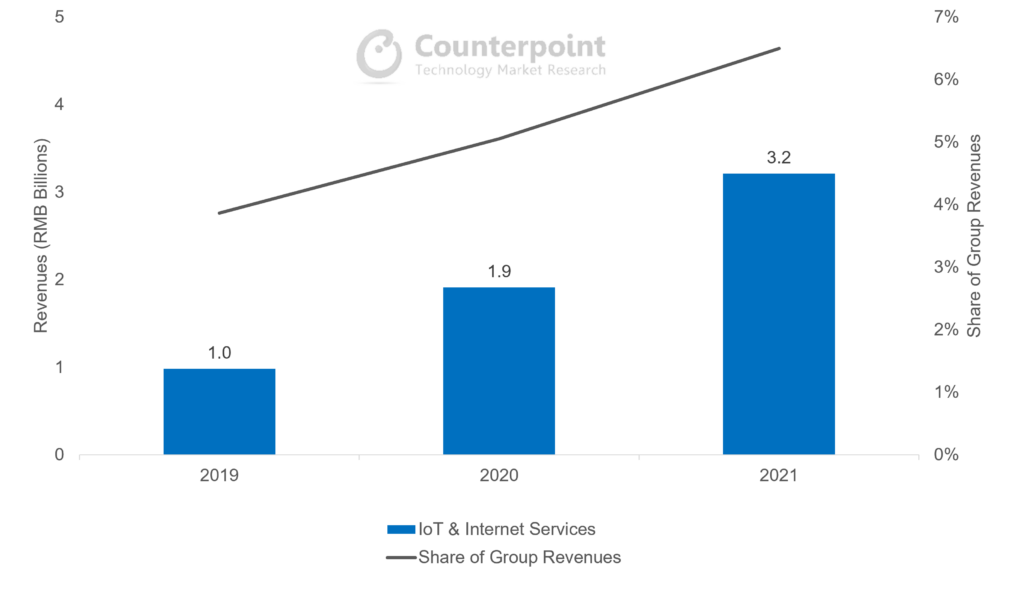
与再保险search - Transsion IoT & Internet Services Analysis

Source: Transsion Group Financial Statements

Transsion’s normalized gross profit margins decreased to 21.3% for the year, after staying above 23% for the first three quarters of 2021. There were significant cost pressures in the second half of the year, especially due to supply chain disruptions and component shortages. We expect these issues to gradually ease in 2022 as the supply and demand dynamics in the semiconductor industry improve, and supply chains become more resilient to shocks. However, foreign exchange fluctuations and inflationary pressures in key markets will be the new destabilizing factors for the company, as risks shift from the supply to the demand side in the wider global handset market.


Transsion handset sales, profit continue to improve despite cost pressures

November 24, 2021

Transsion Holdings reported Q3 2021 results with revenues up 16% YoY and net profit up 33% YoY. These positive results were driven once again by further pivoting to smartphone sales, especially in the core African market. According to Counterpoint Research’sMarket Monitorservice, cumulative Transsion smartphone shipments surpassed 20 million units for the first time ever, coming in at 23 million. This represents a growth rate of 75% YoY.

Transsion Group Handset Shipment and Revenue Analysis
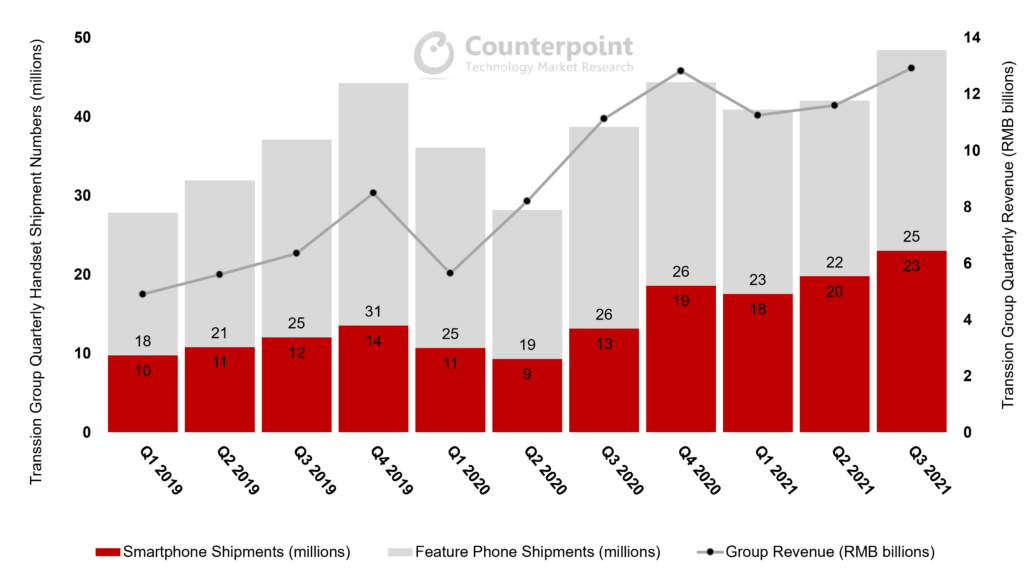
与再保险search - Transsion Group Handset Shipment and Revenue Analysis
Sources: Counterpoint Market Monitor Service, Transsion Group financial statements

While feature phone shipment growth moderated in Q3 2021, the bulk of Transsion’s revenue growth was driven by smartphones. Heading into the Q4 holiday shopping season and 2022, we may see Transsion’s smartphone shipments overtake feature phones for the first time.

Over the past couple of years, as Transsion smartphones penetrated more markets, the average selling price (ASP) saw a noticeable increase. While the ASP showed a mixed trend in the second half of 2019, it increased decisively during 2020 and is showing no signs of slowing down in 2021. Looking at Transsion’s brands closely, TECNO, itel and Infinix saw ASP increases of 56%, 43% and 29% respectively over the past 18 months. These point to positive consumer sentiment and changing perception of digital and mobile services. More consumers in emerging markets now recognize that a decent smartphone is an important component of their daily lives.

Transsion Group Smartphone Average Selling Price ($)
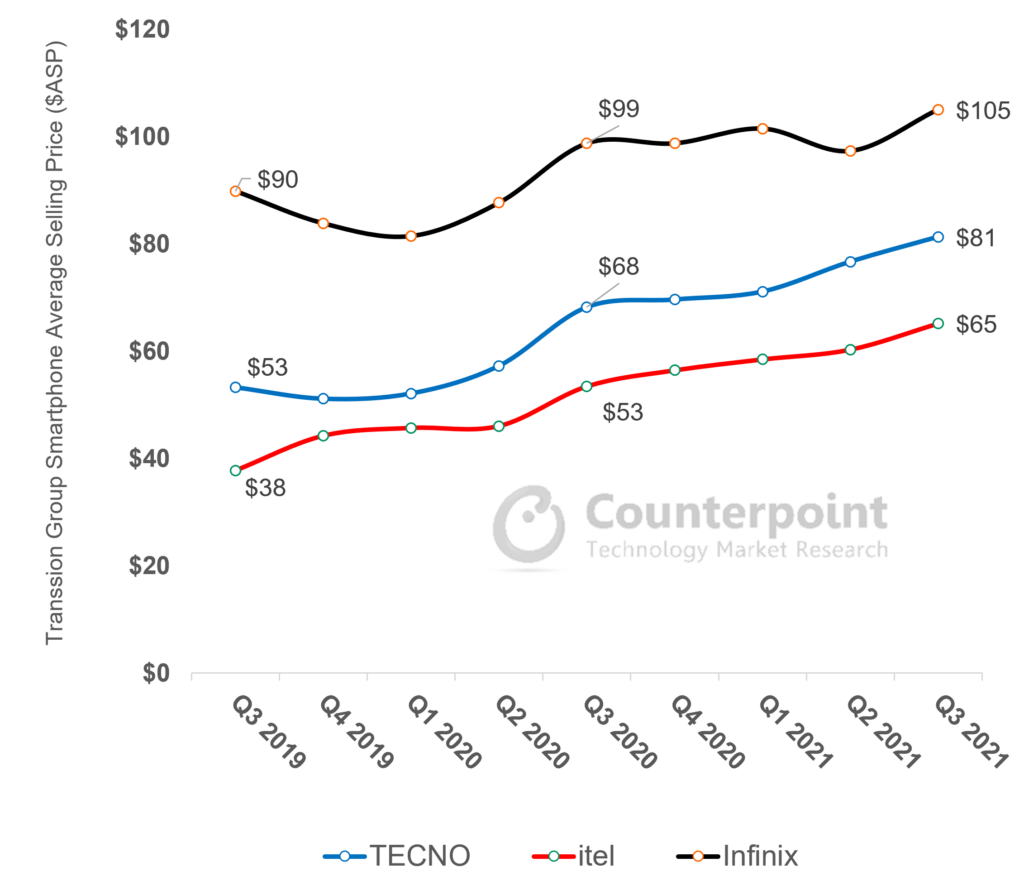
与再保险search - Transsion Group Smartphone Average Selling Price ($)
Source: Counterpoint Handset Model Sales Service

Transsion’s normalized gross profit margins increased to 25.3% in Q3, compared to 25% in Q2 and 23% in Q1. The company managed to navigate the ongoing component shortages well and was able to pass upstream cost increases to consumers. Selling, General & Administrative (SG&A) expenses and financing costs dropped as well. Furthermore, ventures outside sub-Saharan Africa, including in higher value markets in Southeast Asia and the Middle East, contributed to higher profit margins. Profitability may increase further as the supply chain situation stabilizes in 2022.


Smartphone Sales and Profitability Double Boost as Company Diversification Efforts Gather Pace

September 30, 2021

Transsion Holdings continued to see strong performance in H1 2021 with revenues and net income growing 65% and 59% YoY respectively, driven primarily by surging handset sales in its home market Africa, as well as successful ventures in other developing countries. According to Counterpoint Research’sMarket Monitor service, cumulative Transsion smartphone shipments in H1 2021 reached a record high of 37.3 million, taking the company’s share in the global smartphone market to 5.5% from 3.5% a year ago.
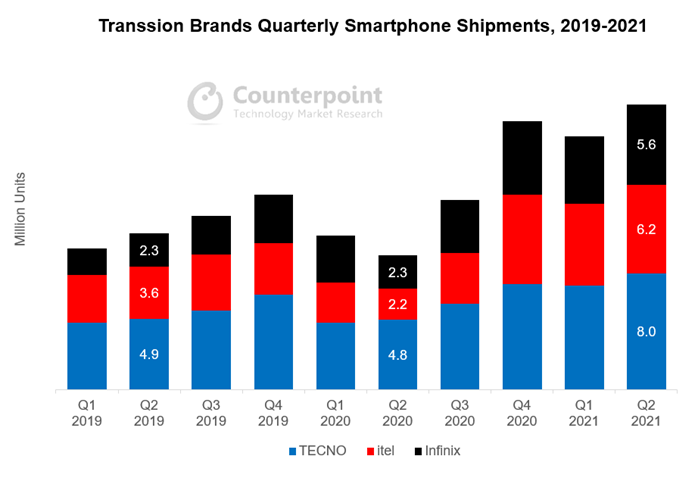
Transsion Brands Quarterly Smartphone Shipments, 2019-2021
与再保险search – Market Monitor Service

Looking at Transsion’s overall product strategy, we can see that it is shifting materially from feature phones to smartphones in response to market changes. In 2019, 33% of the company’s handsets were smartphones, but in the latest quarter this number has gone up to 47%. In the company’s latest earnings release, smartphones account for over 80% of its revenues, a record high.
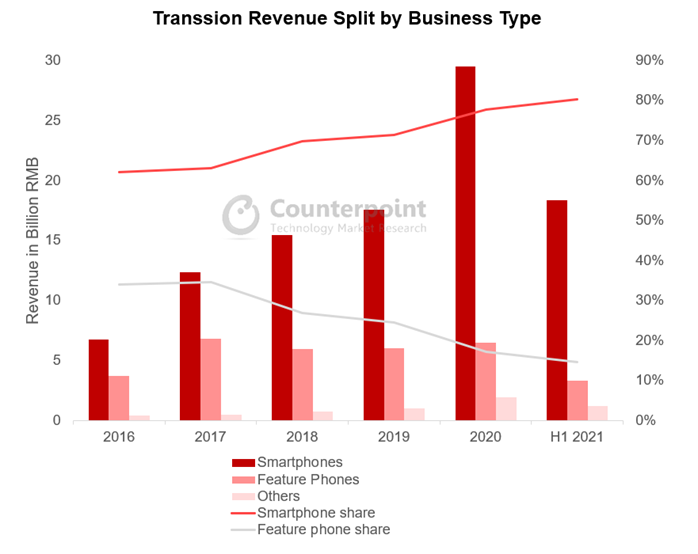
Transsion Revenue Split by Business Type
Transsion financial report, Counterpoint Research analysis

Commenting on Transsion’s commitment to smartphones,Senior Analyst Yang Wangsaid, “Transsion is rapidly transforming and upgrading its product portfolio. The move is driven by the accelerating demand for internet-capable phones in itshome market Africa, where the COVID-19 pandemic showed the value of the internet to consumers who were forced to stay at home. The region’s internet and mobile money services are also gathering steam along with a significant drop in data costs. While all OEMs stand to benefit from the consumer’s shift, Transsion gains the most as its distribution and pricing strategies are most ready to tap into new consumer clusters, which previously did not consider buying a smartphone.”
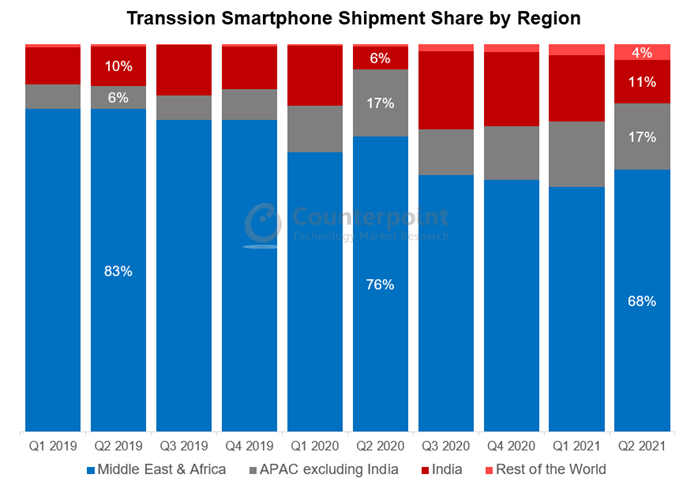
Transsion Smartphone Shipment Share by Region
与再保险search – Market Monitor Service

Apart from product transformation, the other significant shift in the Transsion strategy is geographical diversification. Compared to two years ago, Transsion’s share of smartphone shipments in the Middle East and Africa (MEA) region has dropped from 83% to 68%. On the other hand, shipments have increased rapidly in APAC countries such as India, Pakistan, Bangladesh, Indonesia and Thailand.Indiaspecifically has been the growth engine for Transsion, with shipments almost reaching 20% of the company’s global total in H2 2020, before the Delta wave halted the progress.

Commenting on Transsion’s moves in India,SeniorAnalyst Prachir Singh说,“Transsion品牌,尤其是TECNO,en focusing on a hybrid channel strategy in India, with an increased emphasis on online channels. This was executed with great success as Transsion brands contributed to 7% of the online smartphone market in India in Q2 2021, compared to 2% in Q2 2020. TECNO’s online smartphone shipments grew almost 20x YoY in Q2 2021, while itel increased its online share by launching online exclusive models like the Vision 1 Pro and A47. From a product positioning point of view, Transsion brands have been focusing on providing specs like higher display size, multi-camera capability and bigger battery, which are the top spec preferences for consumers in the sub-$150 segment.”

Going forward, Transsion’s fundamentals are expected to remain solid, as it continues to hold enormous clout in its Africa home market. Smartphone penetration will gradually expand, with new users continuing to be brought into the internet world. On the other hand, Chinese brands such as Xiaomi, OPPO and vivo are strengthening their market penetration efforts in certain African markets to address the medium-range segment (<$200). This price band is above Transsion’s typical playing field, so the newcomers are unlikely to affect its market share in the short term. However, we have seen in recent years Transsion’s effort to produce more premium phones and enter the <$200 price band. Therefore, there may be a time in the future when Transsion competes directly with the likes of Xiaomi, OPPO and vivo.

Related Posts

Navigating Permanent Roaming for IoT: Challenges and Solutions

  • The growing IoT ecosystem has brought forth its own set of challenges. One such challenge is permanent roaming.
  • While many countries allow permanent roaming without significant constraints, some big countries have implemented limitations on this practice.
  • There are multiple ways to circumvent the problem of permanent roaming. These includeeSIM, Multi-IMSI, aggregator platforms, and dynamic network selection algorithms.

The Internet of Things (IoT) has revolutionized the way we interact with the world around us. From smart homes to industrial automation,IoTdevices are playing a pivotal role in enhancing efficiency and convenience. However, the growing IoT ecosystem has brought forth its own set of challenges. One such challenge is permanent roaming, a phenomenon that has gained significance due to the global nature ofIoTdeployments. In this blog, we will delve into the concept of permanent roaming for IoT, discuss the challenges it poses, and explore potential solutions.

Understanding permanent roaming for IoT

Permanent roaming in the context of IoT refers to the practice of utilizingcellularconnectivity across different geographical locations on a consistent basis. Unlike traditional mobile phones, which might roam temporarily when users travel, IoT devices often need to maintain connectivity across various regions for extended periods. This is a fundamental requirement for IoT devices used in logistics, remote monitoring,agricultureand other activities.

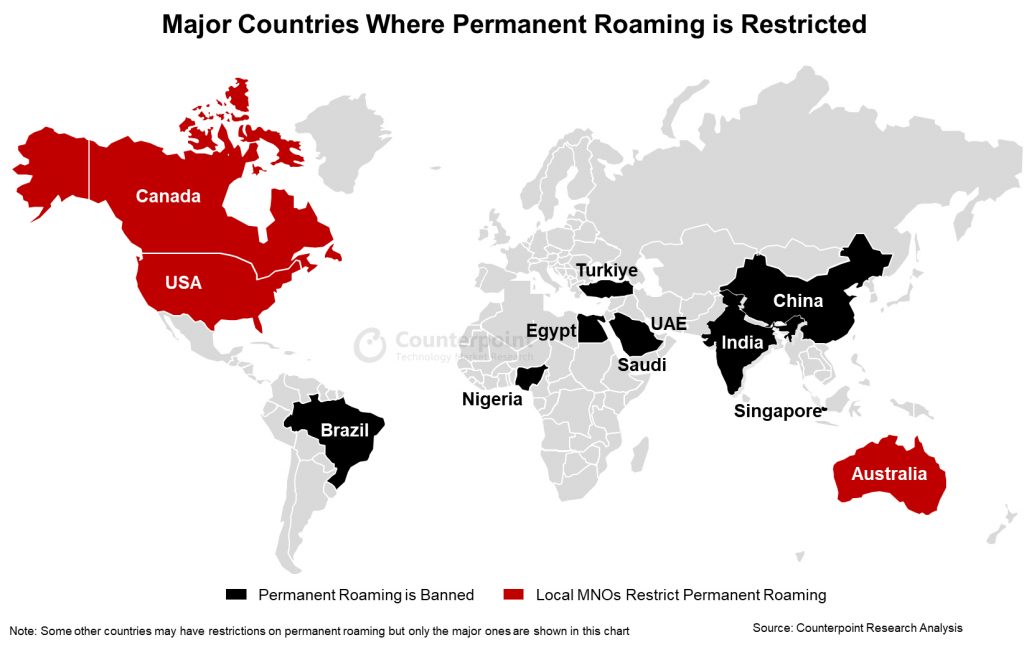
While many countries allow permanent roaming without significant constraints, some big countries have implemented limitations on this practice. The map below shows countries where permanent roaming is banned and those where local carriers have imposed restrictions.Major countries where permanent roaming is restricted

Countries that prohibit permanent roaming includeIndia, China, Brazil, Saudi Arabia, Egypt, Nigeria, Turkiye (formerly Turkey), UAE and Singapore. Besides, mobile operators in the US, Canada and Australia have imposed restrictions on permanent roaming within theirnetworks, effectively imposing a ban on this practice in these countries. Remarkably, these 12 countries collectively cover more than 50% of the world’s population and account for well over three-quarters of the IoT market.

Challenges posed byrestrictions onpermanent roaming

IoT devices are typically deployed on a global scale, leading to a complex scenario where these devices are connected to multiple mobile network operators (MNOs) across different countries. Imagine an electric car company that markets its vehicles across various regions. In countries where permanent roaming is not allowed, the company must procure local connectivity. This situation presents a host of challenges that ripple through the operational landscape:

  • Complex network management:Handling connections to multiple networks becomes really complex. Each network might have different prices, coverage areas and technical needs. The process of harmonizing such distinct facets is likely to be intricate and time-consuming.
  • Dealing with many partners:The company needs to work with different network partners. This means making deals, managing money and ensuring good service quality across networks. Besides, multiple networks means multiple bills and contracts. All of these tasks together can become very complicated and hard to manage as this activity is not core to the business.
  • Higher costs:Because of the rules against permanent roaming, the company has to pay more money to set up connections in each country. This extra cost can make things difficult and might affect how much the company can grow.
  • Less flexibility:Without the ability to use permanent roaming, the devices might not work as well when they move between countries. This can be a problem for customers who expect a consistent experience.
  • More planning needed:Since the company can’t rely on the same connection everywhere, it needs to plan ahead. This can slow things down and make expansion harder. There could be issues related to data sovereignty and compliance that may require additional planning.

Solutionsforpermanent roaming

There are multiple ways to circumvent the problems associated with permanent roaming. However, it is critical to select a managed service provider that has tie-ups with local MNOs/MVNOs. Alternatively, direct MNO relationships can be managed using aggregator connectivity management platforms.

eSIM (embedded SIM):eSIMtechnology is a game changer in the IoT landscape. It enables devices to have programmable SIM cards that can be remotely provisioned over the air. With eSIM, IoT devices can switch between different MNOs without requiring a physical SIM card replacement, thus simplifying the management of connectivity. UsingeSIM, it is possible to switch between a local profile and multiple roaming profiles every 90 days to avoid permanent roaming. Many managed service providers have this workaround to avoid permanent roaming. The new IoT eSIM specifications will further simplify the provisioning and orchestration of connectivity.

Multi-IMSI (International Mobile Subscriber Identity):Multi-IMSI solutions allow a single physical SIM card to have multiple IMSIs from different MNOs. This enables the device to seamlessly switch between networks while maintaining a single SIM card. By intelligently selecting the optimal IMSI based on factors like network quality and cost, Multi-IMSI solutions optimize connectivity and reduce operational complexities. However, the managed service provider needs to have a local presence or tie-ups.

Aggregator platforms:Aggregator connectivity management platforms (CMPs) act as intermediaries between IoT device owners and various MNOs. These platforms offer a unified interface for managing connectivity, provisioning,billing, and reporting across multiple networks. By consolidating these tasks, aggregator platforms simplify the management of permanent roaming for IoT devices. A new set of aggregator CMPs like IOTM and ConnectedYou is targeting enterprises instead of carriers to solve the problem of managing multiple networks.

Some of the aggregator platforms offer Dynamic Network Selection Algorithms. Smart algorithms can be implemented in IoT devices to dynamically select the most suitable network based on parameters such as signal strength, latency and cost.

Conclusion

With the IoT landscape continuing to expand globally, the challenges associated with permanent roaming are becoming more pronounced. However, with the advent of innovative solutions such aseSIM, Multi-IMSI, aggregator platforms, and dynamic network selection algorithms, these challenges can be effectively mitigated. These solutions not only simplify the management of connectivity but also enhance cost-effectiveness and operational efficiency for IoT deployments. The key is to find the right managed services partner, which has a platform that enables easy management of connectivity.

Related Posts

India Mobile Phone Cumulative Production Crosses 2 Billion Units Under ‘Make in India’ Initiative

  • India’s mobile phone production grew at a CAGR of 23% during 2014-2022 to cross a cumulative 2bn units.
  • The huge internal demand, increasing digital literacy and government push are the major reasons for this growth.
  • India is now the second-biggest mobile phone-producing country.

New Delhi, Hong Kong, Seoul, London, Beijing, San Diego, Buenos Aires – August 14, 2023

‘Made in India’mobile phone shipmentscrossed the 2-billion cumulative units markunder the ‘Make in India’ initiativeduring 2014-2022, registering a 23% CAGR, according to the latest research from Counterpoint’sMade in Indiaservice. The huge internal demand, increasing digital literacy and government push are the major reasons for this growth. As a result, India has become the second-biggest mobile phone-producing country. The Indian government has introduced schemes and initiatives such as the Phased Manufacturing Program (PMP), Make inIndia, Production Linked Incentive (PLI) and Atma-Nirbhar Bharat (Self-Reliant India) to increase local manufacturing and value addition.

Research DirectorTarun Pathaksaid, “India has come a long way in mobile phone manufacturing. We have seen local manufacturing increase over the years to meet domestic demand. In 2022, more than 98% of shipments in the overall Indian market were ‘Made in India’, compared to just 19% when the current government took over in 2014. We have also seen increasing local value addition and supply chain development in the country. Local value addition in India currently stands at an average of more than 15%, compared to the low single digits eight years ago. Many companies are setting up units in the country for manufacturing mobile phones as well ascomponents, leading to growing investments, increasing jobs and overall ecosystem development. The government now intends to capitalize on its various schemes to make India a ‘semiconductor manufacturing and export hub’. Going forward, we may see increasing production, especially forsmartphones, as India gears to bridge the urban-rural digital divide and also become a mobile phone exporting powerhouse.”

‘Made in India’ Mobile Phones Shipment Share in Local Market, 2014-2022

india mobile phone production: ‘Made in India’ Mobile Phones Shipment Share in Local Market, 2014-2022
Source: Counterpoint’s ‘Made in India’ Research, 2022

On the Indian government initiatives,Senior Analyst Prachir Singhsaid, “TheIndiangovernment has launched and executed many schemes, which has resulted in a big jump in mobile phone manufacturing over the years. Under the ‘Make in India’ initiative, the government introduced the Phased Manufacturing Program and increased import duties on completely built units and some key components over the years to push local manufacturing and value addition. Under the Self-Reliant India scheme, the government introduced the Production Linked Incentive (PLI) scheme for 14 sectors, including mobile phone manufacturing. Due to all this, exports from India have increased. Going forward, the government is focused on making India asemiconductorhub. It has proposed a semiconductor PLI scheme and now is focusing more on infrastructure with a proposed investment of $1.4 trillion.”

Background

Counterpoint Technology Market Research is a global research firm specializing in products in the TMT (technology, media and telecom) industry. It services major technology and financial firms with a mix of monthly reports, customized projects and detailed analyses of the mobile and technology markets. Its key analysts are seasoned experts in the high-tech industry.

Analyst Contacts

Prachir Singh

Tarun Pathak

Follow Counterpoint Research

press(at)www.arena-ruc.com

Related insights

Meet Counterpoint at DeviceNext Summit 2023

与再保险search will be joiningDeviceNextSummit as Knowledge Partners. As part of this collaboration, our Senior AnalystAnshika Jain, will serve as the moderator for a panel discussion centered around “Manufacturing in India: Challenges and Opportunities” within the smart wearables and accessories ecosystem.

Topic:Manufacturing in India: Challenges and Opportunities

When:11th August, 2023

Where:Aerocity, New Delhi

About the Event:

DeviceNext Summit is an industry event that unites the home-grown brands, manufacturers, channel partners, and visionary investors hailing from the world of smart devices and accessories. With its unique focus on smart devices ecosystem, this summit serves as a powerful catalyst for fostering meaningful connections and partnerships within this booming industry.

This year’s DeviceNext Summit, centered around the theme “Unifying The Device World: Bringing Key Players Of Make In India Together,” committed to bridging gaps and driving growth within the B2B smart devices ecosystem. Creating an inclusive and all-encompassing platform that brings together the key stakeholders who have played a pivotal role in the phenomenal success of the “Make in India” initiative.

阅读更多关于DeviceNext峰会2023

Related Posts

India Gaming Conclave 2023 Ft. Ankit Malhotra

Our Senior AnalystAnkit Malhotrais joining the third edition of India Gaming Conclave. He will be moderating a panel discussion on the 12th July 2023. More details below:

Title:5G Ready India – The Future of Entertainment and Gaming Industry with Innovations in Smartphone’s & Devices
Date:Wednesday, July 12, 2023
Time:11:00 AM IST
Speakers:

Overview:

The gaming and esports industry in India is undergoing a massive transformation due to the mobile revolution – There has been over 20% growth in casual gaming because of Smartphone’s, Growth in Digital Infrastructure, Increased Adoption of Digital Payments, Incentive to Win Money in Transaction Based Games & a Young Population. In India about 5.6 billion mobile game applications were downloaded in 2019 which is globally the highest. According to latest reports by KPMG the total Indian Gaming Market is expected to grow 113% from INR 136 billion in 2022 to INR 290 billion in 2025. The online casual gaming segment is poised to see the fastest growth with revenues growing 182% from INR 60 billion in 2022 to INR 169 billion in 2025. Moreover, the number of online gaming users in India is poised to grow from 481 Mn in 2022 to over 657 Mn by 2025

Industry estimates indicate 3.5 billion users are available thru social channels and 2.5 billion are gamers. About 74% of the social universe is at gaming but the ad spends in India is less than 5% – India is on the growth trajectory on the supply side with Indian studios growing to produce better games, investor interest and better localization of gaming content.

Register here:https://in.explara.com/widget-new/3rd-india-gaming-conclave-2023

To get live updates you can watch this space or follow us on TwitterFollow @CounterPointTR

Related Posts

India’s Promising Semiconductor Manufacturing Trajectory

  • India’s semiconductor market is expected to reach $64 billion by 2026 with the ‘telecom stack’ and industrial applications accounting for two-thirds of the total.
  • India’s Central and State Governments are incentivizing more than 70% of the total cost in setting up a semiconductor manufacturing facility.
  • The Central Government funds 50% of the project and has also earmarked outlays for R&D, skill development and training.

New Delhi, Beijing, Jakarta, London, Boston, Toronto, Taipei, Seoul – May 09, 2023

Invest India, the National Investment Promotion and Facilitation Agency, India Semiconductor Mission (ISM), and Counterpoint Research, recently hosted a series of webinars with key industry speakers to discuss the opportunities in India for establishing a semiconductor manufacturing base and in becoming a key destination for supply chain diversification.

The webinar covered four central topics, namely thesemiconductormarket across sectors and applications; government programs and incentives for foreign manufacturers; talent availability and initiatives for re-skilling; and the current infrastructural capabilities and support for semiconductor manufacturing.

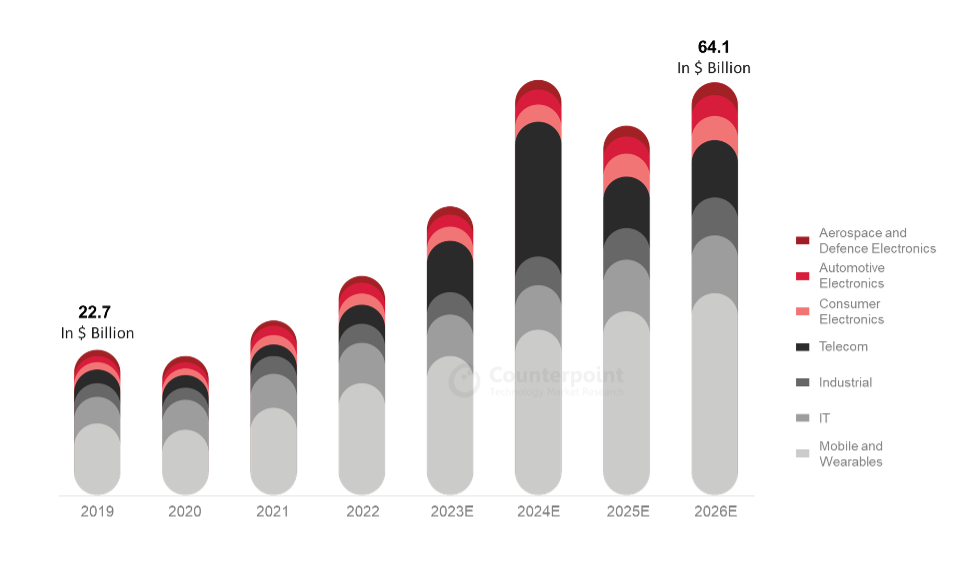
With India’ssemiconductormarket expected to balloon to $64 billion by 2026, the country presents a considerable opportunity for global semiconductor manufacturing. India’s semiconductor market was valued at $22.7 billion in 2019, according to a joint report by Counterpoint Research and the India Electronics & Semiconductor Association (IESA). The 2026 forecast is set to be driven by both domestic and export markets with significant demand from theconsumer electronics, telecom, IT hardware and industrial sectors. India’s ‘telecom stack’ and industrial applications are expected to account for two-thirds of the total.

印度半导体市场如果ze by Application

印度半导体市场如果ze by Application
Source: Counterpoint Research, IESA

Meanwhile, components leveraging mature technology nodes (28nm and higher) are expected to see significant short-term opportunities as they support India’s growingautomotiveand industrial sectors.

“In the short term, there is a huge opportunity being driven by domestic demand across applications like sensors, logic chips and analog devices,” said Tarun Pathak, Research Director at Counterpoint.

He also said “Local sourcing is already happening in a significant way. It accounted for around 10% of the overallmarketin 2022.”

At the global level, the Government of India has committed to being a reliable partner in thesemiconductorsupply chain, introducing various incentives and programs that facilitate foreign investments across a broad array of sectors.

Mr. Amitesh Kumar Sinha, CEO of ISM and Joint Secretary, Ministry of Electronics and Information Technology, said, “India is committed to becoming a reliable partner in global supply chains and we are working towards that by framing long-term policies, keeping the next 25 years in mind.”

Mr. Sinha further added, “More than 70% of the project costs forsemiconductormanufacturing are incentivized by the Central and State Governments in India of which 50% is funded by the Central Government on an upfront basis while the rest is covered by the State Governments.”

The Semicon India Program, which has an outlay of about $10 billion, funds 50% of thesemiconductormanufacturing project costs with 2.5% of the budget earmarked for R&D, skill development and training.

Apart from market sizing and fiscal support, the fourth area addressed during the webinar was the existing infrastructural capabilities and the availability of a skilled workforce, materials supply and other parts of the local supply chain.

India’s own fabrication unit, Semiconductor Laboratory (SCL), provided an end-to-end case study emphasizing India’s supply chain’s robustness across utilities, materials and talent.

Dr. Manish Hooda, Head of Technology Development at SCL said, “SCL has been an end-to-end manufacturer for 30 years, providing products for space and railway applications. For the last 15 years, SCL has received uninterrupted power supply and stable, continuous flow of ultra-pure quality water, which highlights India’s readiness to support high-volume manufacturing of semiconductors.”

An edited version of the webinar recording can be foundhere.

Contacts:

Nupur Yadav

nupur.yadav@www.arena-ruc.com

Rohan托马斯·亚伯拉罕– Sector Lead, ESDM – Invest India

esdm@investindia.org.in

Media Contacts

press@www.arena-ruc.com

Follow Counterpoint on LinkedIn and Twitter

About Counterpoint Research

Counterpoint Technology Market Research is a global research firm specializing in TMT. It services major technology and financial firms with data, monthly reports, and detailed analyses of key technology markets.

About Invest India

Invest India is the national investment promotion and facilitation agency of India. The agency’s team of domain and functional experts provide sector- and state-specific inputs, and hand-holding support to investors through the entire investment cycle, from pre-investment analysis and decision making to after care and grievance redressal. Additionally, all facilitation support to investors under the “Make in India” program is provided free of cost by Invest India.
Website:https://www.investindia.gov.in/

About India Semiconductor Mission (ISM)

India Semiconductor Mission (ISM) is a specialized and independent business division within the Government of India’s Digital India Corporation. The organization aims to build a vibrant semiconductor and display ecosystem in India to facilitate the country’s emergence as a global hub for electronics manufacturing and design. Led by global experts in the semiconductor and display ecosystem, ISM’s mission is to serve as a focal point for the comprehensive, coherent, efficient and smooth deployment of the Program for Development of Semiconductor and Display Ecosystem, in consultation with government ministries/departments/agencies, industry players and academia.
Website:https://ism.gov.in/

Related Posts

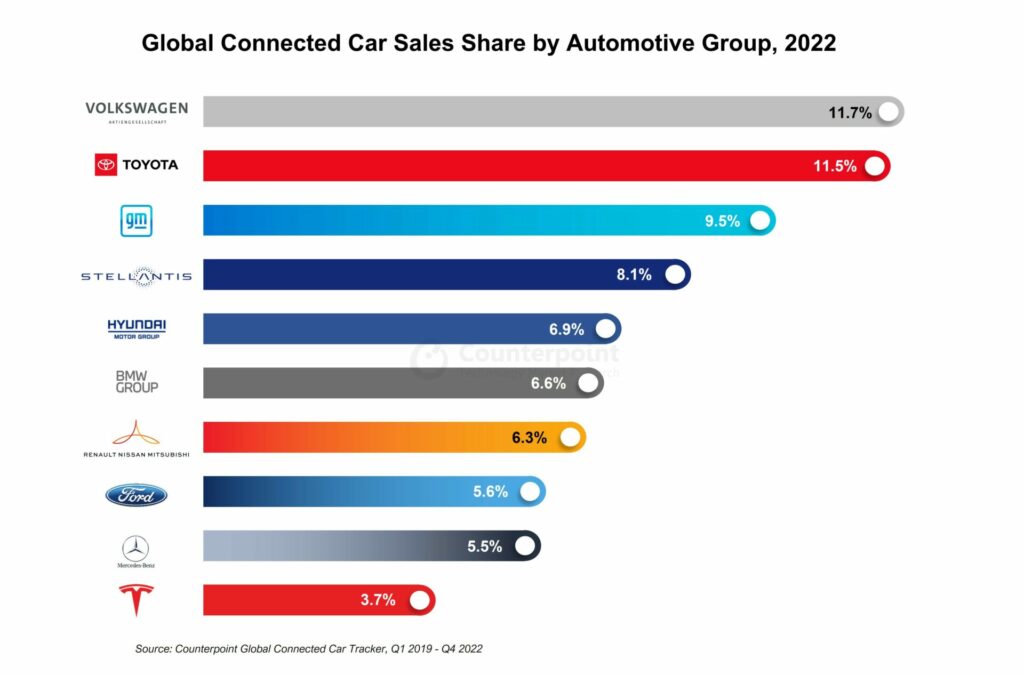
Connected Car Sales Grew 12% YoY in 2022 With Volkswagen Group in Lead

  • Volkswagen Group led in connected car sales, closely followed by Toyota Group.
  • 4G cars captured more than 95% of connected car sales in 2022.
  • Tesla broke into the top-10 connected car sales rankings for the first time.

New Delhi,London,San Diego, Buenos Aires, Hong Kong, Beijing, Seoul – April 24, 2023

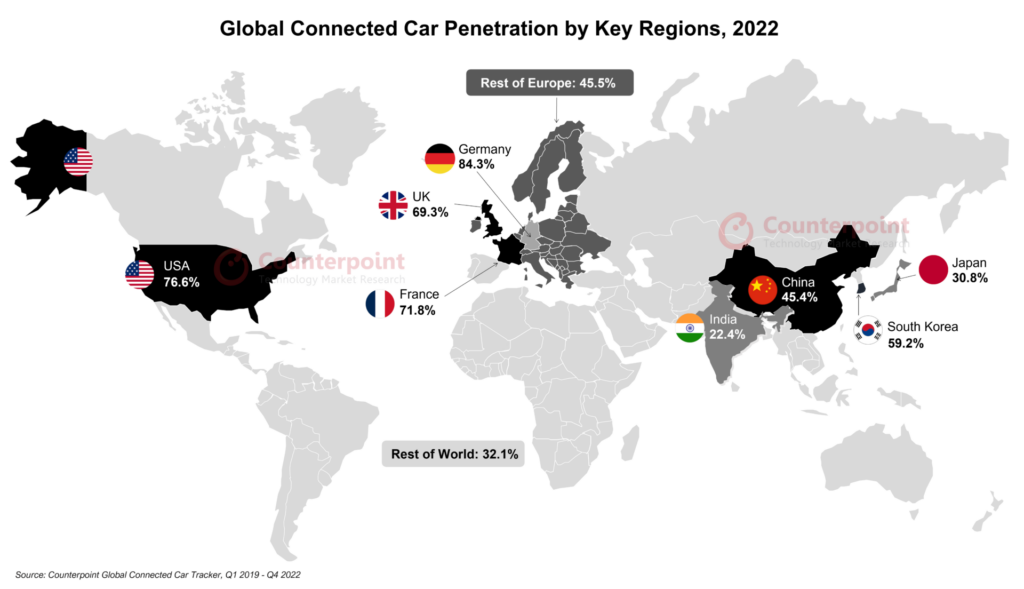
Global connected car sales* grew 12% YoY in 2022 with the share of connected cars in the overall car sales exceeding 50%, according to the latest research from Counterpoint’sSmart Automotive Service. TheUSremained the strongest market for connected cars followed by China andEurope. These three markets accounted for nearly 80% of the total connected car sales globally in 2022. Despite having a relatively small share of connected car sales, Japan experienced the highest growth in connected car penetration.

Commenting on the market dynamics,Research AnalystAbhilash Guptasaid, “The penetration of connectivity in cars improved during 2022 after struggling in 2020 and 2021. In 2022, new facelift versions of older models like the Honda Civic, Toyota Corolla, Ford Escape and Chevrolet Equinox were introduced with upgraded 4G connectivity and new features. Some prominent features include remote lock/unlock, remote engine start/stop, climate control, vehicle status, location tracking, geofencing, emergency assistance, in-cabin music, video streaming, and over-the-air updates. Next-generation vehicles are being introduced with various connected and autonomous features that require high-speed internet access available through 5G. However, as of now, 5G remains a niche, available only in premium cars like the Ford F-150 Lightning, Cadillac LYRIQ, Mercedes-Benz EQS, Audi e-tron GT, BMW iX and GWM Haval HG.”

CC Penetration by regions_2022_Counterpoint

Gupta added, “With consumers’ focus shifting to connectivity in the car, non-connected car shipments are steadily declining. The top five automotive groups accounted for nearly half of the connected cars sold in 2022. Volkswagen Group led the charts in terms of connected car sales volume, closely followed by Toyota Group. Tesla broke into the top 10 for the first time.”CC Sales Share by group_2022_Counterpoint

Commenting on the market outlook,Senior AnalystSoumen Mandalsaid, “The shift towards digitization in cars is increasing at a rapid pace and is visible in the consistent rise of connected car penetration globally. Currently, 4G dominates the connected car market with almost95%share. But as the automotive market is transitioning towards electrification, software-defined vehicles and autonomy, the need for seamless and faster in-vehicle connectivity will be fulfilled through 5G. By2030, more than 90% of connected cars sold will have embedded 5G connectivity. Connected car sales are expected to grow at a CAGR of 13% between 2022 and 2030.”

*Sales here refer to wholesale figures, i.e. deliveries out of factories by respective brands, and consider only passenger cars with embedded connectivity.

The comprehensive and in-depth ‘Global Connected Car Tracker,Q1 2019-Q4 2022’ and ‘Global Connected Car Forecast, 2019-2030F’ are now available for purchase atreport.www.arena-ruc.com.

Feel free to reach us at press@www.arena-ruc.com for questions regarding our latest research and insights.

Counterpoint automotive quarterly

Background

Counterpoint Technology Market Research is a global research firm specializing in products in the TMT (technology, media, and telecom) industry. It services major technology and financial firms with a mix of monthly reports, customized projects, and detailed analyses of the mobile and technology markets. Its key analysts are seasoned experts in the high-tech industry.

Analyst Contacts

Abhilash Gupta

Soumen Mandal

Peter Richardson

与再保险search

press@www.arena-ruc.com

Related posts

Webinar: Building Resilient Semiconductor Supply Chains

We are coming together withInvest Indiato hold a webinar on the Indian semiconductor industry.

Title:Building Resilient Semiconductor Supply Chains: The New India Opportunity

Timings:
Series 1:8th February, 2023 | 11:30 AM (IST)
Series 2: 16th February, 2023 | 9:30 PM (IST)

The webinar will feature presentations by senior government officials and industry experts on the opportunities in the semiconductor industry, ecosystem enablers, incentives and infrastructure in India. We look forward to your participation.

If you are a semiconductor or component manufacturer thinking about setting up a foundry in India, attending this should be high priority.

Book your seat by filling out the form below. Only limited seats available!

Please enable JavaScript in your browser to complete this form.

Here are some insights from our Make in India research and more:

India 5G Smartphone Shipments to Cross 4G Shipments in 2023

  • Cumulative 5G smartphone shipments will cross the 100-million mark in Q2 2023 and exceed 4G smartphone shipments by the end of 2023.
  • India’s 5G smartphone shipments are estimated to grow 81% YoY in 2022 driven by their expanding presence in lower price bands (
  • 5G share in lower price bands (

India’s smartphone shipmentsare projected to witness a yearly decline in 2022 due to macroeconomic factors affecting consumer demand in the entry and budget segments. However, 5G has been a driving force and will continue to push smartphone demand in 2023 as well. India’s 5G smartphone shipments are estimated to grow 81% YoY in 2022 driven by their expanding presence in lower price bands (

According to Counterpoint’sIndia Market Outlook, cumulative 5G smartphone shipments will cross the 100-million mark in Q2 2023 and exceed 4G smartphone shipments by the end of 2023. Our latest consumer study also reveals that 5G is the third most important factor for future smartphone purchases.

India 5G vs 4G Smartphone Shipment Penetration

Source: Counterpoint Research India Smartphone Outlook, November 2022

5G share in lower price bands (

Source: Counterpoint Research India Smartphone Outlook, November 2022

However, the growth here has been limited due to component supply shortages, inflation, geopolitical conflicts and other macroeconomic issues, which have delayed 5G device launches in the budget segment. Though OEMs have brought more 5G devices for lower price bands (

We expect these constraints to ease by the end of 2023, leading to the mass adoption of 5G. Better availability of networks in major areas will also facilitate 5G smartphone growth in 2023, which is estimated to be 62% YoY.

Glance Lock Screen Active Users in India Nears 200 Million

  • InMobi subsidiary Glance’s lock screen had over 195 million active users in Q3 CY 2022.
  • In Q3 2022, Glance lock screen was present in 44% of smartphones in India.
  • More than 80% of the Glance active users belong to the sub-$250 price segment.

Glance lock screen active user base crossed 195 million in Q3 of calendar year 2022 in India, according to Counterpoint Research’sQuarterly Mobile Application Tracker. The lock screen service from Glance offers personalized content to Android smartphone users. With its consistent efforts to promote engagement among its users, it experienced 20% YoY growth in Q3 2022 by adding 32 million active users to the user base in the past one year. In line with the overall India smartphone market trends, Glance lock screen holds a strong preference in the $150-$250 price band, and the users mainly belong to the top brands like Xiaomi, Samsung, vivo, realme and OPPO.

Glance Active User Base, Q1 2021-Q3 2022 (in million)

与再保险search_Glance Active User Base, Q1 2021-Q3 2022

Source: Counterpoint Research Quarterly Mobile Application Tracker, Q3 2022

Smartphones have become an inevitable part of people’s lives, resulting in a higher pace of content absorption and more competition in content generation. This is where Glance with its lock screen service grabbed the opportunity to bridge the gap between content production and content consumption by making the process of content discovery possible at the very first touch by the users on their Android smartphones. Glance, a subsidiary of InMobi, aims to reach smartphone users in the most seamless yet consumable form. Glance lock screen is one of the services through which Glance keeps its users updated with the latest and most relevant content using an AI mechanism. At the first touch on the smartphone lock screen, it serves the users with personalized content across different genres, like current affairs, entertainment, technology, sports, fashion, gaming and travel, with a choice of eight regional languages.

In Q3 2022, Glance lock screen was present in 44% of smartphones in India. Along with the standard lock screen service offerings, Glance’s consistent user engagement activities ensure user stickiness. It added more than 6 million active users in the third quarter of CY 2022 and more than 32 million in the 12-month period. The growing Indian smartphone market directly impacts the growth of Glance’s user base. Other factors that impact the growth include:

  • Glance maintains a close relationship with top OEMs like Xiaomi, Samsung, vivo, realme and OPPO. Xiaomi and Samsung are the key players contributing to the user base. However, it is the partnership with realme that has contributed to the growth since last year. OPPO too has been witnessing growth in Glance users lately.
  • More than 80% of its active users belong to the sub-$250 price segment, with the strongest presence in the $150-$250 segment. The popularity of this price segment in India’s smartphone market directly affects the growth of Glance’s user base.
  • Apart from regularly engaging with its users through live and latest content on its lock screen platform, Glance has launched Hyperlive, which provides a premium live experience where one can witness and participate in prominent events happening around the world.

Glance is working towards expanding its reach across device types, OEMs and other geographies. With the rising penetration of smart TVs in India, Glance is now working on redefining the experience of smart TV users through live and interactive engagements. Further, as Glance strengthens its roots in India, it is now expanding its geographical reach to other nations, starting with Indonesia. Glance has already partnered with top OEMs in Indonesia, like OPPO, vivo and Xiaomi. It will be soon launched in the US, while there are also plans to expand to Latin America.

Methodology

Glance’s mobile application presence is calculated from our panel database of over a million smartphone active users. Model-level Glance penetration data and active user ratios were extrapolated to our monthly smartphone installed base data using various parameters such as brand, model and price band to predict Glance’s active user base. We expect the results to have a statistical precision of +/- 5% at a confidence interval of 90%.

This is a sponsored survey to better understand the brand’s presence in the Indian smartphone market.

Disclaimer

Counterpoint Technology Market Research All Rights Reserved. Reproduction of this publication in any form without prior written permission is forbidden. The information contained herein has been obtained from sources believed to be reliable. However, we disclaim all warranties as to the accuracy and completeness of this report. Counterpoint shall have no liability for errors, omissions, or inadequacies in the information contained and any direct/indirect damages. All opinions and estimates herein are subject to change without notice.

Related Posts

Term of Use and Privacy Policy

Counterpoint Technology Market Research Limited

Registration

In order to access Counterpoint Technology Market Research Limited (Company or We hereafter) Web sites, you may be asked to complete a registration form. You are required to provide contact information which is used to enhance the user experience and determine whether you are a paid subscriber or not.
Personal Information When you register on we ask you for personal information. We use this information to provide you with the best advice and highest-quality service as well as with offers that we think are relevant to you. We may also contact you regarding a Web site problem or other customer service-related issues. We do not sell, share or rent personal information about you collected on Company Web sites.

如何退订和终止

You may request to terminate your account or unsubscribe to any email subscriptions or mailing lists at any time. In accessing and using this Website, User agrees to comply with all applicable laws and agrees not to take any action that would compromise the security or viability of this Website. The Company may terminate User’s access to this Website at any time for any reason. The terms hereunder regarding Accuracy of Information and Third Party Rights shall survive termination.

Website Content and Copyright

This Website is the property of Counterpoint and is protected by international copyright law and conventions. We grant users the right to access and use the Website, so long as such use is for internal information purposes, and User does not alter, copy, disseminate, redistribute or republish any content or feature of this Website. User acknowledges that access to and use of this Website is subject to these TERMS OF USE and any expanded access or use must be approved in writing by the Company.
– Passwords are for user’s individual use
– Passwords may not be shared with others
– Users may not store documents in shared folders.
——用户不得向非用户重新分配文件s unless otherwise stated in their contract terms.

Changes or Updates to the Website

The Company reserves the right to change, update or discontinue any aspect of this Website at any time without notice. Your continued use of the Website after any such change constitutes your agreement to these TERMS OF USE, as modified.
Accuracy of Information: While the information contained on this Website has been obtained from sources believed to be reliable, We disclaims all warranties as to the accuracy, completeness or adequacy of such information. User assumes sole responsibility for the use it makes of this Website to achieve his/her intended results.

Third Party Links: This Website may contain links to other third party websites, which are provided as additional resources for the convenience of Users. We do not endorse, sponsor or accept any responsibility for these third party websites, User agrees to direct any concerns relating to these third party websites to the relevant website administrator.

Cookies and Tracking

We may monitor how you use our Web sites. It is used solely for purposes of enabling us to provide you with a personalized Web site experience.
这些数据也可以用于聚合,identify appropriate product offerings and subscription plans.
Cookies may be set in order to identify you and determine your access privileges. Cookies are simply identifiers. You have the ability to delete cookie files from your hard disk drive.