<\/i>","library":"fa-solid"},"layout":"horizontal","toggle":"burger"}" data-widget_type="nav-menu.default">

Top

Tesla Reports Record Revenue, Deliveries in Q4 2022

  • Tesla’s total revenue stood at $24.3 billion in Q4 2022 with 37% YoY growth.
  • Tesla deployed 2.46 GWh of energy storage during Q4, a growth of almost 152% YoY.
  • Tesla’s vehicle deliveries are expected to exceed 1.7 million units globally in 2023.

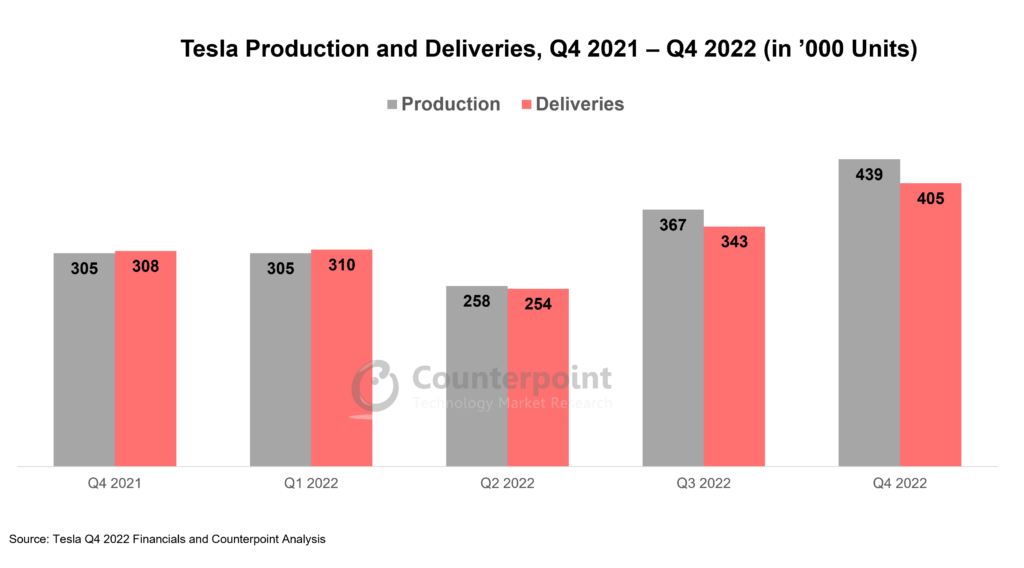
Riding on record 405,278 vehicle deliveries in Q4 2022, Tesla registered a record total revenue of $24.3 billion during the quarter, an increase of 37% YoY. Deliveries rose 31.3% YoY in Q4, bringing the 2022 annual total to1.3 million units.TheUS was the leading marketin Q4, followed by China and Europe. The annual deliveries of Tesla’s premium Model X and Model S grew 167% YoY to reach 66,000 units.

Tesla’s sales inChinafell short of expectations again due to the COVID-19 outbreak. Production at the Shanghai factory, which exported more than 106,000 units in Q4, was halted during the last week of December. Although no specific reason was stated officially, rising COVID-19 cases among workers were a likely cause for the unexpected production halt. On the other hand, the weekly Model Y production in the Berlin factory touched 3,000 units. The rising production in Germany has helped Tesla gain a strong grip onEurope’s EV market.The Model Y remained Europe’s top-selling car model during November and December. Tesla’s in-house 4680 cell production rate also reached 1,000 cars per week.
Tesla Revenue by segment Q4 2021 - Q4 2022 Counterpoint Research

Financial summary

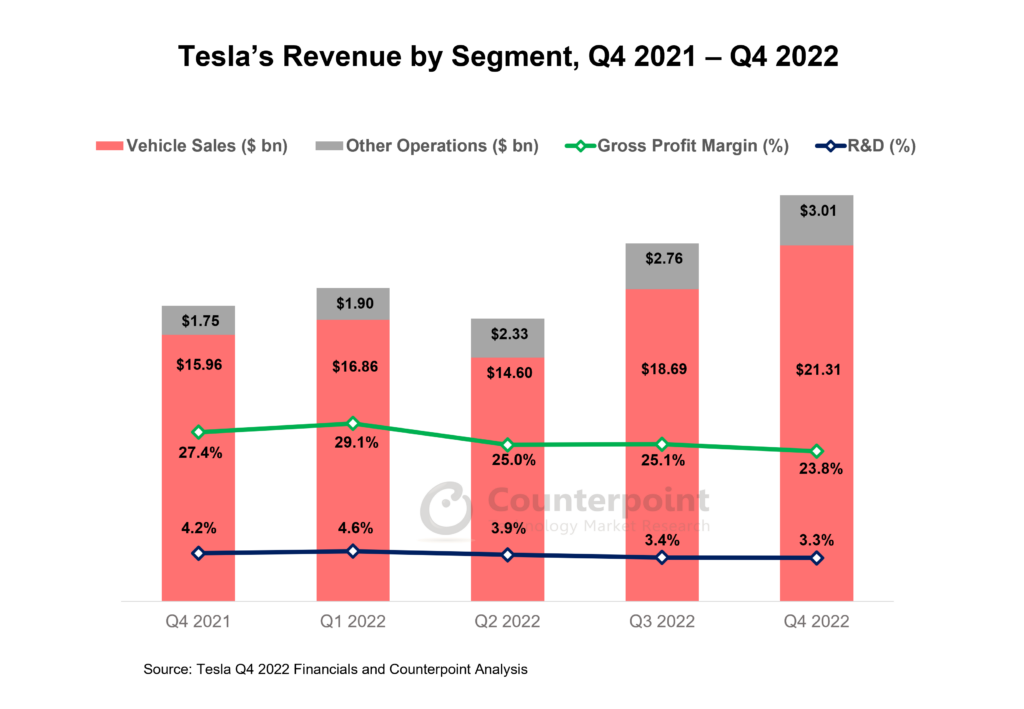
  • Tesla’stotal revenueduring Q4 2022 stood at $24.3 billion, an increase of 37% YoY. The company generated more than $20 billion from automotive sales. During Q4, the widespread release ofTesla’s full self-driving(FSD) feature generated $0.32 billion in revenue, indicating that the company is striving to increase the proportion of software revenue in its overall product mix.
  • Revenue from Tesla’sother businesseslike energy storage, solar panel deployment, charging and vehicle servicing grew by almost 72% YoY to exceed $3 billion. Other businesses contributed 12% of Tesla’s Q4 revenue.
  • Tesla deployed 2.46 GWh ofenergy storageduring Q4. At 151.7%, it saw the highest YoY growth till now.
  • Tesla’s total revenue for 2022 exceeded $81.4 billion, a 51% YoY growth.
  • During Q4,gross profitalso increased by 19% YoY and stood at $5.7 billion. In October, Tesla reducedvehicle prices in Chinaafter increasing them a couple of times during H1 2022. Initially, it was thought the increase in demand would make up for the price cut but the negative foreign exchange impact restricted further gross profit growth.
  • Tesla’sinventoryin Q4 stood at 34,423 units, bringing the annual total to 55,760 units. The COVID-19 outbreak in China and the increased production in the Berlin factory are probable causes of the higher inventory. In addition, Tesla is facing stiff competition as legacy automakers and new players are offering more affordable EVs. In January 2023, Tesla lowered prices globally, which may help in clearing out inventories and achieving economies of scale.
Tesla production and deliveries, Q4 2021-Q4 2022 Counterpoint Research

Outlook

Tesla’s strong fundamentals are expected to keep the company ahead of most other electric vehicle brands globally. Tesla announced price cuts in January 2023, which has resulted in the demand ballooning to twice the production. Besides, pilot production of the Tesla Semi began in 2022 and the vehicle is expected to hit the road soon. The company also plans to start production of theCybertruck在2023年代中期。此外,特斯拉最近宣布an investment of $3.6 billion to set up a 100GW capacity cell factory and a high-volume semi factory. Tesla’s 2023 vehicle deliveries are projected to exceed 1.7 million units, with a 31% YoY growth. This seems attainable if the company’s recent price cuts remain in effect for most of the year.

Related Posts:

Low, Mid TWS Segment Sees Fast Expansion in Q3 2020

  • 全球TWS市场集团在2020年第三季度增长了24%。中国nd Asia-Pacific showed highest growth.
  • Premium TWS brands’ market expansion slowed while low- and medium- priced brands
    strengthened presence in major markets.
  • Chinese smartphone OEMs are expected to continue to expand their share in TWS market.

Global TWS market grew 24% QoQ in Q3 2020 despite the economic crisis caused by the pandemic, according to theCounterpoint Global Hearables (TWS) Market Tracker for Q3 2020.精彩的低收入和中等价位段的助手d this growth. Considering the strong seasonality in Q4 with Black Friday and Christmas promotions, the market in 2020 is expected to slightly exceed the initial annual estimate of 220 million units.

Continued content growth and rising mobile video consumption have helped drive TWSdemand.Above all, the recent trends of phone makers scrapping the earphone jack in phones and removing earphones from the box are having a large impact on market growth.

In terms of regions, China and AP ex CN (Asia-Pacific excluding China) showed high growth in Q3 2020. NAM (North America) maintained its first place with a 31% share. However, owing to rapid growth in other regions, its share dropped by 5%p compared to Q2 2020.

Exhibit 1: Global TWS Market, Q3 2020

Counterpoint Research Global TWS Market Q3 2020
Source: Global Hearables (TWS) Market Tracker

The sub-$100 price band captured more than half of the total market for the first time, accounting for 56% share in Q3 2020. Awareness of the low- and mid-end models increased due to weak consumer confidence along with the expansion of online channels. The COVID-19 pandemic continues to positively impact demand for budget devices, especially in NAM and China.

Exhibit 2: Market Share by Price Band, Q3 2020

Counterpoint Research Market Share by Price Band Q3 2020
Source: Global Hearables (TWS) Market Tracker

In terms of brands, Apple remained theleaderin Q3 2020, but its market share fell by 6%p QoQ to 29%. Shares of other premium TWS brands such as Samsung andJabraalso fell. However, the biggest entry-level brand, Xiaomi, still grew and its four models, including the Redmi AirDots and AirDots S, figured in the global top 10 list of bestsellers in Q3 2020. QCY and JLab also expanded their market presence with strengthened model line-ups and competitive pricing strategies.

Exhibit 3: Global Top 10 Bestsellers, Q3 2020

Counterpoint Research Global Top 10 Bestsellers Q3 2020
Source: Global Hearables (TWS) Market Tracker

Amid the high growth witnessed in the global TWS market in Q3 2020, the low- and mid-priced product lines stood out. Apart from the pandemic-triggered reasons, the decreasing gap between these and premium segments in terms of technologies used, like noise cancellation and connectivity, also played its role.

This trend is expected to continue. Chinese smartphone OEMs such as Xiaomi and realme will continue to grow by focusing on low- and mid-priced TWS products and benefitting from brand recognition and solid distribution networks.

Related Posts and Reports

Japan Smartphone Sales Recover to Pre-COVID Levels in Q3 2020

• Low- and mid-end devices drive recovery

• Q4 to maintain momentum, led by iPhone 12

Japan’s smartphone market showed clear signs of recovery in Q3 2020 after theCOVID-induced low point in the previous quarter, according to Counterpoint’s Japan handset tracker. Smartphone sales plummeted 24% YoY in Q2 2020 but went up 10% YoY in the following quarter.

Japan reported an average of 600 daily new cases during the first wave ofCOVID-19 in March, but these surged to above 1,000 per day during the second wave in August. Despite this, the smartphone market managed to rebound and return to the pre-viruslevels. This rapid recovery was driven by thelatest iPhone SEand many other mid-and low-end smartphones aimed at increasingly cost-sensitive consumers. Moreover, the country’s overall consumer sentiment started to improve slowly in Q3 2020 as the Japanese government avoided strict measures that would have impacted the economy.

Exhibit 1: Japan Smartphone Unit Sales

Counterpoint Research Japan Smartphone Unit Sales
Source: Counterpoint Japan handset tracker

Apple lost share due to delayed launch ofnew iPhone

Apple, the top smartphone player in Japan, saw its market share decline to 45% in Q3 2020 from 50% a year ago due to the delayediPhone 12launch. Samsung fared well, with its market share increasing from 5% in Q3 2019 to 8% in Q3 2020, driven by the Galaxy A20 and other A-series models. OPPO was another brand that saw a gradual expansion, with its market share increasing from 2% in Q3 2019 to 5% in Q3 2020.

Apple’s iPhone sales were driven by theiPhone SE 2020, which solely captured 26% of the total market in Q3 2020. TheiPhone SE 2020offers compact design — appealing to the iPhone users who prefer small displays with new hardware — at low prices. The combination of these attractive features led to remarkable results in the wake of thepandemic

Exhibit 2: Japan Smartphone Brand Share

Counterpoint Research Japan Smartphone Brand Share
Source: Counterpoint Japan handset tracker

Low and mid segments eye new growth opportunity

The Japanese smartphone market in Q3 2020 saw the premium segment contract, but the low and mid segments expanded. The sub-$150 price band jumped from 5% in Q3 2019 to 19% in Q3 2020, helped by the Samsung Galaxy A20 and Fujitsu Arrows Be4. In contrast, the $600 and above band plunged from 35% in Q3 2019 to 18% in Q3 2020. There were some favorable developments that took place in the low and mid segments, like Apple’siPhone SE 2020performing well and Samsung and OPPO introducing a wide range of devices. Premium smartphones have dominated Japan’s market for past several years. Thepandemicoffered a new opportunity for the low and mid segments to lead the overall market.

Exhibit 3: Japan Smartphone Price Band Share

Counterpoint Research Japan Smartphone Price Band Share
Source: Counterpoint Japan handset tracker

Q4 outlook: Apple to drive Japan market withiPhone 12

We expect Q4 2020 to maintain momentum, led by theiPhone 12, which was released during this quarter. TheiPhone 12’sinitial sales have been strong, signaling its Q4 sales will outperform those of the iPhone 11. We see multiple factors in play for the potential success of theiPhone 12the first 5G iPhone, pent-up demand created by thepandemic, and a large number of iPhone users wanting to replace their devices.

Related Posts and Datasets

COVID-19 Weighs on European Smartphone Market in Q1 2020

  • The viral outbreak followed by lockdowns caused the Europe smartphone market to contract by 7% YoY and 23% QoQ
  • Apple remained resilient while Huawei declined sharply for the quarter – though this was more than COVID-related

New Delhi, Mumbai, Hong Kong, Taipei, Seoul, San Diego, London, Buenos Aires – June 3rd, 2020

Smartphone sales declined 7% year-on-year (YoY) and 23% quarter-on-quarter (QoQ) in Europe during Q1 2020 amidCOVID-19爆发,根据对应的市场脉搏service. The impact of the pandemic was relatively stronger for Western Europe, down 9% YoY, than for Eastern Europe, down 5% YoY.

Commenting on the overall market,Peter Richardson, VP of Researchsaid, “Q1 is seasonally weak, but the coronavirus outbreak amplified this. The smartphone market decline was primarily due to COVID-19 outbreak across the region in the second half of the quarter. The biggest five markets in Europe entered lockdowns of varying severity at different points in March. Consequently, most of the offline stores were closed, though online remained open throughout. Also, the economic impact of the pandemic has led to lengthening replacement cycles as consumers withhold making discretionary purchases.”

Europe Smartphone Sales Market Share (%), Q1 2019 vs Q1 2020

Amid the COVID-19 outbreak, Italy was the worst affected of all European countries, driving the smartphone market to a 21% YoY decline. In other markets, some operators such as Vodafone, and retailers such as Dixons Carphone were able to adjust to the sharply higher online demand and somewhat offset the decline. Others however, like Mediamarkt/Saturn in Germany, had underinvested in digital channels and lost sales due to store closures.

Coronavirus did not officially make its presence felt in Russia until late March/early April and hence the market remained relatively resilient in Q1 2020, declining just 1%.

Counterpoint Europe Smartphone Market Q1 2020

Commenting on the top OEMs in the European market,Abhilash Kumar, Research Analystsaid, “Samsung continues to lead the chart for Q1 2020. This is driven by Samsung’s diversified portfolio across all price bands. Also, marketing campaigns around the Galaxy S20 launch boosted its overall sales. Unlike Chinese OEMs, Samsung had no supply issues and was not impacted by China lockdown worries.Appleremained flat for the quarter and showed its resilience during the COVID-19 crisis. The iPhone 11 series continues to perform well, despite a lack of supply in some markets and some channels. However, the expensive models slowed considerably in March. Huawei declined a sharp 43% YoY for the quarter as the US trade sanctions continue to bite. Xiaomi has been the biggest beneficiary from Huawei’s decline as it grew 145% YoY capturing 11% share in the quarter.”

Key market summary:

  • Huawei’s co-brand Honor led the Russian smartphone market in Q1 2020.
  • Chinese OEMs like Xiaomi and OPPO benefited fromHuawei’s continuing struggles and hence grew more than 150% YoY for the quarter driven by strong performances in Russia, UK, France.
  • 5Gsmartphone sales accounted for 4% of the overall market sales in Europe in Q1 2020.
  • Apple iPhone 11 was the best-selling model in Europe in Q1 2020.

Analyst Contacts:

Peter Richardson

twitter logo

Abhilash Kumar

twitter logo

Follow Counterpoint Research
press@www.arena-ruc.com

twitter logo

Term of Use and Privacy Policy

Counterpoint Technology Market Research Limited

Registration

In order to access Counterpoint Technology Market Research Limited (Company or We hereafter) Web sites, you may be asked to complete a registration form. You are required to provide contact information which is used to enhance the user experience and determine whether you are a paid subscriber or not.
Personal Information When you register on we ask you for personal information. We use this information to provide you with the best advice and highest-quality service as well as with offers that we think are relevant to you. We may also contact you regarding a Web site problem or other customer service-related issues. We do not sell, share or rent personal information about you collected on Company Web sites.

How to unsubscribe and Termination

You may request to terminate your account or unsubscribe to any email subscriptions or mailing lists at any time. In accessing and using this Website, User agrees to comply with all applicable laws and agrees not to take any action that would compromise the security or viability of this Website. The Company may terminate User’s access to this Website at any time for any reason. The terms hereunder regarding Accuracy of Information and Third Party Rights shall survive termination.

Website Content and Copyright

This Website is the property of Counterpoint and is protected by international copyright law and conventions. We grant users the right to access and use the Website, so long as such use is for internal information purposes, and User does not alter, copy, disseminate, redistribute or republish any content or feature of this Website. User acknowledges that access to and use of this Website is subject to these TERMS OF USE and any expanded access or use must be approved in writing by the Company.
– Passwords are for user’s individual use
– Passwords may not be shared with others
– Users may not store documents in shared folders.
– Users may not redistribute documents to non-users unless otherwise stated in their contract terms.

Changes or Updates to the Website

The Company reserves the right to change, update or discontinue any aspect of this Website at any time without notice. Your continued use of the Website after any such change constitutes your agreement to these TERMS OF USE, as modified.
Accuracy of Information: While the information contained on this Website has been obtained from sources believed to be reliable, We disclaims all warranties as to the accuracy, completeness or adequacy of such information. User assumes sole responsibility for the use it makes of this Website to achieve his/her intended results.

Third Party Links: This Website may contain links to other third party websites, which are provided as additional resources for the convenience of Users. We do not endorse, sponsor or accept any responsibility for these third party websites, User agrees to direct any concerns relating to these third party websites to the relevant website administrator.

Cookies and Tracking

We may monitor how you use our Web sites. It is used solely for purposes of enabling us to provide you with a personalized Web site experience.
This data may also be used in the aggregate, to identify appropriate product offerings and subscription plans.
Cookies may be set in order to identify you and determine your access privileges. Cookies are simply identifiers. You have the ability to delete cookie files from your hard disk drive.
This site is registered onwpml.orgas a development site.