Although overall global smartphone shipments declined in Q2 2023, global foldable shipments rose.
In H2 2023, competition in the global foldable product market is set to escalate significantly, driven by the earnest entry of Chinese companies like OPPO and HONOR.
The global foldable market is expected to experience substantial growth in 2024, driven by the introduction of entry-level foldable products.
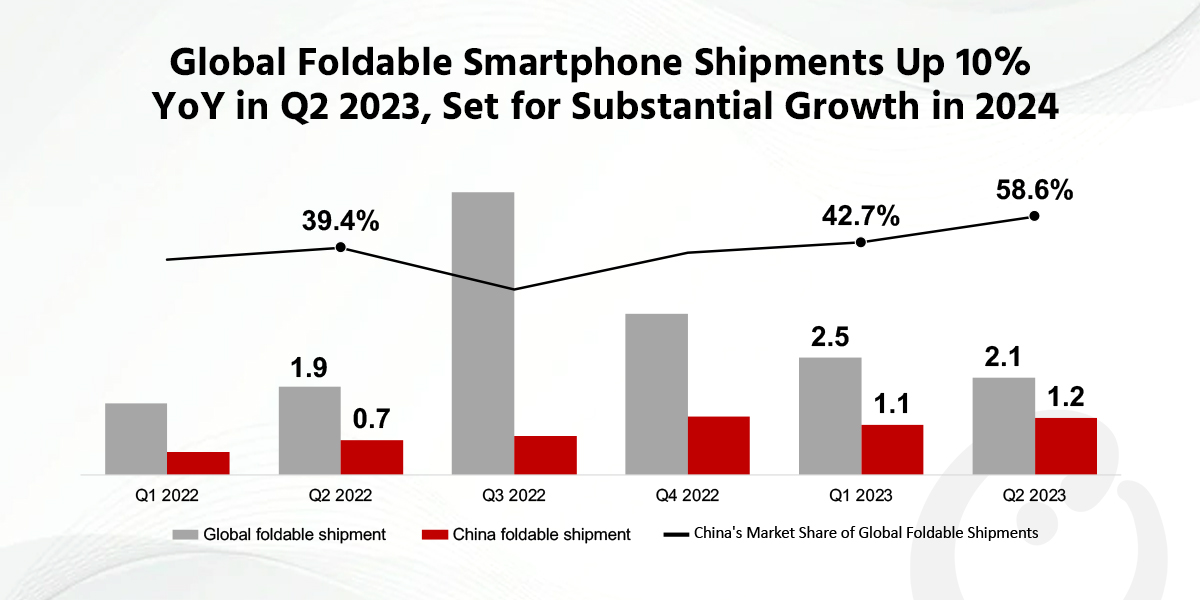
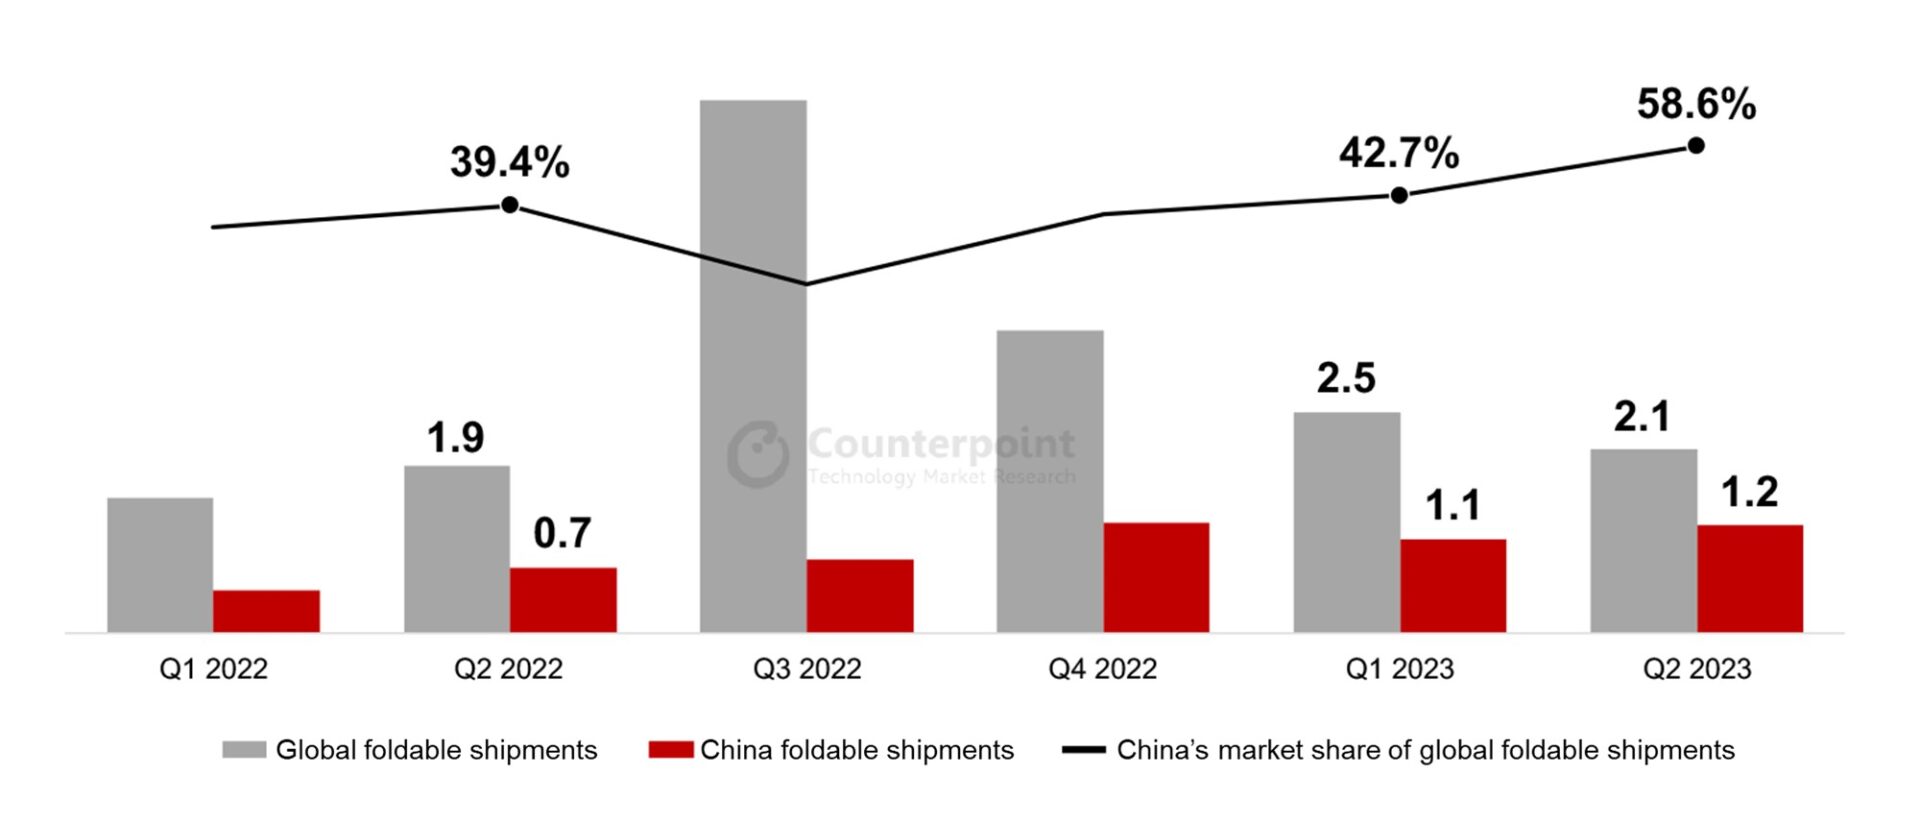
The global foldable smartphone market increased 10% YoY in Q2 2023 to reach 2.1 million units, according to Counterpoint Research’s most recentglobal foldable smartphone tracker.This growth is in stark contrast to that of the global smartphone market, which showed a 9% decline in shipments during the quarter to reach 268 million units. Due to the prolonged Russia-Ukraine war and the ongoing high global inflation, the smartphone market is expected to grow sideways. Nevertheless, the foldable smartphone sector continues to exhibit robust and sustained growth.
Global and ChinaFoldable Smartphone Shipments, Q1 2022-Q2 2023
The foldable smartphone landscape in the Chinese market presents a particularly intriguing scenario. During Q2 2023, shipments in the overall Chinese smartphone market slipped 4% YoY to reach 61.9 million units, hurt by the recent economic challenges faced by the country, which led to a reduction in consumer spending. However, the Chinese foldable smartphone market achieved notable success, surging 64% YoY to reach 1.2 million units. China now commands the largest share of the global foldable smartphone market, with a 58.6% share.
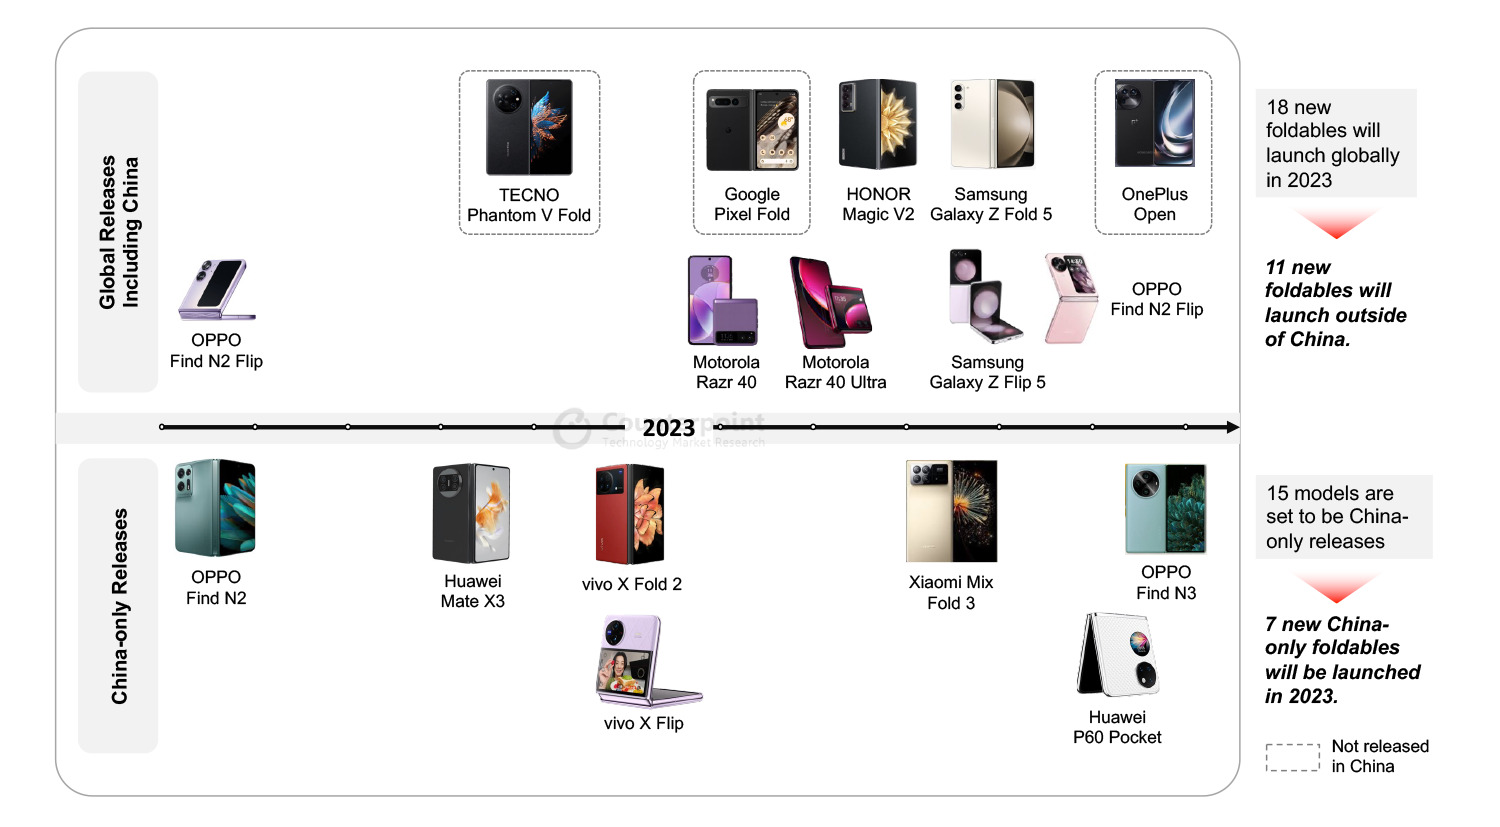
FoldableProduct Launch Status in 2023: Comparison of Global and Chinese Foldable Markets
The rapid growth of the Chinese foldable market is primarily attributed to the introduction of foldable products tailored for the Chinese market, coupled with a strong demand for these products among Chinese consumers. In Q2 2023, significant momentum is building for the continued growth of the foldable market. This surge was driven by the introduction of key products such as the Huawei Mate X3, vivo X Fold 2, and vivo X Flip, primarily targeting the Chinese foldable market. Additionally, the global (including China) launch of the Motorola Razr 40 and Razr 40 Ultra, further contributed to this growth trend. In Q2 2023, China saw the launch of five new foldable products tailored for its market, while the global market outside China only saw two foldable product launches during the same period.
Counterpoint Research Senior Analyst Jene Parksaid, “We believe that these frequent product launches (along with the marketing effects that accompany product launches) are changing Chinese consumers’ perception of foldable products. Consequently, Chinese consumers can access a variety of foldable products more easily and frequently than any other market in the world. The continuous release of various foldable products is recognized as one of the important reasons why the Chinese foldable market has continued to grow significantly compared to other markets.”
The global foldable smartphone market will undergo significant changes in H2 2023. Chinese manufacturers are expanding their presence internationally during this period, with notable releases including the HONOR Magic V2, OPPO Find N3 Flip, and the yet-to-be-named OnePlus foldable device. Notably, Samsung’s Galaxy Z Fold 5 and Galaxy Z Flip 5, considered to be some of the top-tier foldable offerings, were launched in August and are expected to capture a substantial market share in H2 2023.
Park补充说,“全球智能手机市场可折叠et to see significant growth in the H2 2023, driven by the expansion of Chinese manufacturers. Although Samsung’s market share may dip due to increased competition, we believe that it will be a natural result. However, competition among manufacturers usually has the effect of increasing the size of the market for the product. We believe that the era of the mass foldable phone is expected to start in 2024, mainly led by Samsung and Huawei with their entry-level foldables. Entry-level foldables are expected to be priced around $600 to $700, making them more accessible to consumers.”
Expansion, Premiumization Drive Transsion’s Record Quarter
September 4, 2023
Transsion Holdings reported revenues of RMB 25.03 billion for the first half of 2023, registering a growth of 8.3% YoY. Net profit grew 27.2% YoY primarily due to better product mix (higher proportion of智能手机sas compared to feature phones, with the former accounting for 92% of group revenues) and geographical expansion into higher-value markets.
Q2 2023 was the bright spot as revenues were up 30.7% while net profit grew 83.9%. It was the best quarter in Transsion’s history in both revenue and net profit terms. Gross margins also improved to 24.5%, up 2.4% from a year ago.
Much of Transsion’s turnaround in the key financial metrics above can be attributed to a rebound in macroeconomic fundamentals in theAfricanhome market and beyond. Most importantly, inflation rates have come down while food prices have stabilized. Local currencies have also found a stronger footing while several indebted countries across theemergingmarkets have managed to secure restructuring packages with lenders. As Africa’s most entrenched handset company, thanks to its deep channel penetration and marketing heft, Transsion once again benefitted the most from the upturn.
Transsion’s operating cost in H1 2023 increased 5% YoY as the company is ramping up its operations, particularly in newer markets. It has been aggressive with sales and marketing despite the cyclical downturn, with the spending on these activities increasing 23.6% YoY in H1 2023. R&D spending was also up 20.6% YoY to drive premiumization efforts and develop higher-value products to target the new markets. Costs attributed to management grew 6% YoY, whereas cash flow from operating activities turned positive, primarily due to the reduction in the cost of components and materials, as the company is reducing its inventory and moving towards a leaner operating model.
According to Counterpoint Research, Transsion’s smartphone sales volume grew 3% YoY in the first half of 2023 and 17% YoY in Q2 2023 as demand for TECNO智能手机sincreased globally, especially in the company’s newer markets. This helped Transsion’s cash flow, as cash on hand increased 61% YoY to reach an all-time high of RMB 12.79 billion. The number of inventory days dropped further to 61, from 86 a year ago. Therefore, the inventory problem that has been troubling the company for the past year has successfully been managed.
Much of Transsion’s financial successes can be attributed to its continued commitment to entering new markets. In Q2 2023, Africa accounted for 57% of Transsion’s smartphone sales volume, a net drop of 8% from a year ago. Outside Africa, Transsion smartphone sales grew 35% in Q2 2023, most notably in Latin America, EasternEurope,Indiaand Southeast Asia.
The reason for Transsion’s big increase in profitability is found in its ability to upsell to customers. Average selling prices (ASP) for Transsion smartphones rose by 14% YoY for two years in a row. The MEA region anchored the increase as a big expansion into the Middle East was the main factor. In a bid to replicate its success in Africa, Transsion has targeted the low end when entering new markets, but there is potential for the company to grow beyond the current level.
While Transsion continues to enjoy stable gross margins of around 30% in Africa, the company does face a more competitive landscape in the rest of the world, with gross margins of 15%-20%. However, there is room for improvement as the company continues with its premiumization strategy. In a recent interview, Transsion VP Qi Zhang said the company would be launching a flipfoldablein September in another attempt to showcase its technical prowess in the premium segment.
Q3 Revenue Stays Resilient, But Profit Declines Sharply as Costs Balloon
December 13, 2022
Transsion Holdings has reported flat revenue growth for Q3 2022 at 12.9 billion RMB. However, net profit slumped 47.4% YoY due to macroeconomic headwinds, inventory destocking initiatives, competitive pressures, and higher R&D and market expenditure.
Transsion Group Quarterly Revenue and Net Profit Margin
Transsion’s Q3 smartphone shipments fell 18% YoY, as emerging market demand was hammered by macroeconomic concerns. Inflation rates ticked higher, continuing the pressure on lower-income consumers with high food and energy prices. Local currencies too continued to depreciate against the US dollar.
尽管装运数量大幅下降,Transsion’s revenues still achieved positive growth. This was due to a big increase in smartphone selling prices. TECNO and Infinix’s average selling prices (ASPs) rose 26% and 28% YoY respectively. Transsion was able to achieve this due to successful iterations of mainstream devices across TECNO and Infinix, while launching more sophisticated devices that have gathered popularity among aspiring switchers. On the other hand, bringing higher-value products to more mature markets in India and Southeast Asia meant higher contribution from higher-end products to the company’s revenue mix.
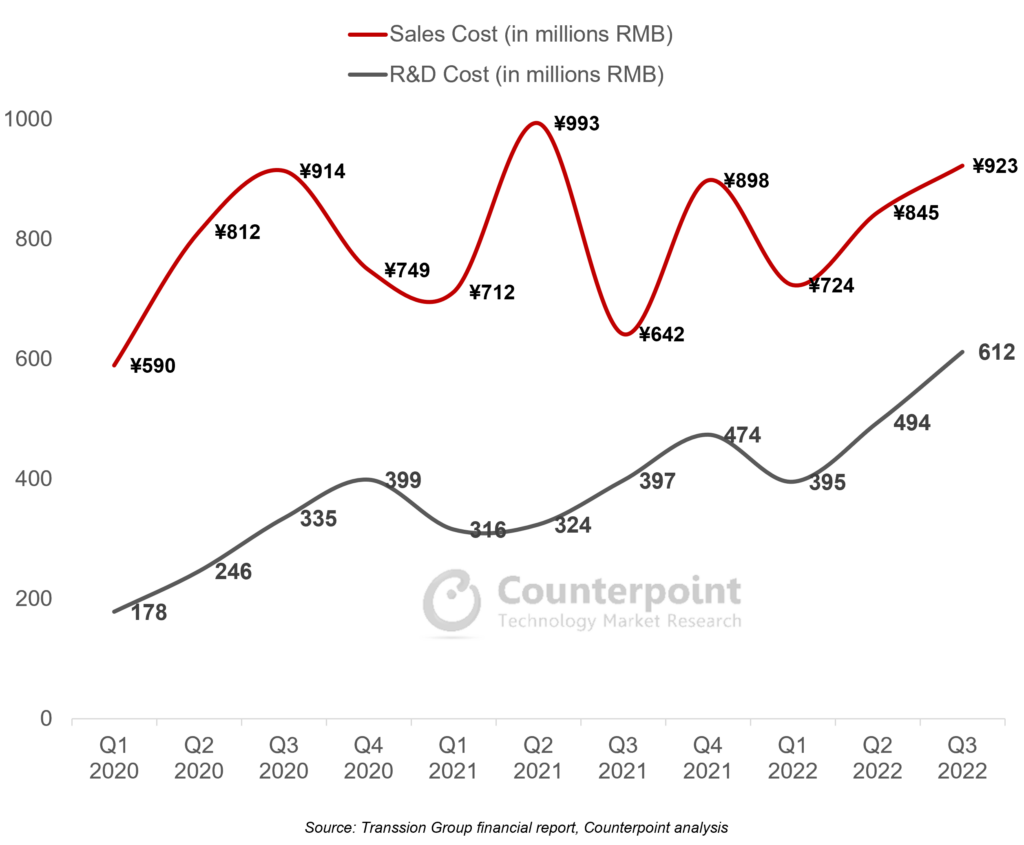
Transsion Group Financials Deep Dive – Sales, R&D and Inventory
Three items, in particular, caught our attention in Transsion’s Q3 report:
Inventory:Since the COVID-19 lockdowns, Transsion has moved decidedly away from the feature phone business and into the smartphone business. In parallel, inventory levels have also crept up, reaching an all-time high of 80% of quarterly revenues in Q2 2022, which caused discomfort for the management. In Q3, this level was brought down to a more manageable 57%, which put pressure on margins in the quarter but removed a significant uncertainty for future quarters, as the smartphone market is not expected to rebound until well into 2023.
Sales cost:除了销货成本,销售成本的代表resent the biggest cost item in Transsion’s income statement. In a year when Transsion has reported slowing revenue growth, its sales costs have increased significantly as the company paves the way for an aggressive expansion into other regions. Transsion will be hoping the global smartphone market recovers quickly in 2023, but its investment case could come into doubt if smartphone shipments and market share do not pick up meaningfully in its key markets in the next few quarters.
R&D:Transsion is spending heavily on R&D, which is an encouraging sign as the company aspires to move into higher-value smartphone segments and other smart device categories. We expect this trend to continue as the window of opportunity for entry-level devices narrows, considering device costs are expected to creep up, in line with the inflation rate.
Last quarter, we discussed Transsion’s stock options plan for 2022, which is linked to 2024 financial metrics. We expect the company to target 20-25% annual revenue growth rates for both 2023 and 2024. Much of this will depend on the company continuing to move up the smartphone value chain with 5G-capable devices, entry into IoT segments and monetization initiatives for its wide user base. Above all, the recovery of the global economy and smartphone market will be pivotal for Transsion as it gradually becomes more exposed to a wide range of different geographical locations.
Resilient Q2 Performance Driven by Pivot to Value, But Macroeconomic Challenges Remain
August 29, 2022
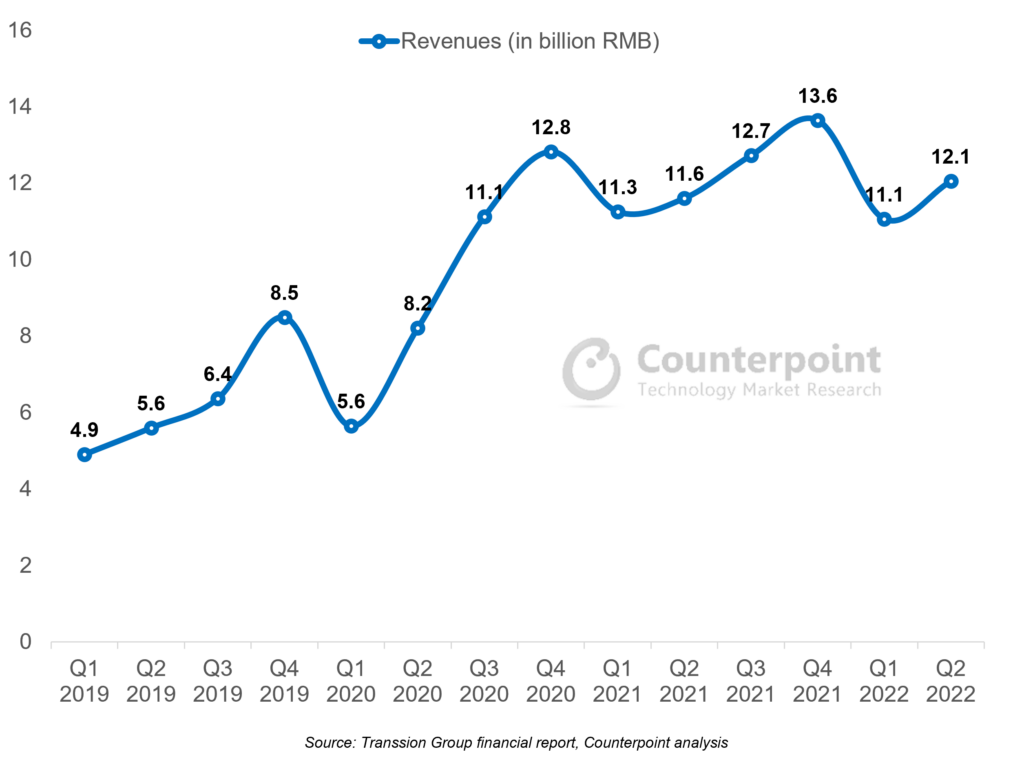
Transsion Holdings reported a 3.7% YoY increase in its Q2 2022 revenue to RMB 12.1 billion and a 4.5% YoY decline in net profit to RMB 1.04 billion. Considering the macroeconomic headwinds in Transsion’s core markets, the increase in revenue was a bright spot, especially compared with Q1 when the company posted a quarterly revenue drop for the first time since its market debut in September 2019.
Transsion Group Quarterly Revenue
Transsion’s Q2 smartphone shipments grew 4.1% YoY, an impressive performance despite a shrinking global market, whichretreated 9%YoY during the quarter. Geopolitical tensions and high inflation rates have hurt the global smartphone market in general. Further, companies exposed to the low- to mid-end segments and emerging markets are more prone to secondary impacts, such as the strain on customers from high food and energy prices, weaker local currencies against the US dollar, and higher government taxes and levies on ‘non-essential’ imports like consumer electronics.
Transsion defied these global trends through resilient performance in its Africa home market and strong growth in other regions, most noticeably in India and Southeast Asia. In both these regions, Transsion is ranked sixth in terms of shipments, helped by the company’s double-digit annual growth rate. Gaining a foothold in these new markets helps the company diversify its revenue sources and also allows the company to move up the pricing curve. According to Counterpoint’s Model Sales Service, Transsion’s smartphone average selling prices (ASP) increased 14% YoY, mainly driven by the success of the company’s TECNO and Infinix brands. The brands’ latest products received good market reception and are edging closer to the $150 mark.
Due to the increased pricing, Transsion’s Q2 normalized gross profit margin reached 22.9%, up 1.4% YoY, to reverse a six-quarter slump. However, the bottom line retreated, mainly due to a significant 40% increase in R&D spending. In our view, this is a positive sign that the company is moving out of its comfort zone of focusing only on pricing competitiveness in its African home market and committing to make more sophisticated products for the higher value markets.
Despite our positive commentary, we also recognize the significant challenges brought on by the macro environment, which is not likely to ease in the near term. In Q2 2022, we observed inventory challenges across handset and component makers, including Transsion. The company’s inventories reached RMB 9.6 billion as at the end of Q2, 27% higher than that in Q4 2021 and 73% more than in Q4 2020. Currently, inventory levels are 19% of the company’s 12-month trailing revenue, which could become an issue if it remains high or if revenue declines in the coming months.
We also note that the company’s recently announced stock options plan for 2022 is linked to its targeted 2024 financial metrics. The plan suggests that the company forecasts revenue and net profit to increase 15% and 32.25% respectively as a baseline case, or 20% and 44% respectively as a bull case by 2024. The targets are compared with the metrics from 2021, which was a strong financial year for Transsion, indicating that the company is extremely bullish about the next couple of years.
Growth Worries in Africa, India See First Revenue Drop Since COVID-19, But Diversification Efforts on Track
June 6, 2022
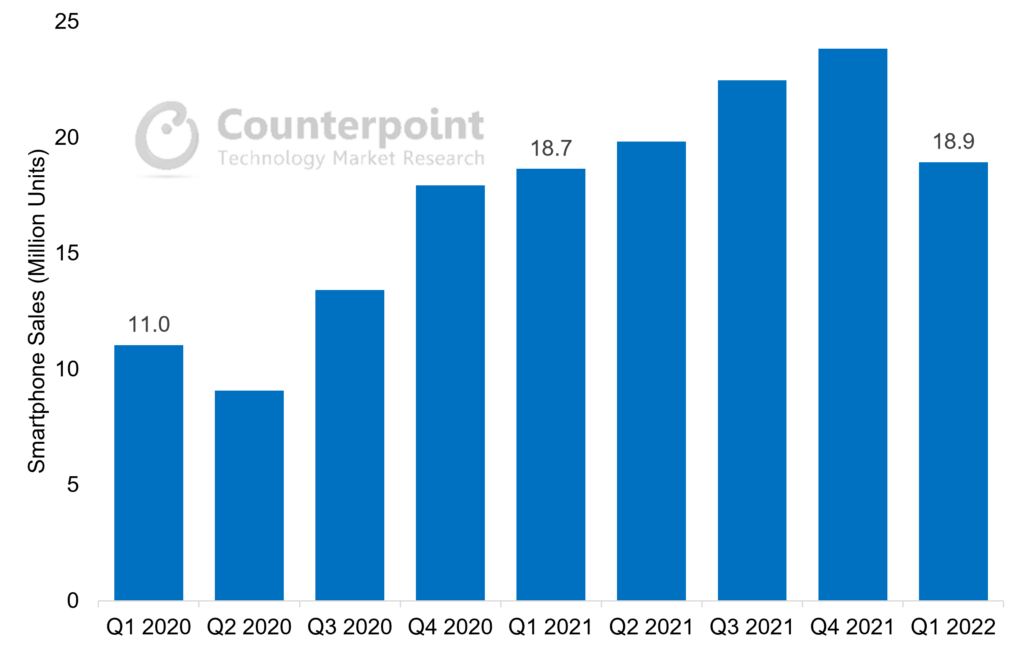
Transsion Holdings reported Q1 2022 earnings that saw revenues and net profit drop 1.8% and 7.6% YoY respectively. This is Transsion’s first revenue and profit drop since it went public in September 2019. The company’s performance during the quarter was impacted mainly by the stalled growth in its home market Africa and in India, which saw inflationary pressures hitting lower-income consumers significantly. Smartphone sales were down in the region for the first time since the pandemic. However, the company was cushioned by growth in other regions, and margins remained intact despite inventory build-up.
According to Counterpoint Research’sMarket Pulseservice, cumulative Transsion smartphone shipments reached 18.9 million units in Q1 2022. This was a small increase of 1.6%, the slowest YoY growth rate since the pandemic.
Transsion Group Quarterly Smartphone Sales
Source: Counterpoint Market Pulse Service
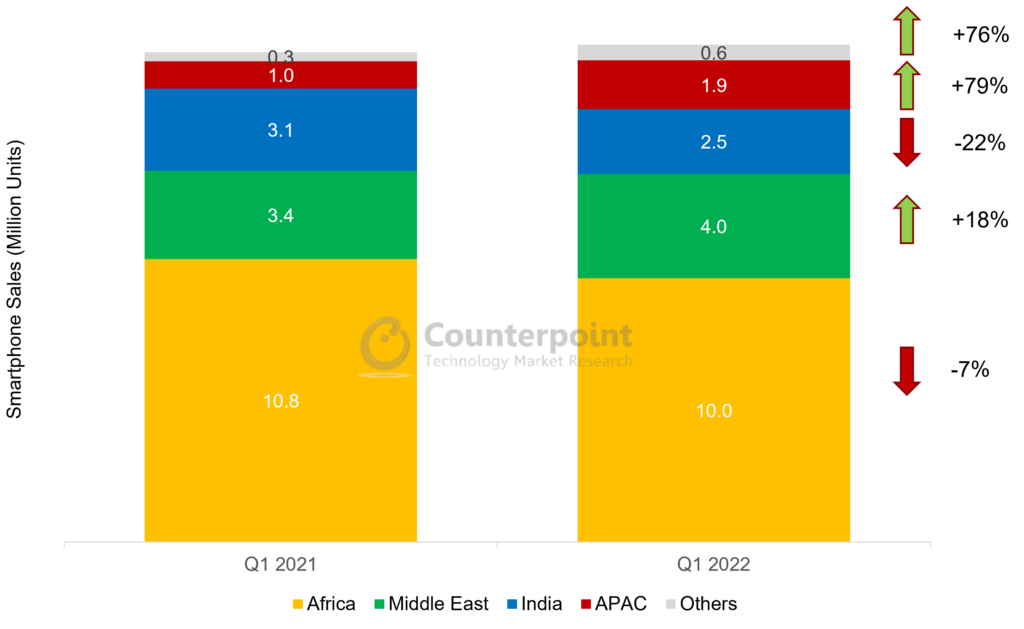
Looking further under the hood, there are significant regional disparities, however. In Africa, Transsion saw a 7% decline in smartphone sales in Q1 2022, mainly due to the inflationary impact on consumer sentiment. Most large African markets were already running double-digit inflation during 2021, but the Ukraine war had far-reaching consequences as food imports were hampered, affecting lower-income consumers more. Depreciating local currencies also put pressure on the company’s supply chain and margins.
In India, similar macro concerns and impact of the Omicron wave saw the smartphone market record the first Q1 drop ever. Here, Transsion smartphone sales dropped 22%. The market sentiment in India is expected to remain weak in Q2, but sales are likely to see growth due to the low base of Q2 2021 when the market was hit hard by the Delta wave.
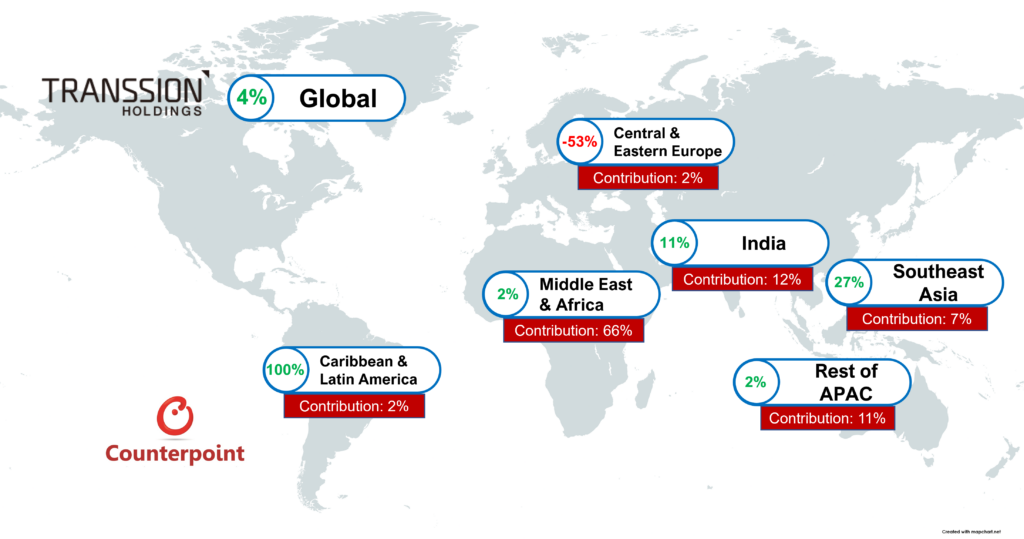
On the other hand, Transsion had resilient performances in the Middle East and APAC, which show its diversification efforts are working. In both regions, the company is finding success in penetrating the entry-level segment in key countries like Pakistan and Bangladesh. Transsion’s 79% sales increase in APAC runs counter to the broader market. In the Middle East, the 18% sales increase is likely to extend further in 2022, as the region is expected to be the best-performing smartphone market due to the economic growth driven by oil revenue increases, mainly in Gulf Cooperation Council (GCC) countries.
Transsion Group Smartphone Sales by Region, Q1 2022 vs Q1 2021 (In million units)
Source: Counterpoint Market Pulse Service
Transsion’s normalized gross profit margins for Q1 2022 decreased to 21.4%, or 2% less than the same period in the previous year. Significant cost pressures persisted due to lingering supply chain disruptions, component shortages and high inventory levels. Rising revenues from other regions are also likely to cap the company’s margins, as it enjoys far higher margins in its home market Africa. However, Transsion now derives 87% of its revenues from the smartphone business, and as feature phone-to-smartphone migration continues for its emerging market customers, we see further room for the company’s revenues and margins to grow.
Transsion signs off 2021 in style: Smartphone market share continues to increase in emerging markets
2022年4月28日
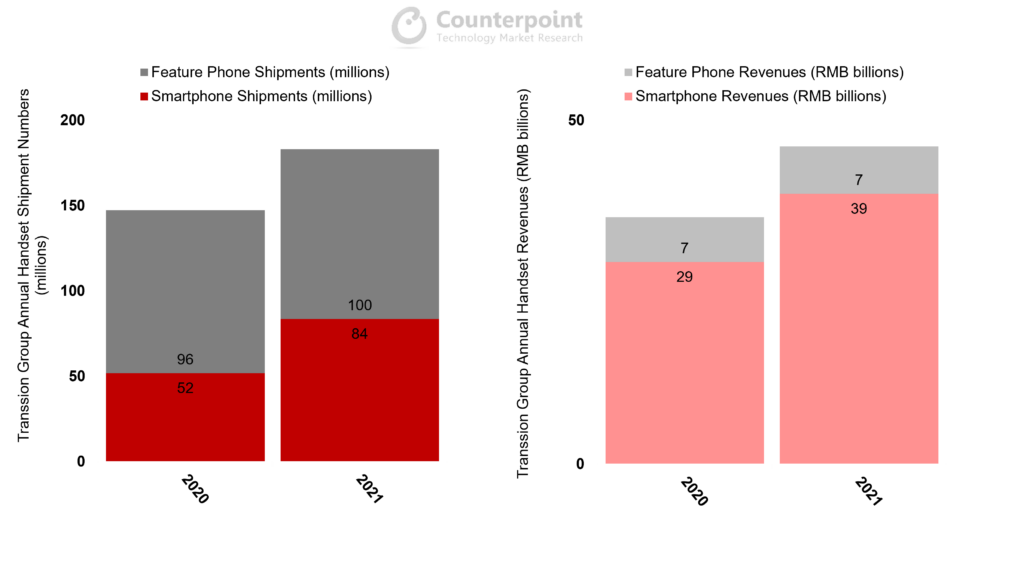
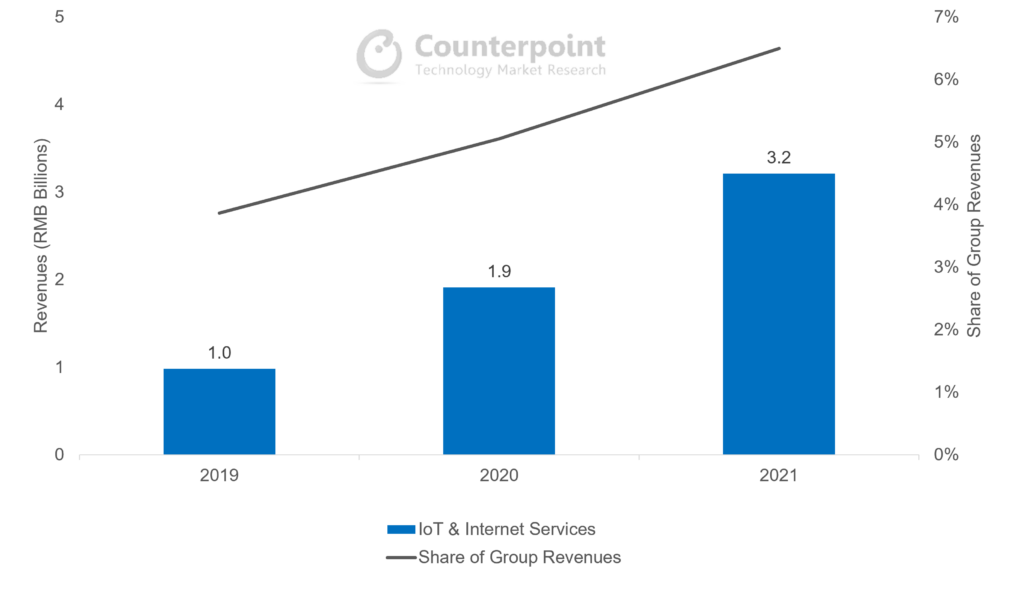
Transsion Holdings reported 2021 results with revenues up 31.8% YoY and net profit up 45.5% YoY. These results were driven mainly by increasing smartphone sales and market share, which widened in the core African market, while achieving breakthroughs in key South Asian countries like Pakistan, Bangladesh and India. IoT and internet services, which accounted for 6.5% of the group’s revenues in 2021, also saw robust triple-digit growth.
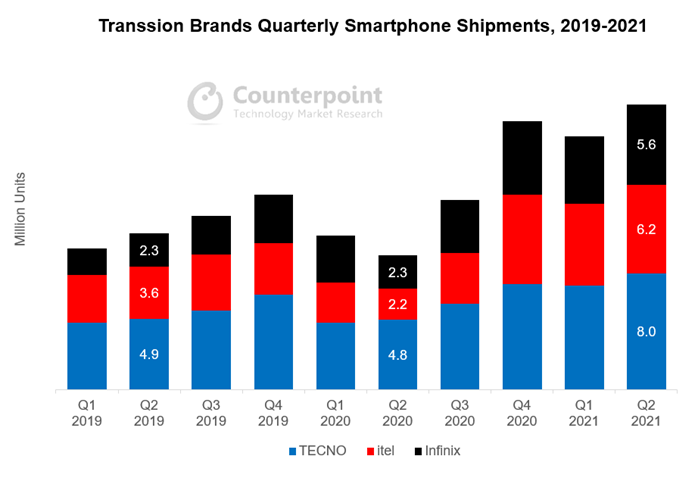
According to Counterpoint Research’sMarket Monitorservice, cumulative Transsion handset shipments reached 184 million units in 2021, an all-time high. Smartphones, in particular, grew 61%.
Transsion Group Handset Shipment and Revenue Analysis
Sources: Counterpoint Market Monitor Service, Transsion Group financial statements
Transsion continued to do well in its home market Africa, where it already dominates with close to 45% share across its three brands. However, Africa accounted for only half of the shipment increases in 2021. In India, Transsion almost doubled its smartphone sales in one year, while the company is already the biggest smartphone OEM in Pakistan. As such, Transsion smartphone sales attributed to Africa decreased from 67% in 2020 to 56% in 2021. A widening geographical footprint, accompanied by an enriched portfolio, can help the company diversify its customer base and increase its technical prowess.
The company also reported surprisingly good revenue growth from other businesses. Revenues not attributed to handsets, which mainly include IoT and internet services, grew 68% YoY to RMB 3.2 billion. Their contribution to group revenues now stands at 6.5%. This is due to new products in the wearables, TWS, notebook and TV categories. But more importantly, Transsion’s ‘Matrix of Internet Products’ became meaningful growth engines. Apps under the Transsion umbrella saw installations increase 240% YoY, with three apps – Phoenix, Boomplay and Scooper (with MAUs of 100 million, 68 million and 27 million respectively) – becoming main gateways to the internet for African users. User and eventually revenue growth from apps will become ever more important factors in Transsion’s future strategy, particularly in Africa, as its handset business will inevitably hit road bumps in the future.
Transsion IoT & Internet Services Analysis
Source: Transsion Group Financial Statements
Transsion毛利率的规范化decreased to 21.3% for the year, after staying above 23% for the first three quarters of 2021. There were significant cost pressures in the second half of the year, especially due to supply chain disruptions and component shortages. We expect these issues to gradually ease in 2022 as the supply and demand dynamics in the semiconductor industry improve, and supply chains become more resilient to shocks. However, foreign exchange fluctuations and inflationary pressures in key markets will be the new destabilizing factors for the company, as risks shift from the supply to the demand side in the wider global handset market.
Transsion handset sales, profit continue to improve despite cost pressures
November 24, 2021
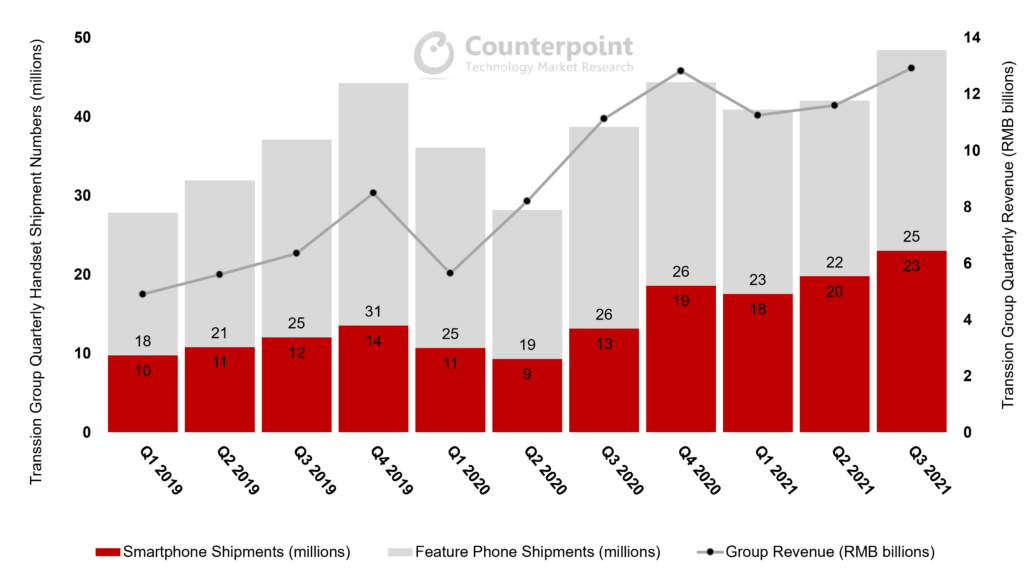
Transsion Holdings reported Q3 2021 results with revenues up 16% YoY and net profit up 33% YoY. These positive results were driven once again by further pivoting to smartphone sales, especially in the core African market. According to Counterpoint Research’sMarket Monitorservice, cumulative Transsion smartphone shipments surpassed 20 million units for the first time ever, coming in at 23 million. This represents a growth rate of 75% YoY.
Transsion Group Handset Shipment and Revenue Analysis
Sources: Counterpoint Market Monitor Service, Transsion Group financial statements
While feature phone shipment growth moderated in Q3 2021, the bulk of Transsion’s revenue growth was driven by smartphones. Heading into the Q4 holiday shopping season and 2022, we may see Transsion’s smartphone shipments overtake feature phones for the first time.
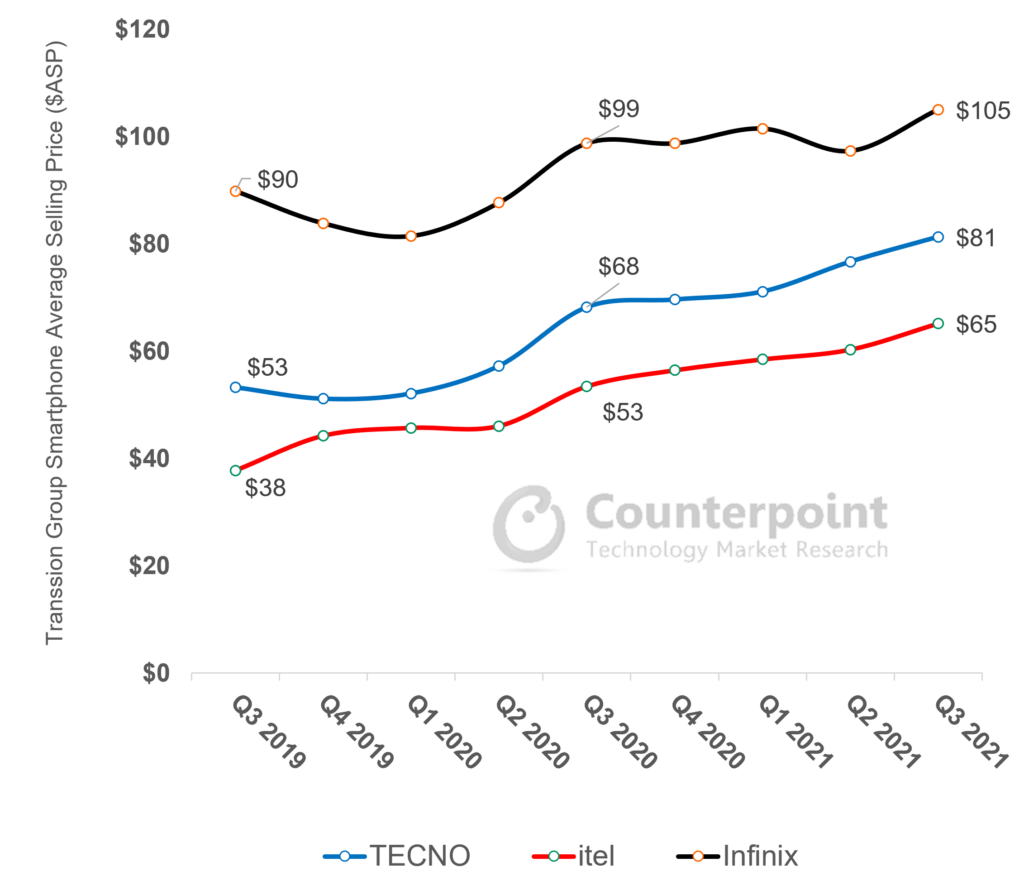
Over the past couple of years, as Transsion smartphones penetrated more markets, the average selling price (ASP) saw a noticeable increase. While the ASP showed a mixed trend in the second half of 2019, it increased decisively during 2020 and is showing no signs of slowing down in 2021. Looking at Transsion’s brands closely, TECNO, itel and Infinix saw ASP increases of 56%, 43% and 29% respectively over the past 18 months. These point to positive consumer sentiment and changing perception of digital and mobile services. More consumers in emerging markets now recognize that a decent smartphone is an important component of their daily lives.
Transsion Group Smartphone Average Selling Price ($)
Source: Counterpoint Handset Model Sales Service
Transsion毛利率的规范化increased to 25.3% in Q3, compared to 25% in Q2 and 23% in Q1. The company managed to navigate the ongoing component shortages well and was able to pass upstream cost increases to consumers. Selling, General & Administrative (SG&A) expenses and financing costs dropped as well. Furthermore, ventures outside sub-Saharan Africa, including in higher value markets in Southeast Asia and the Middle East, contributed to higher profit margins. Profitability may increase further as the supply chain situation stabilizes in 2022.
Smartphone Sales and Profitability Double Boost as Company Diversification Efforts Gather Pace
September 30, 2021
Transsion Holdings continued to see strong performance in H1 2021 with revenues and net income growing 65% and 59% YoY respectively, driven primarily by surging handset sales in its home market Africa, as well as successful ventures in other developing countries. According to Counterpoint Research’sMarket Monitor service, cumulative Transsion smartphone shipments in H1 2021 reached a record high of 37.3 million, taking the company’s share in the global smartphone market to 5.5% from 3.5% a year ago.
Counterpoint Research – Market Monitor Service
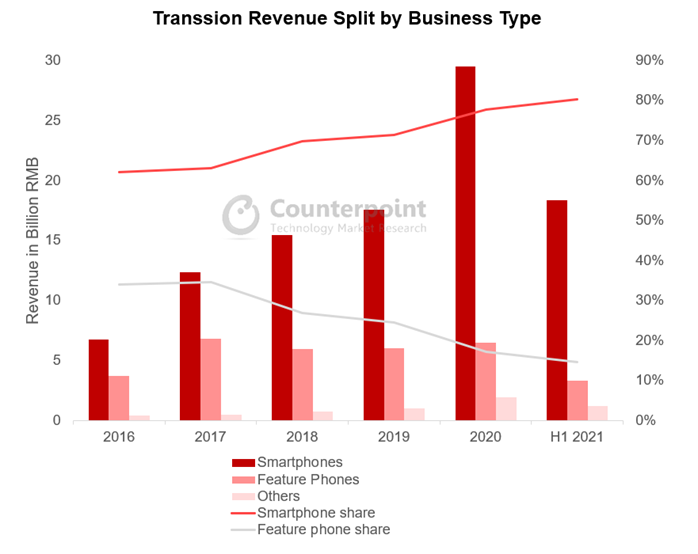
Looking at Transsion’s overall product strategy, we can see that it is shifting materially from feature phones to smartphones in response to market changes. In 2019, 33% of the company’s handsets were smartphones, but in the latest quarter this number has gone up to 47%. In the company’s latest earnings release, smartphones account for over 80% of its revenues, a record high.
Transsion financial report, Counterpoint Research analysis
Commenting on Transsion’s commitment to smartphones,Senior Analyst Yang Wangsaid, “Transsion is rapidly transforming and upgrading its product portfolio. The move is driven by the accelerating demand for internet-capable phones in itshome market Africa, where the COVID-19 pandemic showed the value of the internet to consumers who were forced to stay at home. The region’s internet and mobile money services are also gathering steam along with a significant drop in data costs. While all OEMs stand to benefit from the consumer’s shift, Transsion gains the most as its distribution and pricing strategies are most ready to tap into new consumer clusters, which previously did not consider buying a smartphone.”
Counterpoint Research – Market Monitor Service
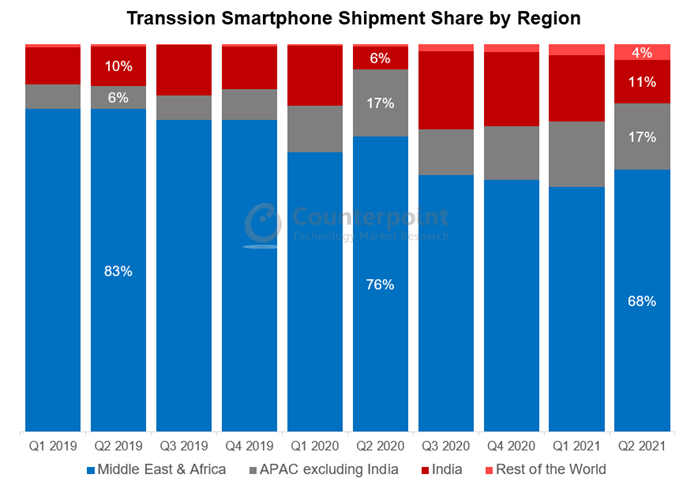
Apart from product transformation, the other significant shift in the Transsion strategy is geographical diversification. Compared to two years ago, Transsion’s share of smartphone shipments in the Middle East and Africa (MEA) region has dropped from 83% to 68%. On the other hand, shipments have increased rapidly in APAC countries such as India, Pakistan, Bangladesh, Indonesia and Thailand.Indiaspecifically has been the growth engine for Transsion, with shipments almost reaching 20% of the company’s global total in H2 2020, before the Delta wave halted the progress.
Commenting on Transsion’s moves in India,SeniorAnalyst Prachir Singhsaid, “Transsion brands, especially TECNO, have been focusing on a hybrid channel strategy in India, with an increased emphasis on online channels. This was executed with great success as Transsion brands contributed to 7% of the online smartphone market in India in Q2 2021, compared to 2% in Q2 2020. TECNO’s online smartphone shipments grew almost 20x YoY in Q2 2021, while itel increased its online share by launching online exclusive models like the Vision 1 Pro and A47. From a product positioning point of view, Transsion brands have been focusing on providing specs like higher display size, multi-camera capability and bigger battery, which are the top spec preferences for consumers in the sub-$150 segment.”
Going forward, Transsion’s fundamentals are expected to remain solid, as it continues to hold enormous clout in its Africa home market. Smartphone penetration will gradually expand, with new users continuing to be brought into the internet world. On the other hand, Chinese brands such as Xiaomi, OPPO and vivo are strengthening their market penetration efforts in certain African markets to address the medium-range segment (<$200). This price band is above Transsion’s typical playing field, so the newcomers are unlikely to affect its market share in the short term. However, we have seen in recent years Transsion’s effort to produce more premium phones and enter the <$200 price band. Therefore, there may be a time in the future when Transsion competes directly with the likes of Xiaomi, OPPO and vivo.
The Saudi Arabia smartphone market was among the few to record YoY growth in Q1 2023.
Even as many economies struggled in 2022 amid macroeconomic and geopolitical pressures, Saudi Arabia was bolstered by its highest oil revenues in decades, all-time-low unemployment rates, all-time-high non-oil economic activity and strong private consumption.
Among OEMs, Samsung and Apple continued to take over half of the total smartphone shipments in Q1 2023, with Samsung taking the #1 spot.
We expect the Saudi Arabia smartphone market to continue its growth momentum in 2023, with annual shipments likely to grow in low single digits.
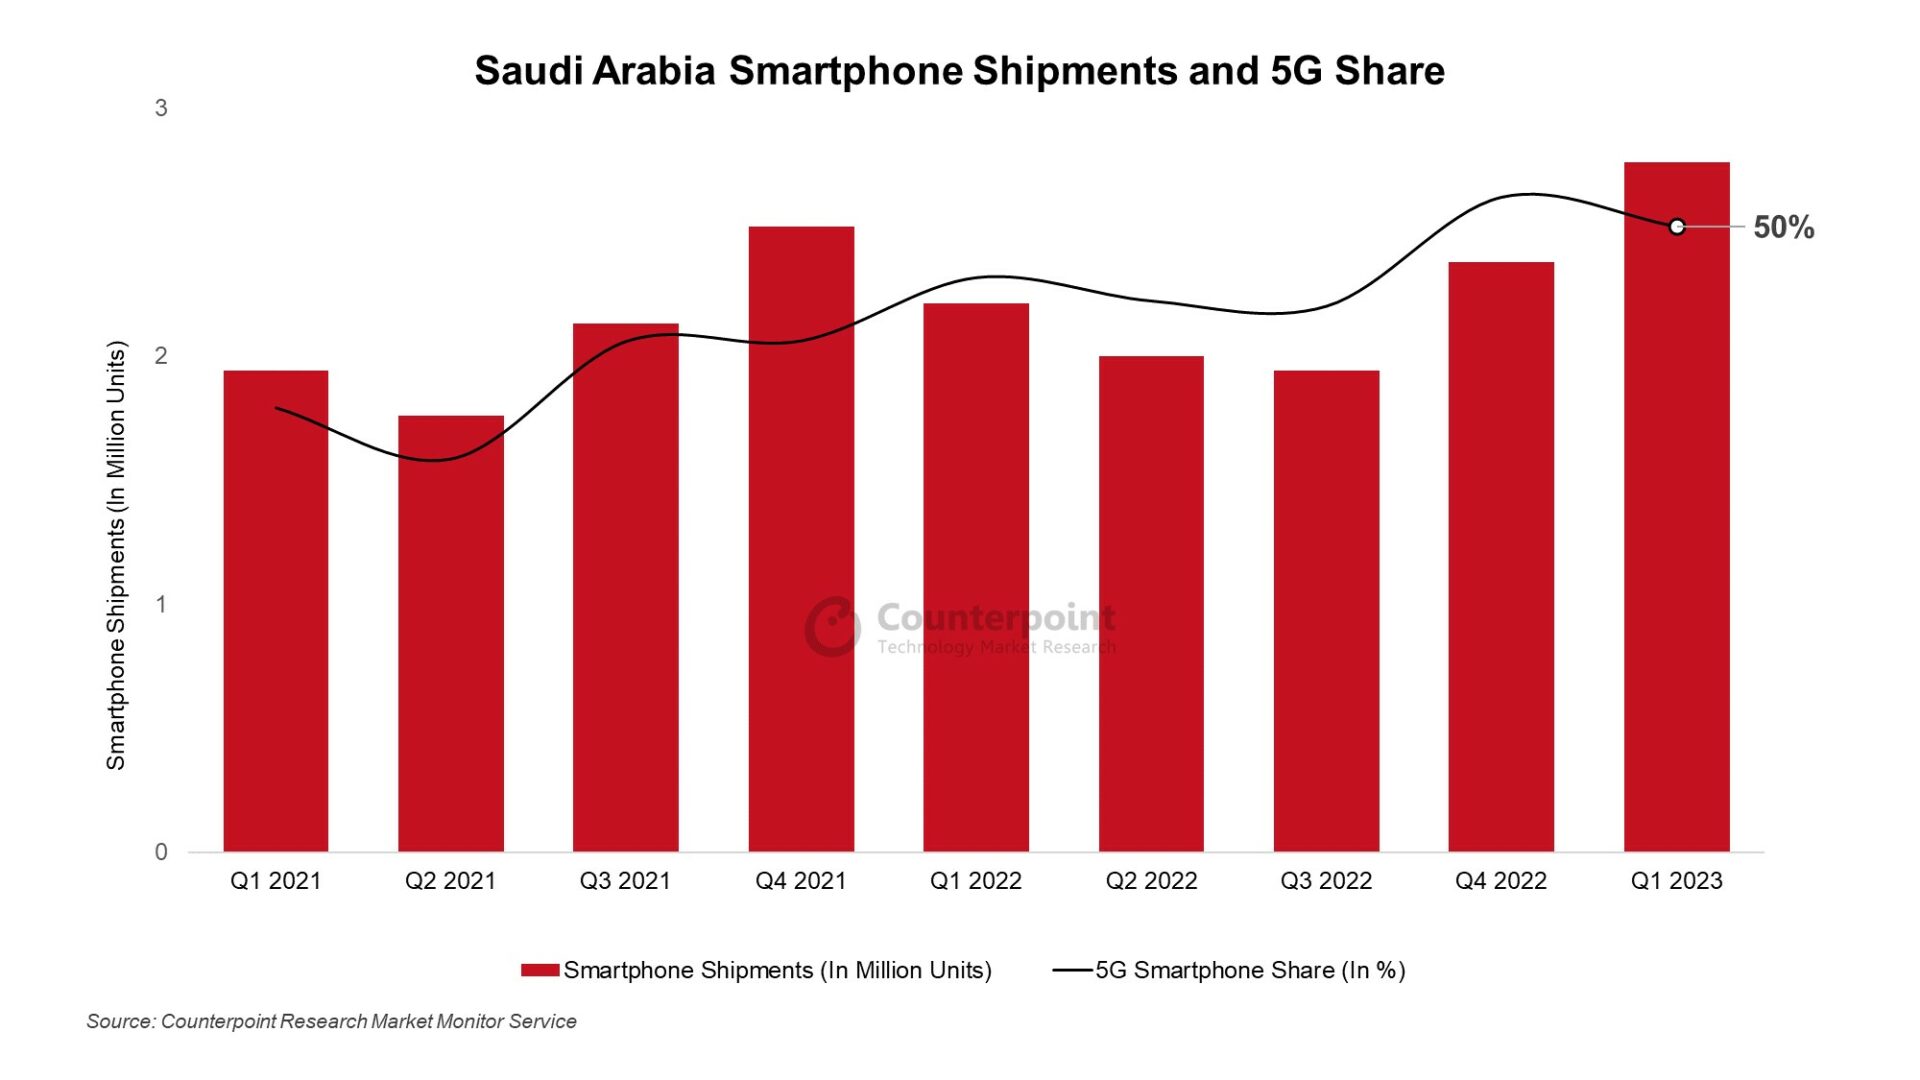
The Saudi Arabia smartphone market was among the few to record YoY growth in Q1 2023, with shipments growing 26% YoY largely due to strong macroeconomic fundamentals, accelerating digitalization, and growing device financing options. In QoQ terms, the shipments grew 17% as OEMs filled channels for the Easter and Ramadan sales season, towards the end of the quarter.
Growth drivers
As manyglobal economies struggled in 2022amid macroeconomic and geopolitical pressures, Saudi Arabia was among the few to buck the trend. Bolstered by its highest oil revenues in decades as global oil prices soared, Saudi Arabia was the fastest-growing economy in 2022, with all-time-low unemployment rates, all-time-high non-oil economic activity and strong private consumption. PoS (Point of Sale) transactions, e-commerce activity and digital payments have also been on the rise in Saudi Arabia, all pointing to growing digitalization and private consumption. Some of the market momentum at the end of 2022 was carried into Q1 2023, especially after the economic boost provided by the FIFA World Cup in Qatar and the year-end and holiday season of Q4 2022.
Saudi Arabia Smartphone Shipments and 5G Share – Q1 2021 to Q1 2023
While the feature phone to smartphone migration has slowed down in Saudi Arabia, a growing digital economy and an aspirational customer have become key growth drivers. Commercial and private 5G use is also increasing in the country, pushing 5G smartphone sales. 5G technologies are a key part of Saudi Arabia’s digitalization and growth push under the Vision 2030 plan. The country has partnered with major 5G infrastructure players likeHuaweiandEricsson, and5G networksare now available in most major cities, covering around 80% of the country’s population. Saudi Arabia has also been hailed as a 5G pioneer in the region in terms of coverage, speed and consistency. 5G smartphone share remained above half of total smartphone shipments for the second consecutivequarterin Q1 2023 and is likely to grow further in 2023.
Competitive landscape
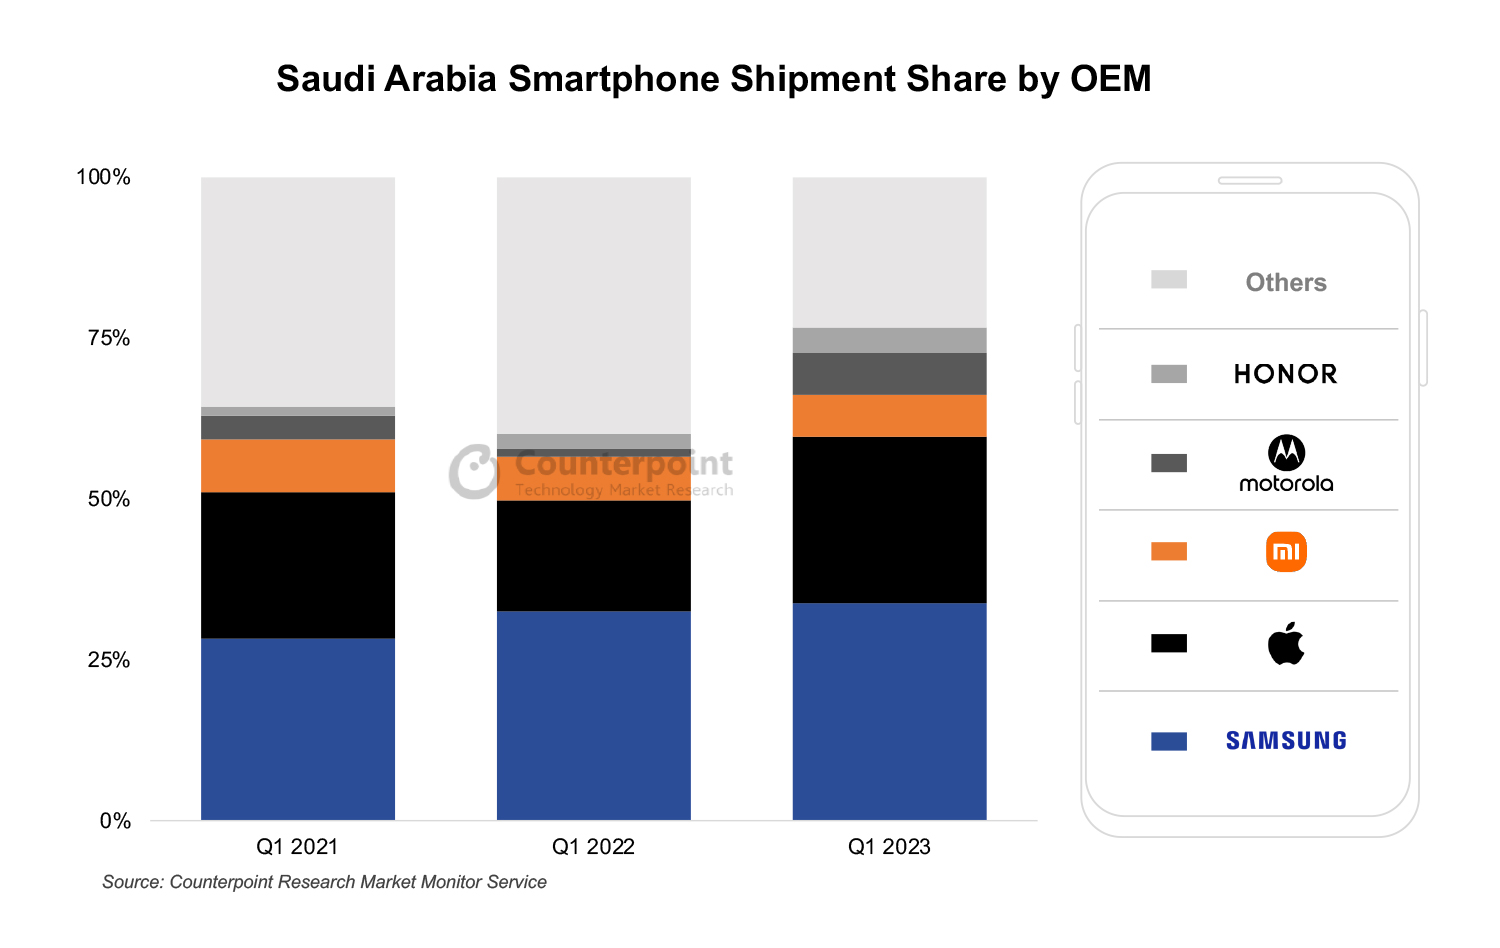
Saudi Arabia Smartphone Shipments by Top 5 OEMs for Q1 2021, Q1 2022, Q1 2023
Among OEMs, Samsung and Apple continued to take over half of the total smartphone shipments in Q1 2023, with Samsung taking the #1 spot. Xiaomi and Motorola were distant third, with HONOR rounding out the top five for Q1 2023.
Samsunggrew YoY as its supply normalized in the region. The brand’s 5G models have been leading growth, especially the new affordable 5G M-series and A-series iterations. The Galaxy M53 was the best-selling Android device in the country in Q1. Samsung’s newest flagshipGalaxy S23联赛s was shipped slightly earlier than theS22 series in 2022to meet the pre-order demand triggered by aggressive marketing and promotions in the country, with most channels and offline stores participating.
Apple’s智能手机shipments nearly doubled YoY led by the popularity of itsiPhone 14 series, especially thePro versions, and as older models became affordable and available. Apple reached its highest-ever Q1 shipment share in Saudi Arabia in 2023. The brand has greatly benefitted from therise of financing options, like the ‘Buy Now, Pay Later’ model, in Saudi Arabia, making its devices accessible to a greater demographic. Besides, a rising mean wage and stable exchange rates increased the average Saudi Arabian consumer’s purchasing power in 2022. iPhones took four of the top five spots in the bestseller list for Q1 2023, with the iPhone 14 Pro coming out on top.
WhileXiaomi’sshipments grew YoY in Q1, it lost share marginally, as Motorola and HONOR gained share driven by new launches. Xiaomi has been able to maintain share largely due to its broad portfolio across price bands, innovative marketing strategies, and a strong presence across both offline and online channels.
Motorolahas been gaining share, led by its offerings in the $150-$249 price band, particularly its G series, which accounted for nearly three-quarters of its total sales in Q1. Motorola has benefitted from improved product availability, especially for new launches, and strong brand pull, especially for middle-income customers looking for upgrades to their lower-segment devices.
HONORwas among the fastest-growing brands in Q1, with its shipments more than doubling YoY. HONOR’s growth is largely due to focused expansion efforts, aggressive launch campaigns and an attractive mid-tier to high-end portfolio. HONOR has also benefitted from utilizing Huawei’s earlier distribution and channel relationships. The HONOR 70 and the X series were the top volume drivers for the OEM in Saudi Arabia for Q1 2023.
Smartphone sales grew YoY across all price bands in Q1 2023 but declined QoQ largely due to seasonality. All price bands except thepremiumband (≥$600) lost share YoY as consumers moved up the price bands. But thepremiumband was the fastest-growing band in Q1, led by Apple and Samsung. Apple captured around 85% of the total premium smartphone sales in Q1. The mid-tier ($100-$249) remained the largest price band in Saudi Arabia, capturing nearly half of the total smartphone sales in Q1, with Samsung and Xiaomi taking the top spots in the price band. Thelower (<$100) segmentgrew YoY but, like other non-premium segments, lost sales share during the same period, as customers continued to buy higher-ASP devices with improving affordability and rising aspirations.
Market outlook
We expect the ASP of smartphones sold in Saudi Arabia to continue to rise in 2023, as wage rates improve, financing options become more accessible, and customers move towards better devices. Currently, Apple and Samsung remain best equipped to capture more share of the aspirational Saudi Arabia smartphone market, but the quest for the #3 spot continues. While Xiaomi remains comfortably in the #3 spot, other Android OEMs have been mounting pressure with bolder promotions and marketing activities and aggressive launch strategies. Motorola, HONOR and Transsion Group brands Infinix and TECNO are likely candidates outside the top three to capture market growth.
Going forward, we expect the Saudi Arabia smartphone market to continue its growth momentum, with annual shipments likely to grow in low single digits in 2023. Increasing 5G use, ramping up of digitalization, greater access to financing options and growing aspirations of customers are expected to drive growth.
Note:
ASP & Priceband Analysis done using Wholesale Prices
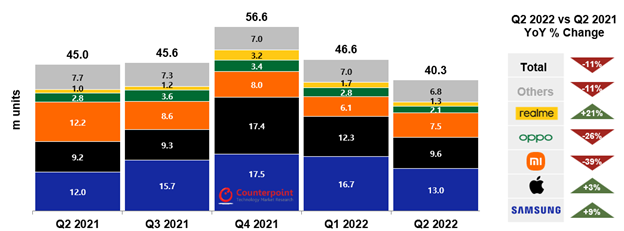
The Europe smartphone market declined by 11%YoY and 13% QoQ to 40 million units in Q2 2022, the lowest quarterly total since Q2 2020.
A deteriorating macro climate and geopolitical uncertainly were the main constraints on demand
Samsung and Apple managed to grow shipments and market share YoY, although both declined QoQ due to their withdrawal from the Russian market.
Xiaomi and OPPO*, hit by China lockdowns, suffered double digit YoY declines in their respective shipments.
realme continued its European expansion with double digit YoY shipment growth in Q2 2022
London, Boston, Toronto, New Delhi, Beijing, Taipei, Seoul – August 2, 2022
欧洲是智能手机市场下降了11%r-on-year in Q2 2022, according to the latest research fromCounterpoint Research’s Market Monitorservice, registering the lowest quarterly total since the early part of the COVID-19 pandemic. A deteriorating economic climate and ongoing geopolitical uncertainty continued to hamper bothEurope’sand theworld’srecovery from the COVID-19 pandemic and chip shortages.
2022年第二季度欧洲智能手机出货量和增长
Source: Counterpoint Research Quarterly Market Monitor, Q2 2022.
Note: OPPO includes OnePlus since Q3 2021.
Counterpoint Research’sAssociate Director, Jan Stryjaksaid, “it was a mixed bag of results in Q2 2022, and year-on-year comparisons mask complex market dynamics. Much has changed in Europe compared to last year and even last quarter, both from an industry and macro perspective.”
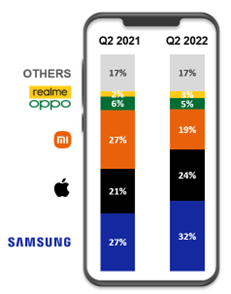
Q2 2022 European Smartphone Shipments Share
Source: Counterpoint Research Quarterly Market Monitor, Q2 2022.
Note: OPPO includes OnePlus since Q3 2021.
Samsung remained Europe’s number one vendor and grew both shipments and market share over the year, but this was mostly thanks to Q2 2021 being Samsung’s lowest European shipments total in over a decade due to factory shutdowns in Vietnam. Compared to Q1 2022 though, Samsung’s European shipments dropped by almost a quarter due to its withdrawal fromRussia.
Applealso grew both shipments and market share year-on-year in Europe – largely due to the launch of the 5G-enabled iPhone SE – but it declined drastically quarter-on-quarter for the same reason as Samsung.
Xiaomi declined from a peak in Q2 2021, which was its best quarter in Europe ever, having been hit particularly hard by supply issues. However, Xiaomi made the most of Samsung and Apple’s Russian withdrawal and gained significantly quarter-on-quarter, especially in Eastern Europe.
Rounding out the top five, OPPO was hit by supply and manufacturing issues inChina, whilerealmecontinued its impressive performance in Europe with double digit year-on-year shipment growth (although growth has stalled a bit in recent quarters).
Commenting on the outlook for the rest of the year, Stryjak added “the situation in Europe unfortunately remainsbleak. Many countries in Europe are slipping closer to recession, and domestic political tensions in numerous countries beyond Russia and Ukraine are rising, for example in France, Germany and the UK. We remain hopeful, though, that the bottom has been reached and the trajectory should turn upwards soon, but the recovery will likely be long and slow.”
Background:
Counterpoint Technology Market Research is a global research firm specializing in products in the TMT (technology, media and telecom) industry. It services major technology and financial firms with a mix of monthly reports, customized projects and detailed analyses of the mobile and technology markets. Its key analysts are seasoned experts in the high-tech industry.
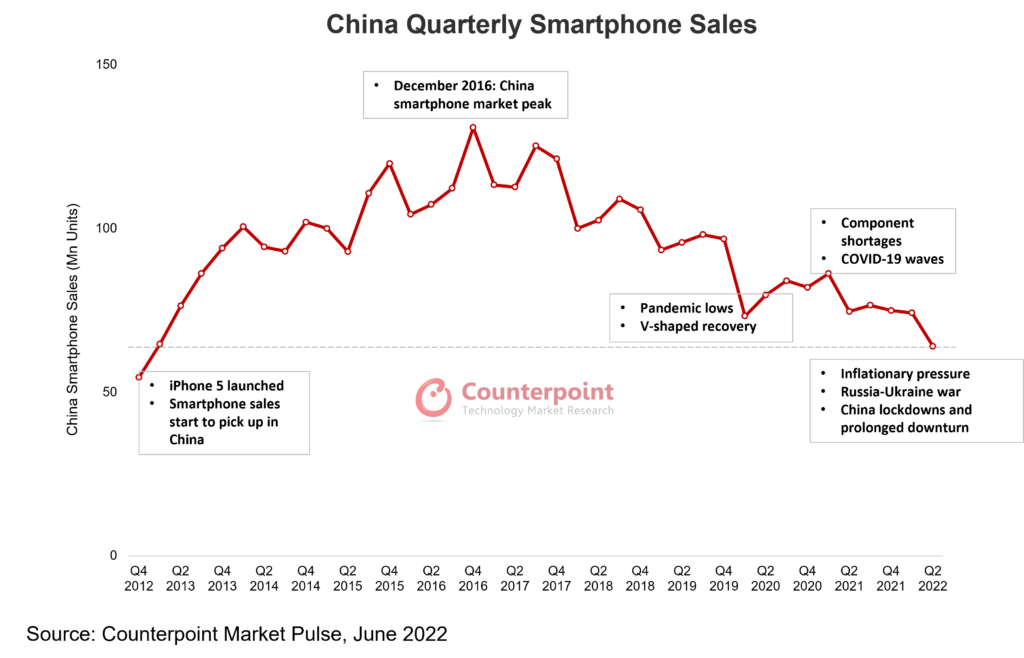
China’s smartphonesales hit a fresh low in Q2 2022 to reach less than half of the sales of the historical peak in Q4 2016.The last time the sales were lower than this point was nearly a decade ago in Q4 2012, when theiPhone5 was introduced.
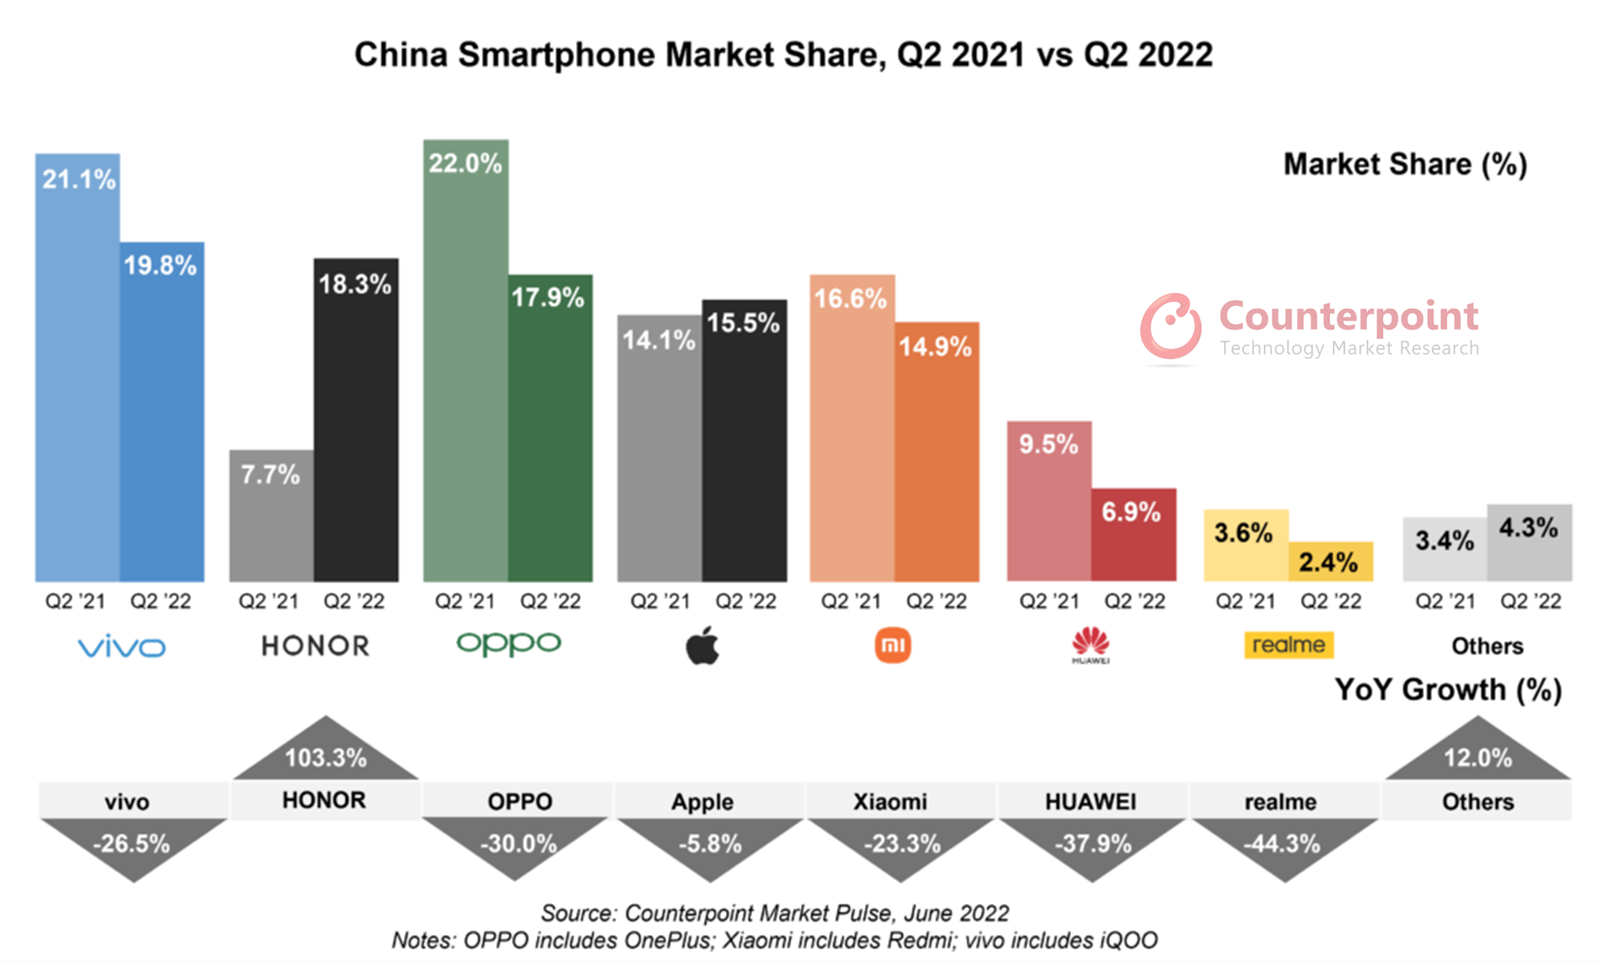
Capturing a 19.8% share,vivoretained its first place in Q2 2022, followed byHONOR(18.3%) andOPPO(17.9%).
Apple took the fourth position with a 15.5% share.
HONORdoubled its sales YoY and was the only major brand to show a YoY increase. realme’s sales dropped 44.3% YoY.
Beijing, New Delhi, Hong Kong, Seoul, London, San Diego, Buenos Aires – July 26, 2022
China’s smartphone sales decreased 14.2% YoY in Q2 2022, according to Counterpoint’sMarket Pulsereport. The quarter’s volumes were 12.6% lower than the level seen during the severe pandemic-hit Q1 2020, and less than half of the historical peak of Q4 2016.The last time the sales were lower than this point was nearly a decade ago in Q4 2012, when the iPhone 5 was introduced.
Commenting on the Chinese smartphone market’s performance,Senior Analyst Ivan Lamsaid, “China’s economy merely grew 0.4% YoY in Q2 2022, lower than the market expectation of 0.8%-1%. During this period, major cities across China, including financial and manufacturing hub Pan-Shanghai, went through full or partial lockdowns. The hardest hit was the services sector, which fell into contraction territory, from 4% YoY growth in the first quarter to 0.4% in the second quarter. The deepest decline occurred in April’s consumption data, with total retail sales of consumer goods falling 11.1% YoY. Weak consumer sentiment combined with the high smartphone penetration rate in China resulted in poor Q2 performance of smartphone sales.”
Lamadded, “Smartphone sales rose during the 618 e-commerce promotion period and with the gradual lifting of lockdowns in major cities. However, the sales during this promotion period were still down around 10% YoY. Given the low sales volume number for Q2 2022, we expect smartphone sales to rebound in the next quarter. At the same time, with the demand continuing to be underwhelming due to weak consumer sentiment and lack of new innovations, it is going to be very hard to make the situation better in the second half when compared to last year.”
On key vendors’ performance,Research Analyst Mengmeng Zhangsaid, “During the quarter,vivomaintained its leadership. The mid-to-high-end S12 series helped vivo grab a good share in the $250-$399 segment. Sub-brand iQOO also received positive market feedback, especially from younger customers.”
Zhangadded, “HONORcontinues its great comeback by expanding its offline presence. With the lockdowns hitting major cities, HONOR’s coverage in lower-tier cities, which saw fewer lockdowns, helped the brand steer through the turbulence in Q2 2022. It may be noted that HONOR managed to take share from all the leading Chinese brands, including Huawei, during the quarter. It is time for OPPO and vivo, known as the “offline channel kings”, to take HONOR seriously.”
Apple still saw a comparatively good performance thanks to the shining sales of the iPhone 13 series in Q2 2022. Xiaomi saw a sales pick-up in June driven by the models like the Redmi K50 and Note 11 series.Research Analyst Archie Zhangsaid, “The increasing 5G penetration in China allowsXiaomito tackle the shortage of 4G/LTE SoCs. But though its products can be seen on the shelves of more than 10,000 offline shops, Xiaomi is still grappling with sluggish sales.”
Despite the discouraging performance in Q2 2022, major Chinese OEMs continued efforts to strengthen their positions in the high-end segment. HONOR andXiaomihave been benchmarking their high-end models against Apple by incorporating several iPhone features. OPPO and vivo are also leveraging their newly launchedfoldablesto increase premium segment share. Commenting on the fast-growing new form factor,Lamsaid, “Major Chinese OEMs have not many options when it comes to penetrating the Apple-dominated premium segment. Foldable smartphone sales in the first half of 2022 have already surpassed that of 2021 with Huawei leading the segment, followed by Samsung and OPPO. We expect at least 4-5 new foldable models to be launched in the second half of 2022.”
Background
Counterpoint Technology Market Research is a global research firm specializing in products in the TMT (technology, media and telecom) industry. It services major technology and financial firms with a mix of monthly reports, customized projects and detailed analyses of the mobile and technology markets. Its key analysts are seasoned experts in the high-tech industry.
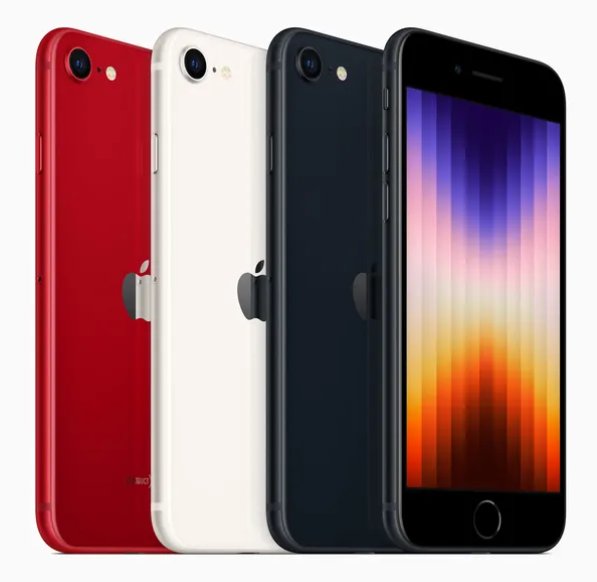
During its first event of 2022, Apple announced the launch of its newest iPhone SE. This is the third iteration of the iPhone SE, the first of which launched backin 2016and the secondin 2020. As expected, the newest addition to the iPhone family is 5G capable, an increasingly necessary feature at its price point.
The selling points
When the iPhone SE launched in 2020, 5G connectivity was still a rather limited feature due to the restricted reach of 5G networks. In the US, Apple’s largest market by revenue, 5G networks were limited to low-band spectrum that yielded meager improvements over LTE, or constituted isolated pockets of mmWave in a spattering of metro areas. That is no longer the case.T-Mobile’smid-band spectrum now covers over 230 million Americans, while Verizon’s C-band spectrum, launched earlier this year, now covers about 90 million. Similar expansions are taking place across the world and 5G connectivity is now expected for nearly all devices priced above $300 in markets like China, Western Europe, South Korea, Japan and the US. Besides, the cost of putting 5G components in a device has declined.
The iPhone SE 5G features Apple’s 5nm process A15 Bionic chip, also used in the iPhone 13 series and a significant step-up from the A13 Bionic chip used in the iPhone SE 2020. The A15 Bionic chip will also give the iPhone SE the most powerful processor in its price segment by a significant margin. This will be more than enough processing power for the day-to-day tasks that most users in this price segment engage in, while being able to handle more demanding tasks like gaming at an affordable price point. The updated chipset also ensures that iPhone SE users will have the processing power to get the most out of Apple’s features, including AR and XR, machine learning, and new features that will emerge in the next few years.
The drawbacks
Where the latest iPhone SE falls short is in camera features and design. The previous two launches of the iPhone SE played off the nostalgia that many consumers had for the classic iPhone design, home button and all. But this nostalgia may be wearing off as Apple recycles the same design for the third time with the iPhone SE 5G. Meanwhile, mid-tier Android devices now regularly feature 6.5” displays, multi-lens camera arrays and relatively thin bezels. The iPhone SE 5G still features just a single rear camera lens and the dated design of the iPhone 8, including a 4.7” display and chunky bezels. If Apple is trying to win Android users away, a design revamp seems due.
许多处于低度到中度的Android用户范围,结合nation of 5G connectivity and Apple’s latest silicon at an affordable price will lure them to the iOS ecosystem. But the dated design of the device and relatively mundane specs outside of the A15 Bionic chip may not generate excitement in markets like China where consumers are very conscious of specifications and look to get the best bang for their buck.
Conclusion
The US, Japan and Western Europe are likely to be the best-performing markets for the new iPhone SE due to their strong iOS installed base and the strong performance of previous iPhone SE devices. At the same time, the improved chipset and 5G connectivity may help Apple gain share in increasingly important markets like China and India.
有成千上万的低端Android用户the globe who aspire to own an iPhone but don’t have the resources to join the most premium ecosystem in the world. The launch of a powerful, 5G enabled and affordable iPhone SE amid an environment of rising ASPs may be enough to convince a significant number of Android users to make the switch.
A podcast discussing the launch of the iPhone SE 2020 can be accessedhere. For more insight on the latest iPhone SE launch, readhere.
Close to 30% of Indian smartphone users are now active on Glance, finds Counterpoint Research Study
Glance’s active user base reaches 163 million in India.
The active users base grew by 8% QoQ in Q3 2021.
Two-third of the active users came from the $100- $250 price band.
London, San Diego, Buenos Aires, New Delhi, Hong Kong, Beijing, Seoul – December 27, 2021
Lockscreen content platform Glance recorded 163 million active users as of Q3 2021, according toCounterpoint Research’s Quarterly Mobile Application Tracker. Glance’s active user base experiencedconsistent growthsince its inception. Its active user base, which now consists of 30% of India’s smartphone users, grew by 8% QoQ in Q3 of 2021.
Glance enables its users to access a wide range of content, including live interactive content, on their智能手机lockscreens. This content is curated from the top publishers and developers in India across categories such as sports, current affairs, fashion, travel, food, commerce, and entertainment.
Commenting on the development, Research Analyst Arushi Chawla said, “The lockscreen is the most visited real-estate on a smartphone. It is the first screen users see every time when unlocking their smartphone. Being present on this surface, Glance makes content discovery frictionless and improves the opt-in rate for interactive broadcasting, compared to any other in-app event features that require users to login. Glance’s recent foray into LIVE, interactive content has also helped it to differentiate itself as a platform and has helped boost its user engagement levels.”
Chawla added “As per our estimates, about a billion smartphones will be sold in next five years in India, which brings a huge opportunity for a content platform to expand using Hardware as a Distribution (HaaD) model. Being a multi-lingual, pre-installed application in many leading smartphone OEMs, it serves as a gateway to the latest content for many first-time smartphone users.”
Exhibit:Glance Active User Base, Q1 to Q3 2021
Source: Counterpoint Research Quarterly Mobile Application Tracker, Q3 2021
Glance’s active presence is highly prominent in the $100- $250 price segment. Where about two-third of the active users came from this price band. Upper-mid-and-affordable premium ($250 and above) also consists of about 20% of the Glance active userbase.
Glance continues to strengthen engaging ways to create stickiness on the platform. With the launch of Glance LIVE, and a rise in interactive, real-time content, Glance is progressively bringing newness in content delivery. Content from Roposo’s top creators onto the Glance lockscreen platform has increased the content uniqueness as well.
India is a price-sensitive and highly competitive market for OEMs. In many cases, it directly affects their operating margin and ability to maintain their market position. As the market dynamics are moving from hardware-level competition to providing an overall holistic experience, most of the OEM’s strategy will concentrate on maximizing the customer’s lifetime value. In such a scenario long-term loyalty and value creation will depend on providing differentiating over-the-top services. Content will certainly play a key role in developing brand stickiness.
Commenting on this, Senior Research Analyst Pavel Naiya said, “Glance has created a unique positioning by pioneering the use of lockscreen as an asset for content discovery and by launching live, interactive content. With more OEMs looking to build deeper, more long-term content strategies for users, the presence of a content platform like Glance on devices can add great value. Glance can also be deeper integrated as a feature or can be added as an additional system update to optimize its performance as the consumer preference evolves.”
Over the past year, Glance has expanded its user base beyond India and is currently also available on devices across Southeast Asia.
Methodology
Glance’s mobile application presence is calculated from our panel database of over a million smartphone active users. Model-level Glance penetration data and active user ratio were extrapolated to our monthly smartphone installed base data using various parameters such as brand, model, and price band to predict Glance’s active user base. We expect the results to have a statistical precision of +/- 5% at the confidence interval of 90%.
This is a sponsored survey to better understand the brand’s presence in the Indian smartphone market.
Background
Counterpoint Technology Market Research All Rights Reserved. Reproduction of this publication in any form without prior written permission is forbidden. The information contained herein has been obtained from sources believed to be reliable. However, we disclaim all warranties as to the accuracy and completeness of this report. Counterpoint shall have no liability for errors, omissions, or inadequacies in the information contained and any direct/indirect damages. All opinions and estimates herein are subject to change without notice.
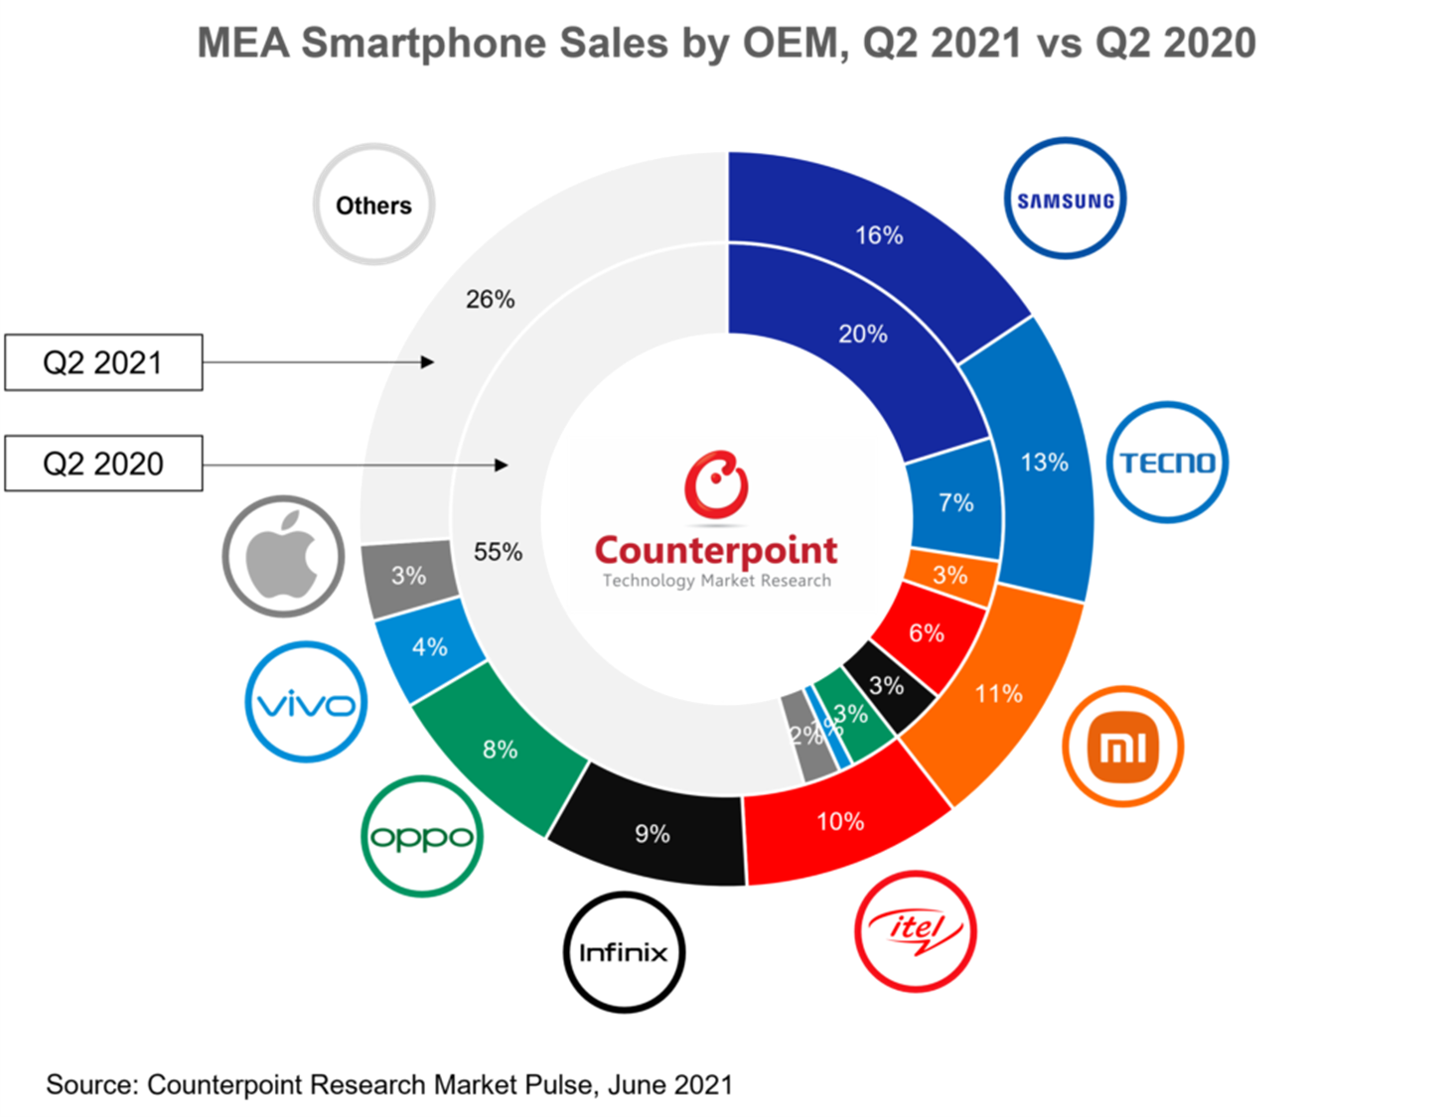
MEA smartphone sales grew 35% YoY during Q2 2021, making it the best Q2 on record.
Samsung continued to hold the top spot in the region by capturing a market share of 16%.
TECNO solidified its second position by capturing a market share of 13%.
New Chinese brands Xiaomi, OPPO and vivo have all made impressive gains, with the three capturing 23% market share in Q2 2021.
Boston, Toronto, London, New Delhi, Hong Kong, Beijing, Taipei, Seoul – August 5, 2021
Smartphone sales in the MEA (Middle East and Africa) region grew 35% YoY but declined 3% QoQ in Q2 2021, according to the latest research from Counterpoint’s Market Pulse service. This was the best second quarter ever in terms of unit sales. Smartphone demand has been strong throughout the first half of the year with economic rebound gathering pace and boosting employment levels and consumer sentiment. The gradual relaxation of coronavirus-related lockdown measures across the region, rapid vaccination in key Middle East markets, and a rebound in commodity prices have all helped the sales levels.
Zooming into the MEA region, Middle East smartphone sales retreated marginally by 0.8% QoQ while Africa dropped 3.9% QoQ. But looking at the YoY numbers, both regions have rebounded strongly, with the Middle East up 34% and Africa 36%.
Commenting on the overall market dynamics,Senior Research Analyst Yang Wangsaid, “Positive momentum from the end of 2020 has been maintained throughout the first half of the year, with the best Q1 and Q2 on record. Smartphones are becoming an integral part of daily life. COVID-19 has helped consumers discover many practical use cases that were not immediately obvious before the pandemic. While the economic and pandemic situation has improved, demand has been further driven by renewed competition from the new Chinese entrants, wider product availability at multiple price points, and continued channel penetration into previously untapped markets.”
Commenting on OEM dynamics, Wang further noted, “Samsungretained the top spot, but its market share slid by 4% points to 16% in Q2 2021. The company boosted market spending at the start of the year, leading to good performance in Q1. However, sales trended down in Q2 due to production disruption inVietnamfollowing COVID-19. We expect further difficulty in early Q3.”
“The Transsion brands, namelyTECNO,itelandInfinix, almost doubled their cumulative market share from 16% to 32%, as they continued to dominate the lower-priced segment in Africa while making successful entries in some Middle East markets. From a pricing point of view, some of Transsion’s market share in the sub-$100 segment has shifted upwards to the $100-$200 segment. This means itel, the incumbent in the ultra-affordable segment, lost some share to TECNO and Infinix, which make智能手机s with higher specs.”
“Xiaomi,OPPOandvivohave also made substantial gains thanks to aggressive entry initiatives in key Middle East and North Africa markets, and themisfortunes ofHuaweiandHONOR, whose cumulative quarterly market share shrunk to 2.2% from 8.2% a year ago.”
It should be noted that while there ismore competition than everamong the big brands, the Top 8 now account for 74% market share as compared to 52% a year ago. Smaller and local brands are finding it difficult to respond to the onslaught of big brands, which have the resources to add key distribution partners and bring more products to the market quickly. Additionally, smaller brands have been impacted by the全球半导体短缺far more than the bigger ones, whose scale has enabled them to get ahead of rivals in securing key components, widening product availability at multiple price points and applying flexible channel inventory management. Market consolidation is a phenomenon that has been observed in other more developed markets before, and we expect it to happen naturally in the MEA region too.
Looking toward the rest of the year, we expect consumer demand to remain robust, especially in some Gulf Cooperation Council (GCC) countries where vaccination progress is leading the world. This may lead to faster than expected resumption of international travel, which is a crucial driver for economic growth in the Middle East. On the other hand, Africa is currently undergoing the most severe COVID-19 wave on record. Governments, however, have not returned to the stringent lockdown measures seen in 2020. As a result, economic growth trajectories and consumer demand are expected to remain elevated.
Counterpoint Research’s market leadingMarket Pulseservice for mobile handsets is available for subscribing clients.
Feel free to contact us at press(at)www.arena-ruc.com for questions regarding our in-depth research and insights, or for press enquiries.
Counterpoint Technology Market Research is a global research firm specializing in products in the TMT (technology, media and telecom) industry. It services major technology and financial firms with a mix of monthly reports, customized projects and detailed analyses of the mobile and technology markets. Its key analysts are seasoned experts in the high-tech industry.
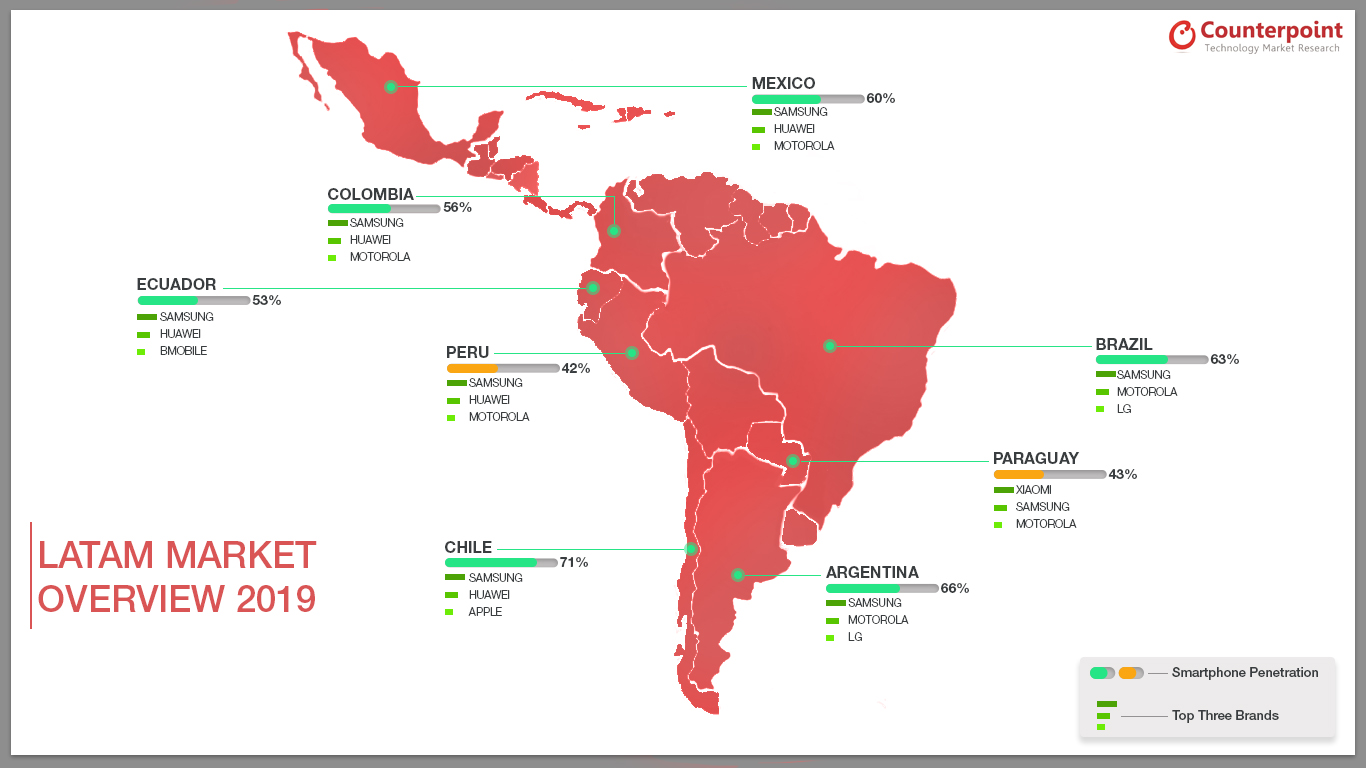
In 2019, the Latin America region represented only 10% of the global smartphone market. Nevertheless, it includes Brazil and Mexico, which are both among the top ten biggest markets worldwide. These two countries now have similar smartphone usage penetration, but they have quite different dynamics. Open distribution channels account for 80% of Brazil’s market. While in Mexico, 80% of the market is operator-driven.
LATAM countries have various levels smartphone penetration. Chile and Argentina have the highest, while Peru and Paraguay have the lowest. The varying maturity levels and local regulations largely dictate the competitive landscape:
BrazilandArgentinaboth require local manufacturing/assembling. It is a complicated process to set up local manufacturing, so only a few brands manage to do so, which makes these markets highly concentrated brand wise the same three brands represent more than 80% of the market. In both countries, Samsung has more than 40% share. Motorola is a distant follower and LG continues as #3. LG has been losing share in many other markets, but it enjoys a competitive advantage of local manufacturing in these countries.
Mexico: Samsung leads the market, but Huawei is a close contender. So much so that during two months in 2019, it overtook Samsung, making Mexico Huawei’s biggest market in the region. The battle for supremacy accelerated the replacement rate and increased smartphone penetration. Motorola is a solid #3.
Peru:the top 3 brands represent only 65% of the market. It is one of the most brand diverse markets in LATAM. It also has high feature phone penetration. Samsung and Huawei lead the market, while Motorola is a distant third. Peru has one of the lowest smartphone usages in LATAM, mainly because of the low 4G LTE coverage.
Chileis the most mature market in the region. It has LATAM’s highest smartphone penetration, rate of replacement and ASP. It is still an operator driven market, so brands need to have operator approval to succeed. Although it is a small market, it is among Apple’s top 3 market in LATAM. Samsung leads the market. Huawei’s performance was impacted by the US trade ban.
Ecuadoris the smallest market in this infographic, but withhigh growth potential. 3G smartphones are still relevant, partly because of the price of the smartphone, partly due to the limited coverage of the 4G network. Samsung and Huawei lead the market. Bmobile, a local brand, is a distant #3.
Colombiais the third biggest market in LATAM. Samsung is the absolute leader. Huawei was challenging Samsung leadership in the market during Q1 2019. However, the trade ban imposed by the US government highly impacted Huawei causing a loss of share to Samsung and Motorola.
Samsung was the absolute leader in all the major market in LATAM in 2019. Motorola was a distant number two that excelled in Argentina and Brazil. Huawei was a strong number three, but its performance was impacted during the second half of the year.
The infographic is a high-level overview of the data we track in our quarterlyMarket Monitor Service.
Chinese OEMs continues to gain traction in the region
New Delhi, Hong Kong, Seoul, London, Beijing, San Diego, Buenos Aires –
November 23st, 2018
According to the latest research from Counterpoint’s Market Monitor service, the Latin American (LATAM) Smartphone market has declined by more than 7% YoY due to economic uncertainty in four out of the six major countries in LATAM. Colombia, Brazil and Mexico’s markets were affected by presidential elections. These elections brought uncertainty to the economy and hence altered consumer purchasing behavior.
Commenting on the Latin American market development, Counterpoint’s Senior Analyst, Tina Lu, highlighted, “The replacement rate of local consumers is noticeably slowing. The cost of purchasing a new smartphone is a major investment for many consumers and, in most cases, they pay for their devices in 18 or 24 monthly installments. There is, therefore, a strong desire to make the smartphone last longer than the installment payment period. This change in user behavior has also brought a new level of importance to after-sales services. This has knock-on benefits in driving more business to companies providing after-sales service and refurbished smartphones”.
评论供应商表现,Parv沙玛,再保险search Associate, noted: “Following the overall market decline, the sale of all top-selling brands in volume terms apart from Huawei, have also decreased. Huawei has once again recorded strong growth of 37% YoY, and 10% sequentially. Huawei has been driving volume, in its biggest market, Mexico, with a two for one mix between high and low-price band devices. Huawei is gaining brand preference as its reputation for offering excellent quality products widens.”
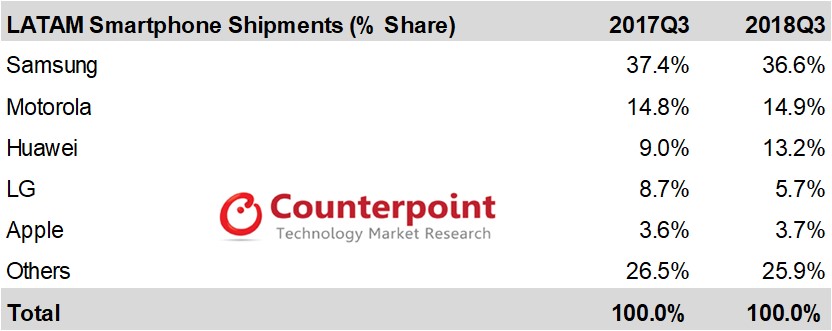
Source: Counterpoint Research Market Monitor Q3 2018
Samsung remains the absolute leader in the LATAM market. However, it lost around 1% share.
Samsung’s unit volume decline came mostly from Argentina, Chile and Brazil. Argentina’s market contracted by more than 40% YoY.
Motorola managed to retain its share, despite its decision to gradually decrease the volume of its bestselling C-series models and in the face of stiff competition from other Chinese brands.
Motorola grew in markets which were traditionally a challenge for it, such as Colombia, where it managed to achieve more than 50% YoY growth by increasing its share with local operators.
Huawei has double-digit growth in most of the region’s markets in which it operates. The one exception was Argentina where its volume reduced by more than a quarter YoY due to the company’s decision to outsource sales and distribution – a process that is not yet finalized.
LG’s business has been the most impacted. LG remains in the top three brands in Brazil, the largest market in LATAM, but it was not enough to offset a sharp drop in most other markets in the region.
墨西哥是唯一的国家,在拉丁美洲,包括ded in the first round of the latest iPhone launches. In all the other countries, Apple launched its latest iPhone models between October and November.
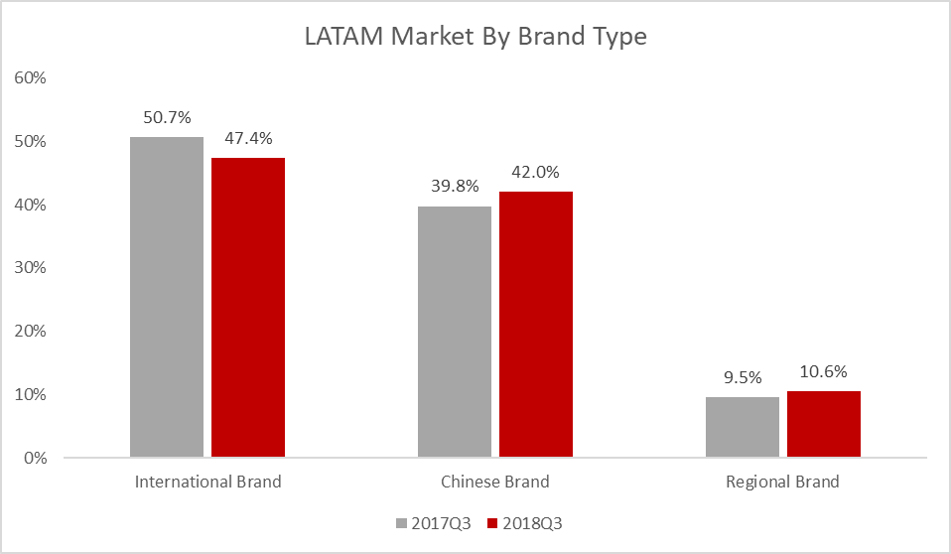
Exhibit 2: Latin America Brands Origin Variation 2017 Q3 vs 2018 Q3
Source: Counterpoint Research Market Monitor Q3 2018
International brands still dominate the LATAM smartphone ecosystem, Samsung is the best-selling brand in this group.
Although some Chinese brands such Huawei and Xiaomi enjoyed strong performances, the Chinese brands’ group had only around 2% growth, offset by the decline of other Chinese brands such as Alcatel, Lenovo and ZTE.
Regional brands grew by 1% driven by the increasing numbers of local brands that managed to enter the distribution channel of most LATAM’s carriers.
Brazilian local brands such as Multilaser or Positivo also drove the growth of these regional brands.
Chinese brands are expected to grow in the LATAM region, but not massively until 2020 as two of the biggest LATAM markets, Brazil and Argentina will continue to effectively be closed to direct imports in 2019.
LATAM’s overall market will likely return to growth in 2019. Partly due to an easy comparison with a depressed 2018 and because many of the events that have caused the slowdown in 2018 will have passed.
The comprehensive and in-depth Q3 2018 Market Monitor is available for subscribing clients. Please feel free to contact us atpress(at)www.arena-ruc.comfor further questions regarding our in-depth latest research, insights or press enquiries.
In order to access Counterpoint Technology Market Research Limited (Company or We hereafter) Web sites, you may be asked to complete a registration form. You are required to provide contact information which is used to enhance the user experience and determine whether you are a paid subscriber or not. Personal Information When you register on we ask you for personal information. We use this information to provide you with the best advice and highest-quality service as well as with offers that we think are relevant to you. We may also contact you regarding a Web site problem or other customer service-related issues. We do not sell, share or rent personal information about you collected on Company Web sites.
How to unsubscribe and Termination
You may request to terminate your account or unsubscribe to any email subscriptions or mailing lists at any time. In accessing and using this Website, User agrees to comply with all applicable laws and agrees not to take any action that would compromise the security or viability of this Website. The Company may terminate User’s access to this Website at any time for any reason. The terms hereunder regarding Accuracy of Information and Third Party Rights shall survive termination.
Website Content and Copyright
这个网站是对位的财产和我s protected by international copyright law and conventions. We grant users the right to access and use the Website, so long as such use is for internal information purposes, and User does not alter, copy, disseminate, redistribute or republish any content or feature of this Website. User acknowledges that access to and use of this Website is subject to these TERMS OF USE and any expanded access or use must be approved in writing by the Company. – Passwords are for user’s individual use – Passwords may not be shared with others – Users may not store documents in shared folders. – Users may not redistribute documents to non-users unless otherwise stated in their contract terms.
Changes or Updates to the Website
The Company reserves the right to change, update or discontinue any aspect of this Website at any time without notice. Your continued use of the Website after any such change constitutes your agreement to these TERMS OF USE, as modified. Accuracy of Information: While the information contained on this Website has been obtained from sources believed to be reliable, We disclaims all warranties as to the accuracy, completeness or adequacy of such information. User assumes sole responsibility for the use it makes of this Website to achieve his/her intended results.
Third Party Links: This Website may contain links to other third party websites, which are provided as additional resources for the convenience of Users. We do not endorse, sponsor or accept any responsibility for these third party websites, User agrees to direct any concerns relating to these third party websites to the relevant website administrator.
Cookies and Tracking
We may monitor how you use our Web sites. It is used solely for purposes of enabling us to provide you with a personalized Web site experience. This data may also be used in the aggregate, to identify appropriate product offerings and subscription plans. Cookies may be set in order to identify you and determine your access privileges. Cookies are simply identifiers. You have the ability to delete cookie files from your hard disk drive.

 According to Counterpoint Research, Transsion’s smartphone sales volume grew 3% YoY in the first half of 2023 and 17% YoY in Q2 2023 as demand for TECNO
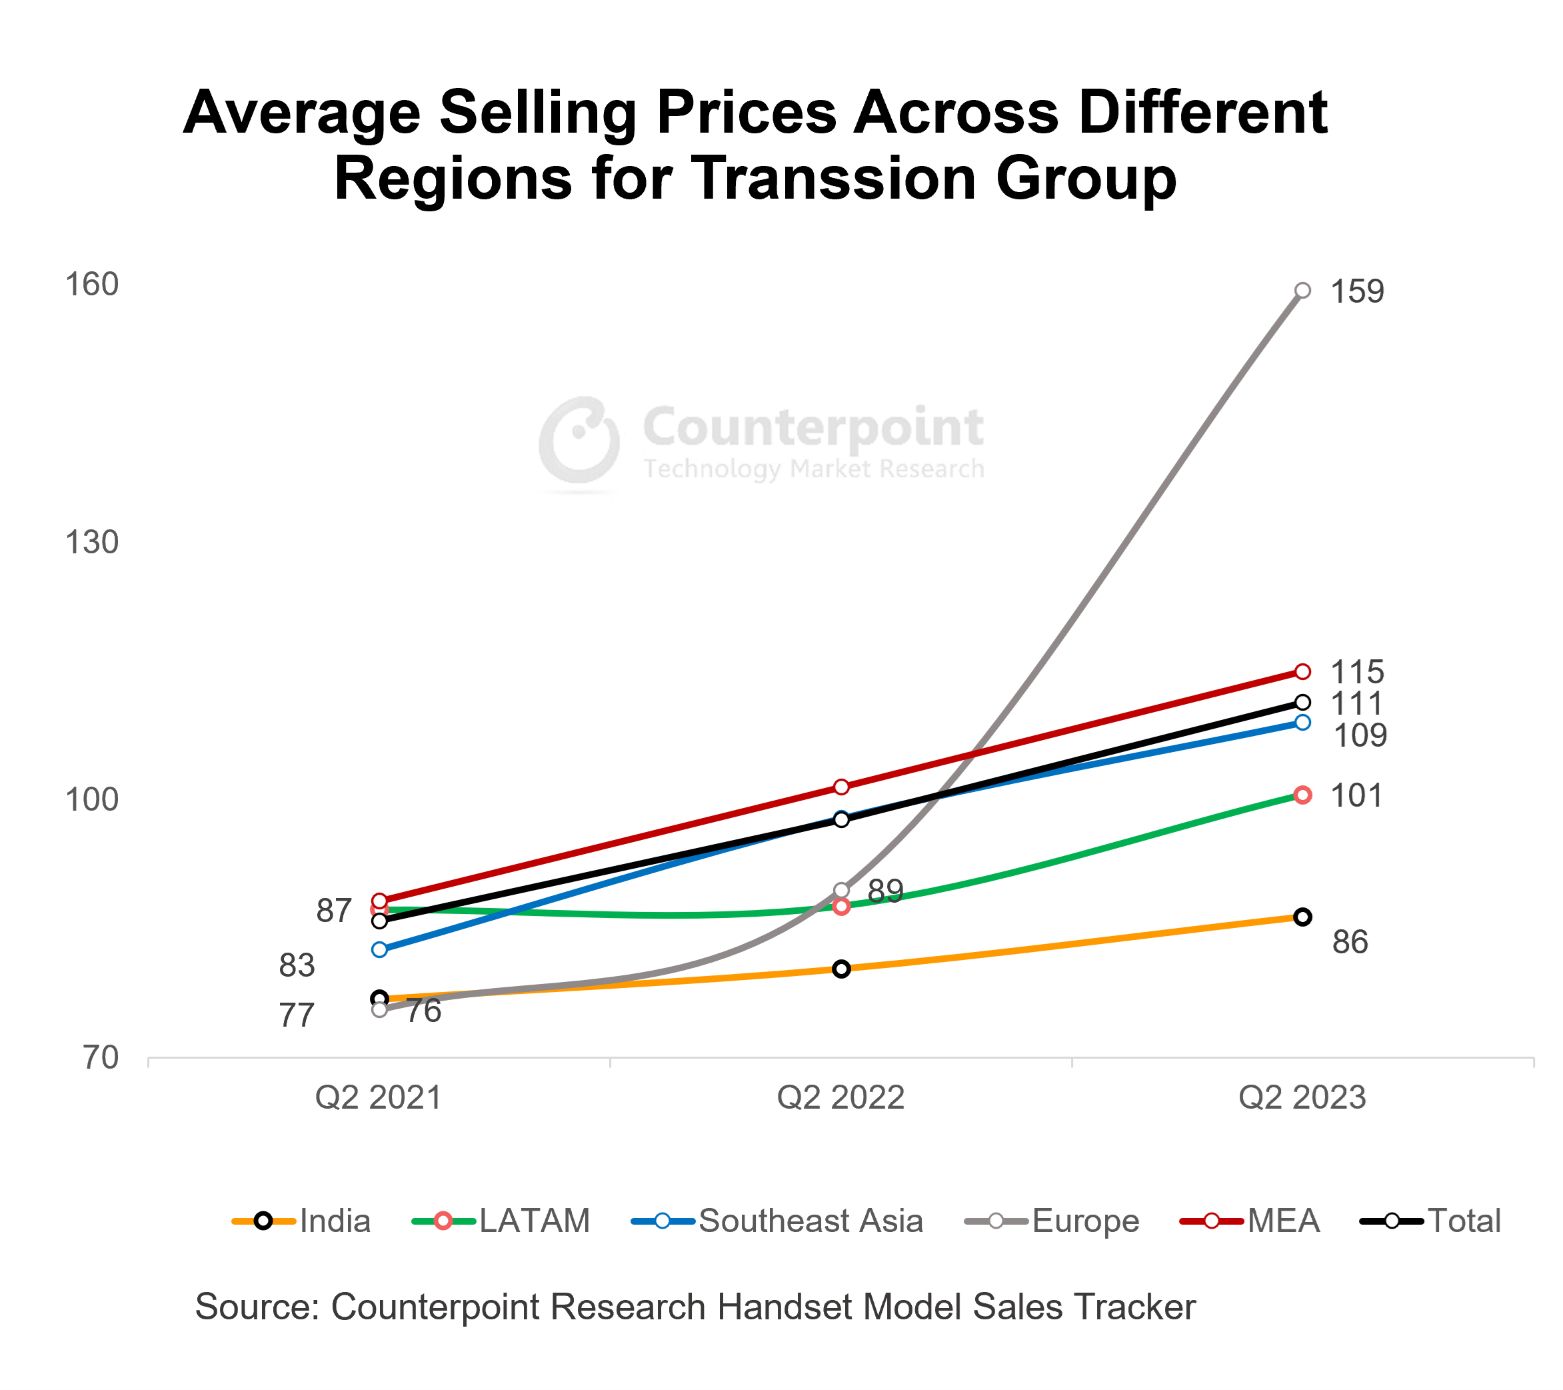 Much of Transsion’s financial successes can be attributed to its continued commitment to entering new markets. In Q2 2023, Africa accounted for 57% of Transsion’s smartphone sales volume, a net drop of 8% from a year ago. Outside Africa, Transsion smartphone sales grew 35% in Q2 2023, most notably in Latin America, Eastern
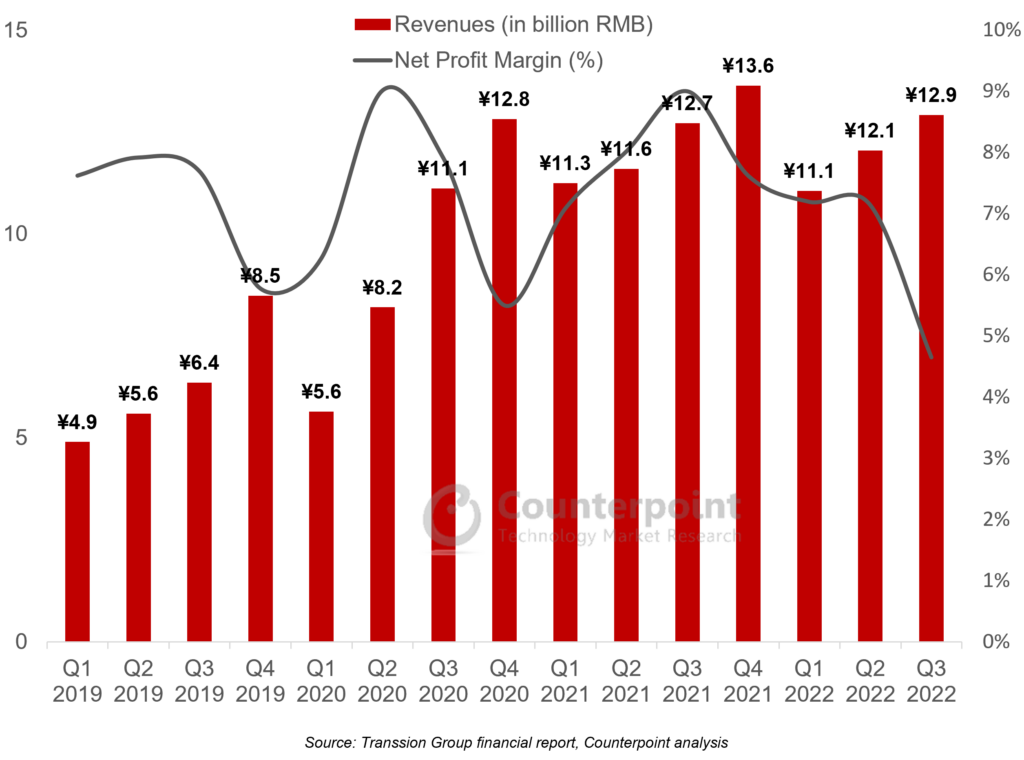


 Saudi Arabia Smartphone Shipments by Top 5 OEMs for Q1 2021, Q1 2022, Q1 2023