Although overall global smartphone shipments declined in Q2 2023, global foldable shipments rose.
In H2 2023, competition in the global foldable product market is set to escalate significantly, driven by the earnest entry of Chinese companies like OPPO and HONOR.
The global foldable market is expected to experience substantial growth in 2024, driven by the introduction of entry-level foldable products.
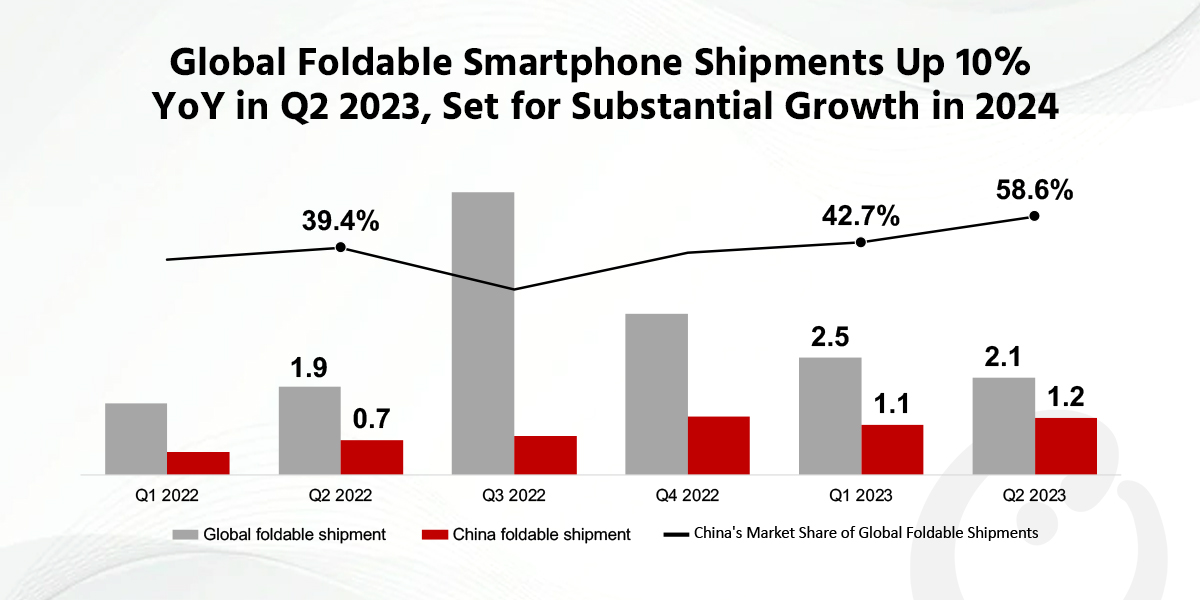
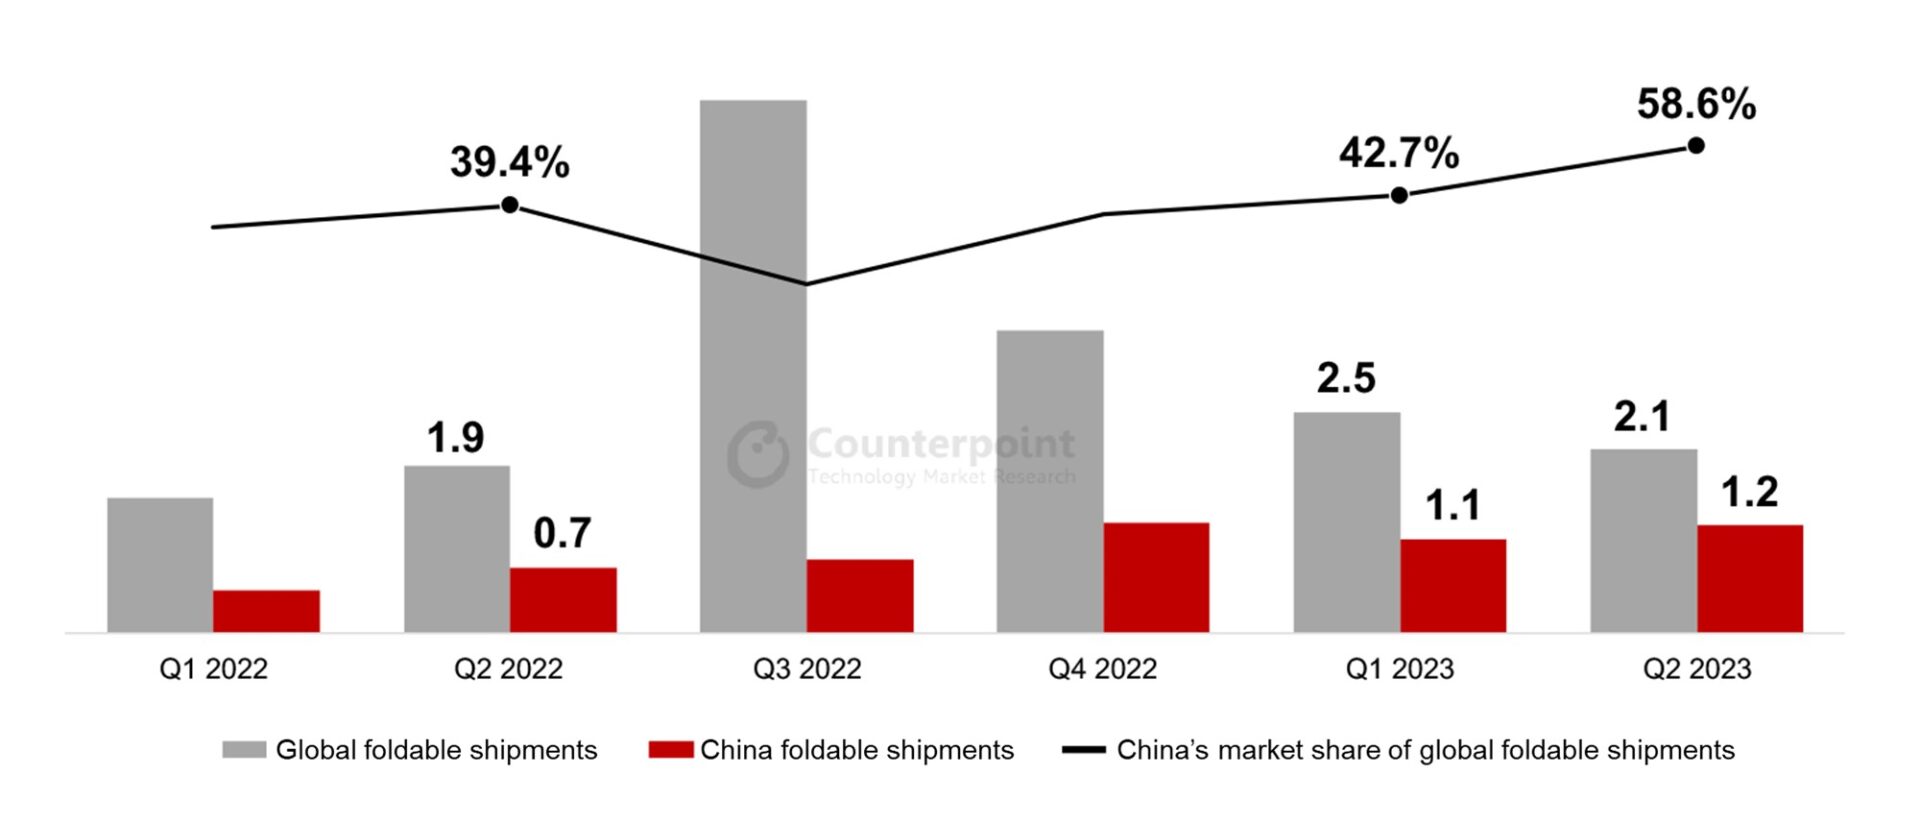
The global foldable smartphone market increased 10% YoY in Q2 2023 to reach 2.1 million units, according to Counterpoint Research’s most recentglobal foldable smartphone tracker.这种增长形成了鲜明对比的global smartphone market, which showed a 9% decline in shipments during the quarter to reach 268 million units. Due to the prolonged Russia-Ukraine war and the ongoing high global inflation, the smartphone market is expected to grow sideways. Nevertheless, the foldable smartphone sector continues to exhibit robust and sustained growth.
Global and ChinaFoldable Smartphone Shipments, Q1 2022-Q2 2023
The foldable smartphone landscape in the Chinese market presents a particularly intriguing scenario. During Q2 2023, shipments in the overall Chinese smartphone market slipped 4% YoY to reach 61.9 million units, hurt by the recent economic challenges faced by the country, which led to a reduction in consumer spending. However, the Chinese foldable smartphone market achieved notable success, surging 64% YoY to reach 1.2 million units. China now commands the largest share of the global foldable smartphone market, with a 58.6% share.
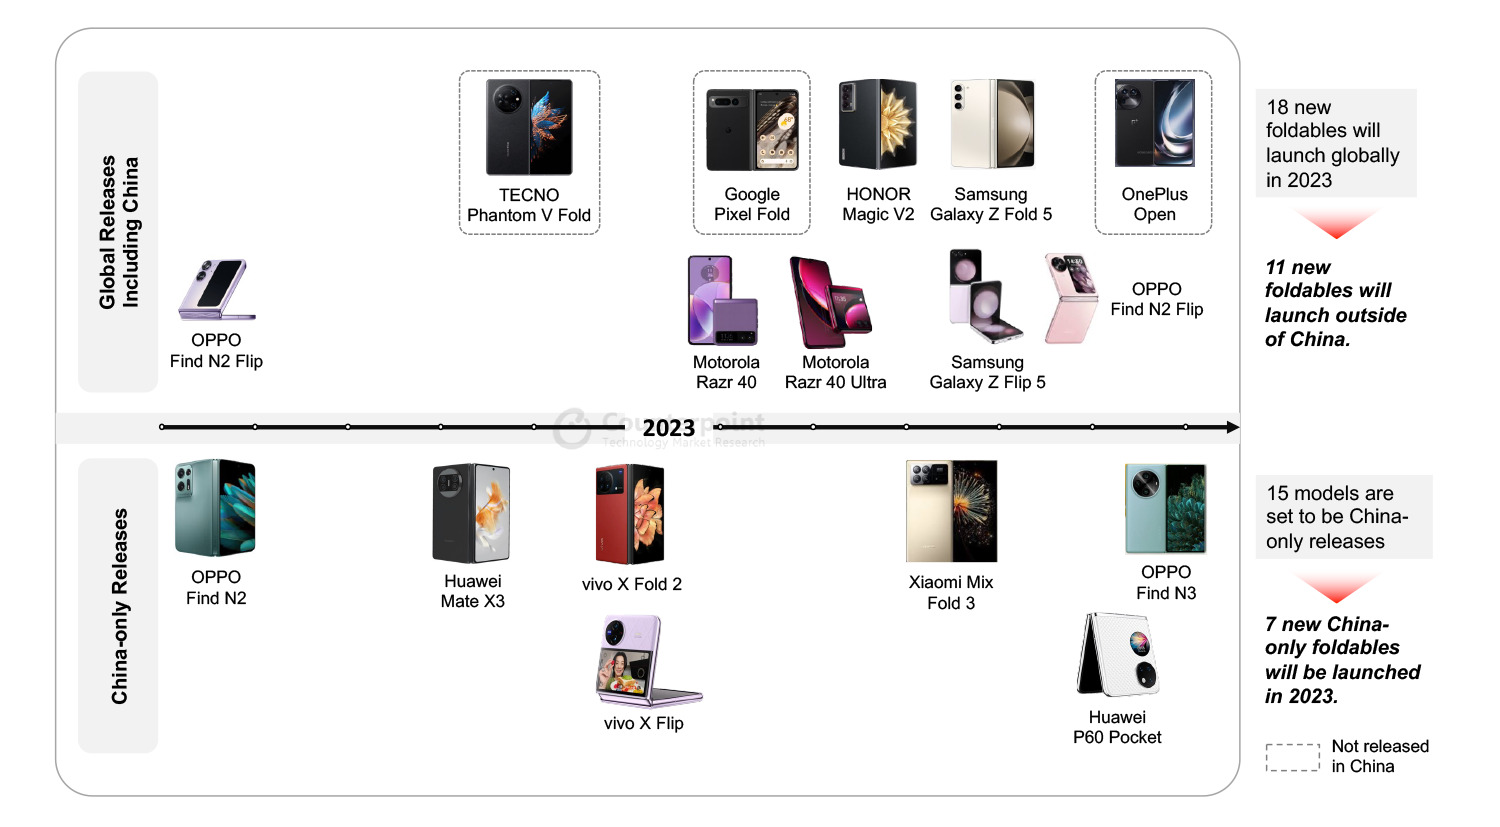
FoldableProduct Launch Status in 2023: Comparison of Global and Chinese Foldable Markets
The rapid growth of the Chinese foldable market is primarily attributed to the introduction of foldable products tailored for the Chinese market, coupled with a strong demand for these products among Chinese consumers. In Q2 2023, significant momentum is building for the continued growth of the foldable market. This surge was driven by the introduction of key products such as the Huawei Mate X3, vivo X Fold 2, and vivo X Flip, primarily targeting the Chinese foldable market. Additionally, the global (including China) launch of the Motorola Razr 40 and Razr 40 Ultra, further contributed to this growth trend. In Q2 2023, China saw the launch of five new foldable products tailored for its market, while the global market outside China only saw two foldable product launches during the same period.
Counterpoint Research Senior Analyst Jene Park说,“我们相信这些频繁的产品劳恩ches (along with the marketing effects that accompany product launches) are changing Chinese consumers’ perception of foldable products. Consequently, Chinese consumers can access a variety of foldable products more easily and frequently than any other market in the world. The continuous release of various foldable products is recognized as one of the important reasons why the Chinese foldable market has continued to grow significantly compared to other markets.”
The global foldable smartphone market will undergo significant changes in H2 2023. Chinese manufacturers are expanding their presence internationally during this period, with notable releases including the HONOR Magic V2, OPPO Find N3 Flip, and the yet-to-be-named OnePlus foldable device. Notably, Samsung’s Galaxy Z Fold 5 and Galaxy Z Flip 5, considered to be some of the top-tier foldable offerings, were launched in August and are expected to capture a substantial market share in H2 2023.
Parkadded, “The global foldable smartphone market is set to see significant growth in the H2 2023, driven by the expansion of Chinese manufacturers. Although Samsung’s market share may dip due to increased competition, we believe that it will be a natural result. However, competition among manufacturers usually has the effect of increasing the size of the market for the product. We believe that the era of the mass foldable phone is expected to start in 2024, mainly led by Samsung and Huawei with their entry-level foldables. Entry-level foldables are expected to be priced around $600 to $700, making them more accessible to consumers.”
(Use the buttons below to download the complete chart)
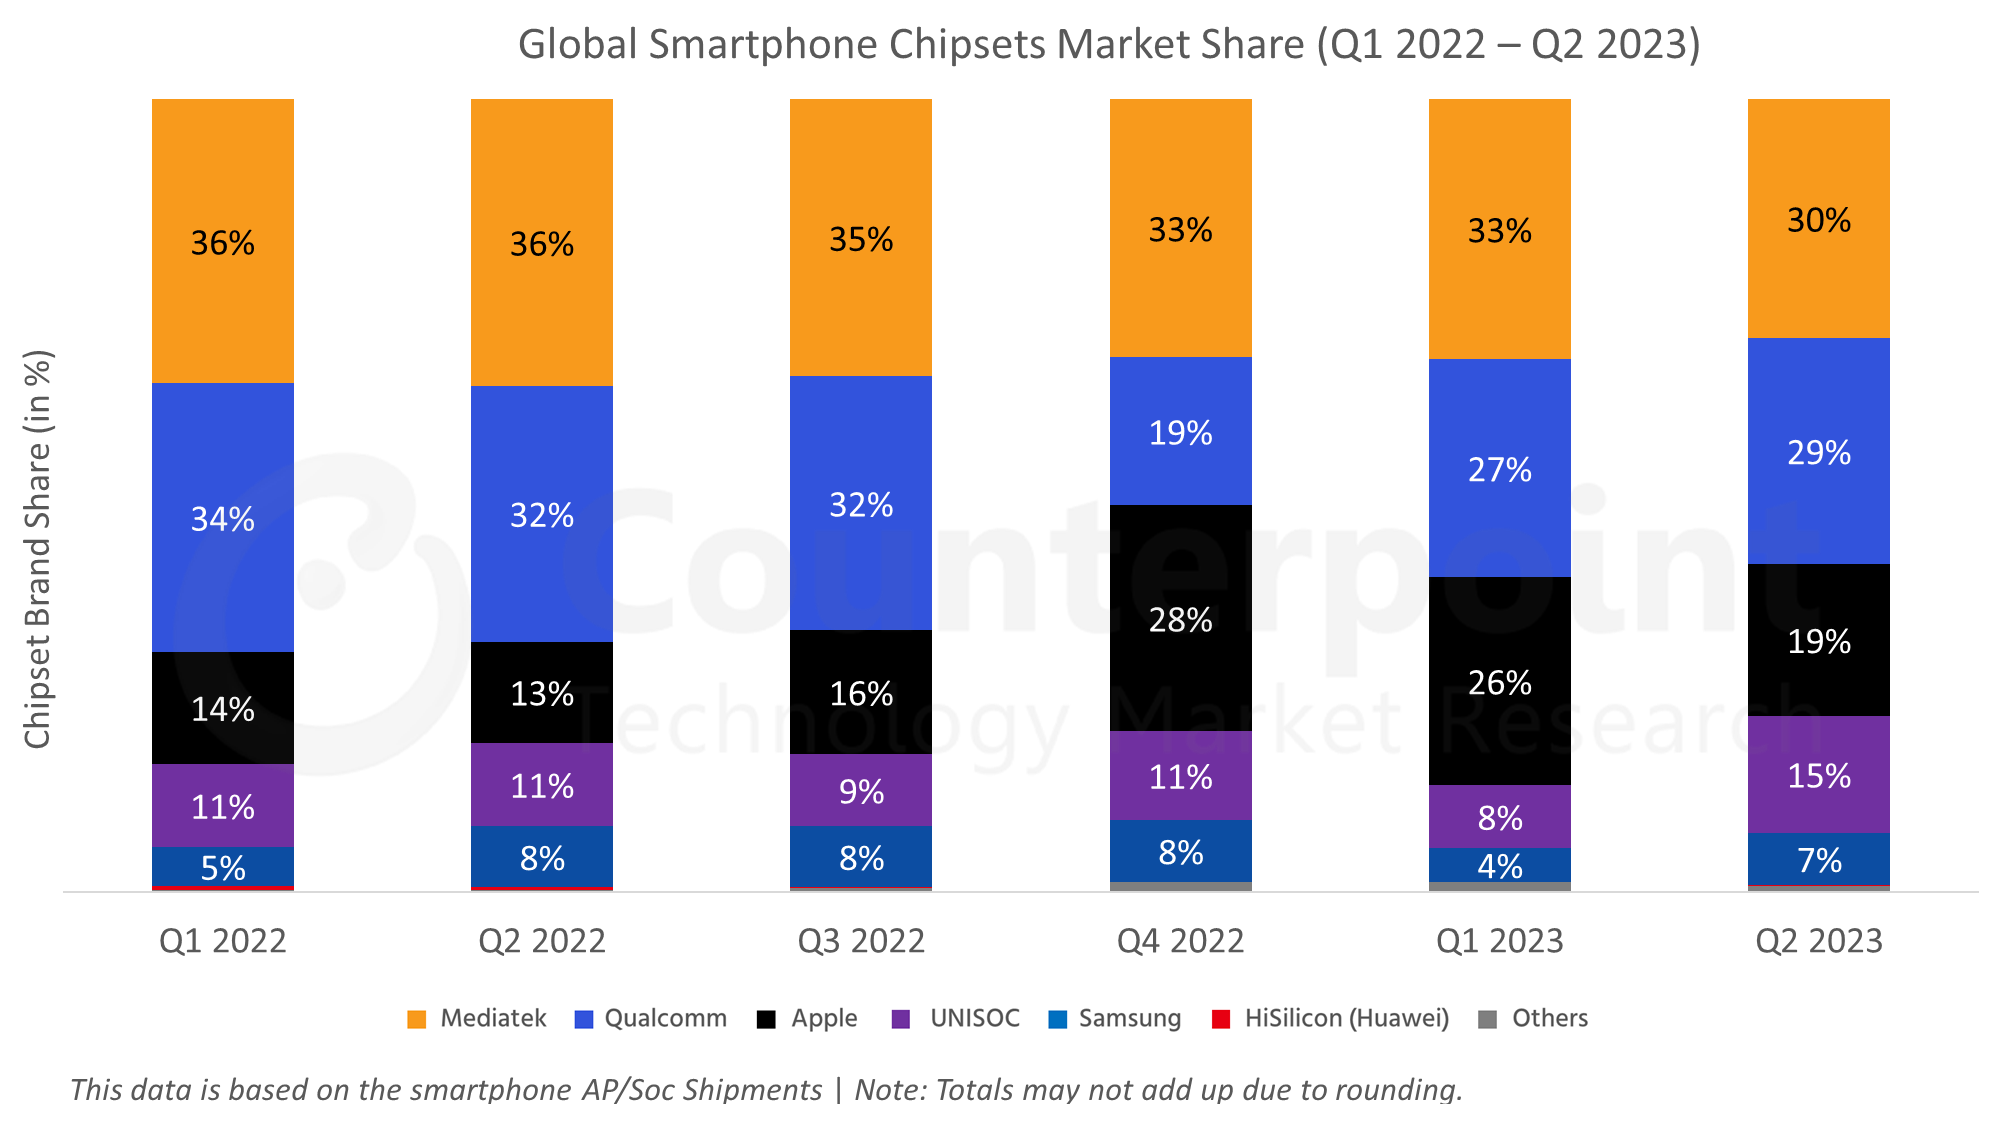
Highlights:
Apple’s sales declined in Q2 2023 due to seasonality. Its Pro series did better.
MediaTek’s shipments increased slightly in Q2 2023 with reduced inventory levels and growing competition in the entry-level 5G smartphone market. New smartphone launches in the low-to-mid-end segments increased the shipments of Dimensity 6000 and Dimensity 7000 series. The Dimensity 9200 Plus was added to the premium tier.
Qualcomm’s shipments increased in Q2 2023 due to the Snapdragon 8 Gen 2’s adoption in Samsung’s flagship smartphones and by Chinese OEMs. The launch of Samsung’s Flip and Fold series also contributed to this growth. Qualcomm refreshed the Snapdragon 7 Gen 1, Snapdragon 6 Gen 1 and Snapdragon 4 Gen 1 series to gain some share back. However, the premium segment’s growth remained in focus.
Samsung’s shipments increased in Q2 2023. The Exynos 1330 and 1380’s launch added volumes to the low and mid-high segments.
UNISOC’s shipments grew in Q2 2023 after a weak Q1. It gained some share in the $100-$150 LTE segment. In H2 2023, as entry-level 5G smartphones pick up in regions like LATAM, SEA, MEA and Europe, UNISOC will gain some share.
For a more detailed smartphone AP-SoC shipments & forecast tracker, click below:
Global Smartphone AP-SOC Shipment & Forecast Tracker by Model – Q2 2023
This report tracks the smartphone AP/SoC Shipments by Model for all the vendors. The scope of this report is from the AP/SoC shipments from all the key vendors like Apple, Qualcomm, MediaTek, Huawei, Samsung, UNISOC and JLQ. We have covered all the main models starting fromQ1 2020 to Q2 2023.We have also included aone-quarter forecast for Q3E 2023.本报告将帮助你了解AP / SoC Market from the shipment perspective. Furthermore, we have also covered key specs for these AP/SoC covering market view by:
Network(4G/5G AP/SoC)
Foundry Details(like TSMC, Samsung. etc.)
Process node(5nm, 6nm, 8nm, etc.)
Manufacturing Process(FinFET, N7, N5, etc.)
CPU Cores Architecture and CPU Cores Count
Modem(External/Internal)
Modem Name
Secure Element Presence
Security Chip
AI Accelerator
For detailed insights on the data, please reach out to us at年代ales(at)www.arena-ruc.com.If you are a member of the press, please contact us atpress(at)www.arena-ruc.comfor any media enquiries.
In some markets, operators await evidence of successful use cases before switching to 5G SA.
In H1 2023, the Asia-Pacific region continued to lead in terms of 5G SA Core deployments.
Ericsson led the overall market followed by Nokia, Huawei, ZTE, Samsung, and Mavenir.
Counterpoint Research’s recently publishedJuly updateof the5G SA Core Trackeris a culmination of an extensive study of the5GSA market. It provides details of all operators with 5G SA cores in commercial operation at the end of H1 2023, including market share by region, vendor, and the popular frequency bands for deployments. Apart from that, it touches upon the potential monetization opportunities for telecom operators across different domains and uses cases.
Last year, there was steady growth in the commercial deployment of5GStandalone (SA), with more than 20 operators moving to 5G standalone core. However, the pace slowed down in H1 2023 with the number of operators launching commercial 5G SA ranging in single digits. The primary reason for the slowdown in commercialdeploymentof 5G SA was the restraint arising from global macroeconomic factors and the lack of a clear picture of 5G monetization for operators. Although the pace of commercial deployment has slowed down in 2023,operators正在盈利的途径,工作状态ng on SA-specific use cases, including on-demand network slicing and FWA.
Most of the 5G SA commercial deployments have been in developed economies, and Counterpoint Research expects the next bulk ofnetworkrollouts will take place in emerging markets. This will drive the continuing transition from 5G NSA to 5G SA.
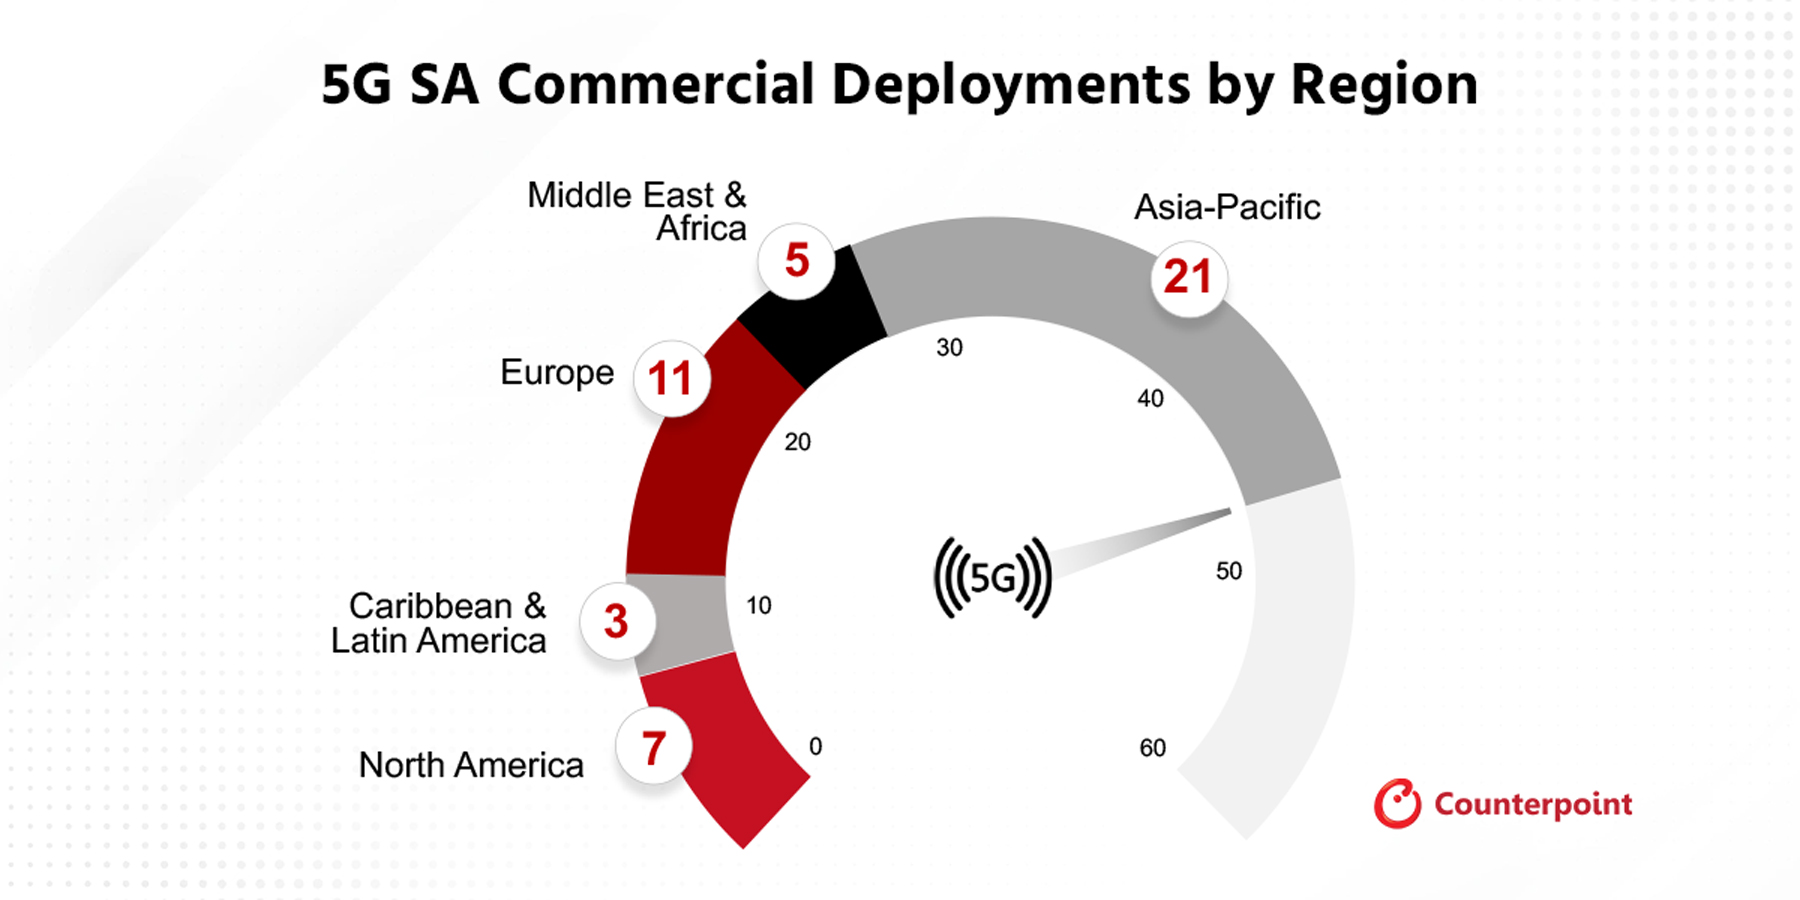
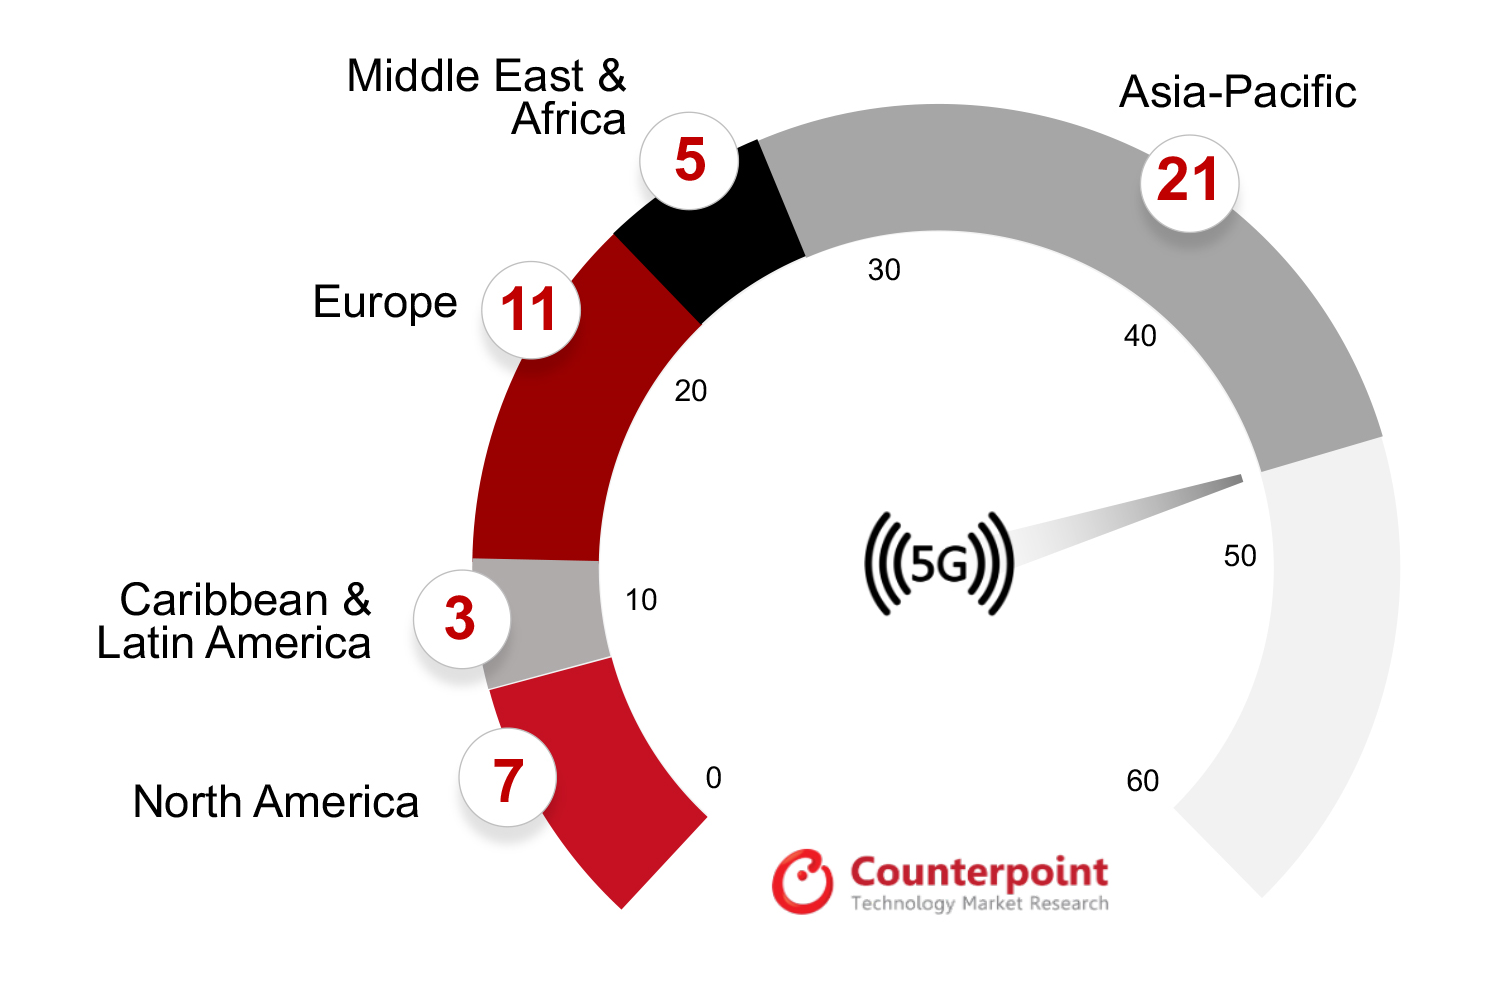
Exhibit 1: 5G SA Deployments by Region, H1 2023
As shown in Exhibit 1, the Asia-Pacific region led the segment, followed by Europe and North America, with the other regions – Middle East and Africa, and Latin America – lagging.
Key Points
Key points discussed in the report include:
Operators– 47 operators have deployed 5G SA commercially with many more in the testing and trial phase. Globally, most of the deployments are in developed economies with those in emerging economies lagging. Although the pace of deployment is steady in developedmarkets, it is progressing slowly in emerging markets, and in some markets, operators are biding their time and looking for evidence of successful use cases before switching from 5G NSA to SA. The ongoing economic headwinds also delayed the commercial deployment of SA, which was seen in H1 2023.
Vendors– Ericsson and Nokia lead the5GSA全球核心市场,正受益于the geopolitical sanctions on Chinese vendors Huawei and ZTE in some markets. South Korea’s Samsung and Japan’s NEC are mainly focused on their respective domestic markets but are expanding their reach to Tier-2 operators and emergingmarkets, while emerging vendors Parallel Wireless and Mavenir are working with leading operators in Europe, and Middle East and Africa.
Spectrum– Most operators are deploying 5G in mid-band frequencies, n78, as it provides faster speeds and good coverage. Some operators have also launched commercial年代ervicesin the sub-GHz n28 and mmWave wave n258 bands. FWA seems to be the most popular use case at present but there is a lot of interest in edge services and network slicing as well.
Use Cases– Operators are looking for avenues to monetize the5G年代ervices, as they are struggling to make the RoI from their investments in 5G. Although FWA is a promised application for 5G SA monetization, there are many other use cases that operators can look into to increase their RoI, includingnetwork年代licing, live broadcasting, XR applications, and private networks. Although eMBB is the most widely used 5G use case currently, MNOs need to move to 5G SA to leverage URLLC and mMTC use cases.
Report Overview
Counterpoint Research’s5G SA Core Tracker, July 2023provides an overview of the 5G Standalone (SA) market, highlighting the key trends and drivers that are shaping the market, along with details of commercial launches by vendor, region, and frequency band. Additionally, the tracker provides details about the 5G SA vendor ecosystem split into two categories – public operator and private network markets.
Table of Contents:
Overview
Market Update
5G SA Market Deployments
Commercial Deployment by Operators
Network Engagements by Region
Network Engagements by Deployments Status
Leading 5G Core Vendors
Mobile Core Vendor Ecosystem
5G Core Vendors Market Landscape
Outlook
5G Standalone Use Cases
Background
Counterpoint Technology Market Research is a global research firm specializing in products in the TMT (technology, media and telecom) industry. It services major technology and financial firms with a mix of monthly reports, customized projects and detailed analyses of the mobile and technology markets. Its key analysts are seasoned experts in the high-tech industry.
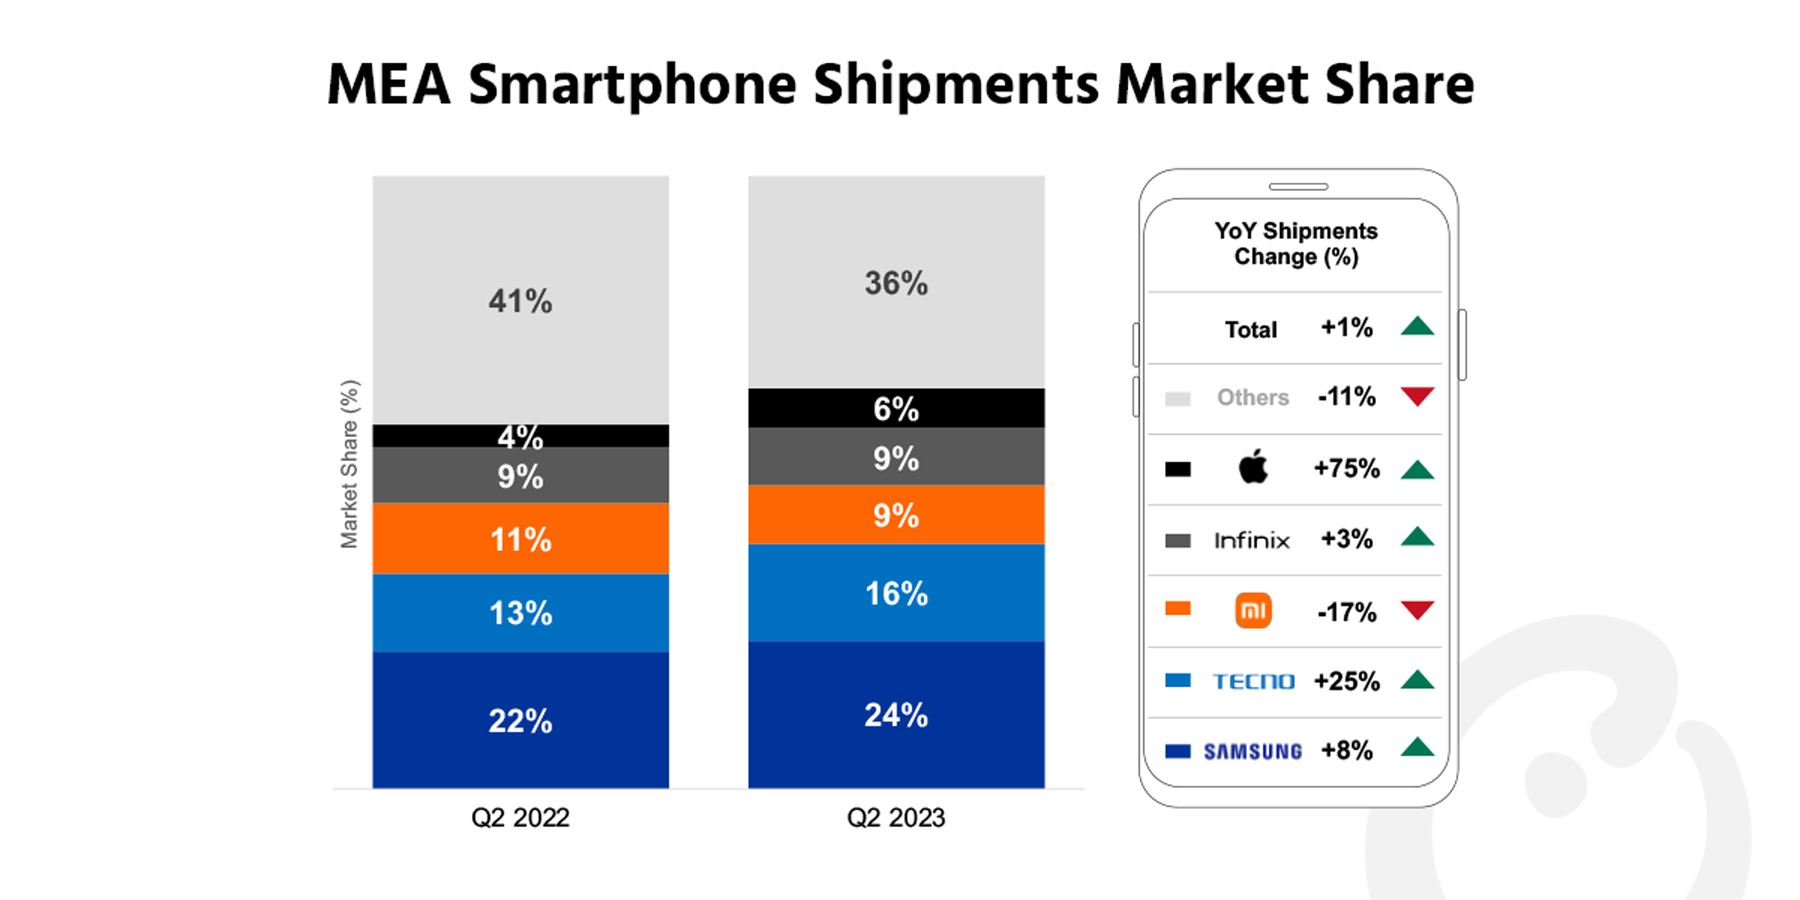
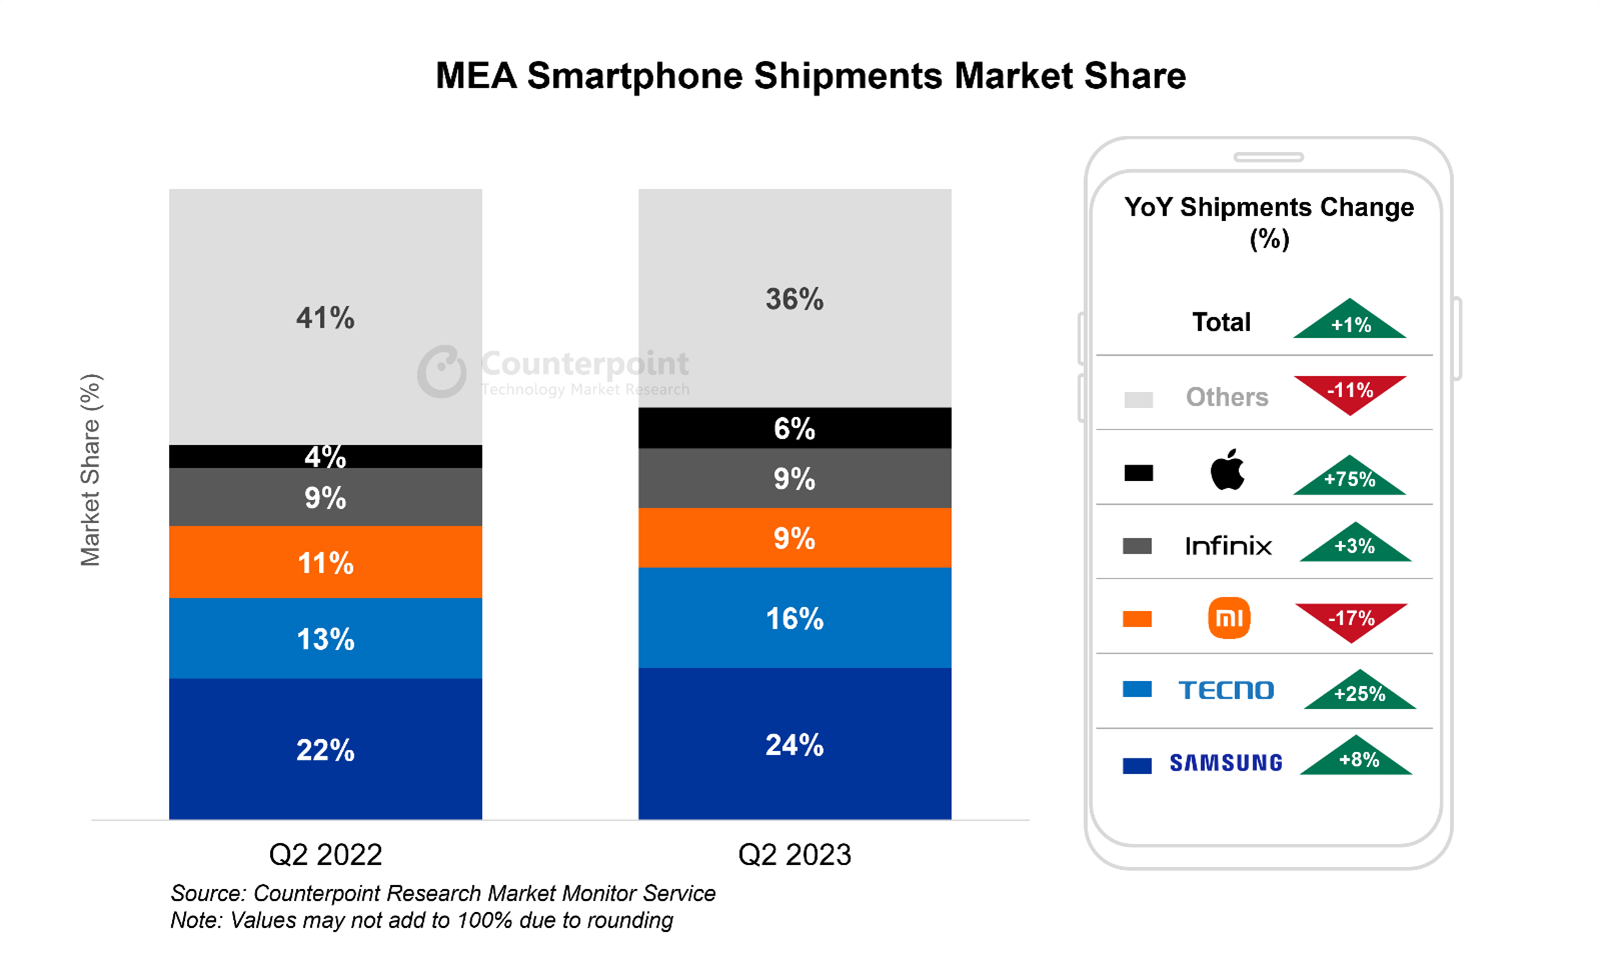
MEA smartphone shipments increased 1% YoY and 7% QoQ in Q2 2023.
Consumer sentiment picked up during the quarter with falling inflation rates and stabilizing local currencies. These boosted demand for ‘big ticket’ items like smartphones.
Samsung saw a rebound in its shipments and market share during the quarter.
Transsion Group’s shipments grew 2% YoY, or an impressive 14% QoQ, in a typically weak quarter.
Apple continued its steep rise, with shipments up 75% YoY in Q2.
London, Boston, Toronto, New Delhi, Hong Kong, Beijing, Taipei, Seoul – September 5, 2023
Smartphone年代hipments in the Middle East and Africa (MEA) region increased 1% YoY and 7% QoQ in Q2 2023, according to the latest research from Counterpoint’sMarket Monitor Service.This was the MEA smartphone market’s first meaningful rebound in five quarters, or since the global inflation crisis started. Consumer sentiment improved materially during the quarter, as inflation rates fell and local currencies stabilized. This came as a welcome relief for embattled OEMs, which had been sitting on an alarming level of inventory in 2022. They utilized the opportunity to destock and return to a more normal pattern of inventory and product launches.
Commenting on the market’s performance,Senior Analyst Yang Wang年代aid, “TheMEAregion seems to be the first to come out of the global downturn in the年代martphonemarket. Market activity picked up during the quarter on better macroeconomic environment and consumers could afford to be more optimistic about ‘big ticket’ item purchases. This was reflected in robustRamadanand Easter sales and throughout the quarter. The encouraging performances show once again that the MEA region could be the last remaining untapped smartphonemarket.There is still significant potential for large segments of the population to upgrade to smartphones.”
Looking at individual brands, Samsung, TECNO andApplewere the biggest winners.Samsung’s rebound can be attributed to the lower-pricedGalaxyA series’ strong sales, while new 5G and premium-end models also did well.TECNO, and sister brandInfinixto some extent, performed very well due to better economic conditions, particularly for lower income groups, and aggressive market entries in the Middle East. TECNO andInfinix’s年代uccesses, however, can be partly attributed to the cannibalization ofitel’s market share. Lastly,Applehad an outstanding quarter to round off a very strong iPhone 14 series cycle. TheOEMmanaged to increase penetration in key Middle East markets with the higher-priced Pro and Pro Max models getting good reception.
On the other hand,Xiaomiretreated 17% YoY as it faced strong competition from Samsung and Transsion brands in the mid-range. Outside of the top 10,OPPOandvivocontinued to slide as the availability of the brands’ stock contracted and market penetration activities shrank. However,realmemaintained positive momentum due to increasing product availability in new markets.
Commenting on pricing trends in the MEA smartphone market, Wang said, “The premium end is usually an afterthought for the MEA market, but the segment was an outperformer of Q2 2023. The sales of smartphones priced above $800 grew 93% YoY, largely due to Apple’s high-end models in the iPhone 14 series. The OEM’s share increased in key GCC markets, while it was seen making efforts to expand distribution channels in Africa. Apple’s success in the MEA region is another proof of the brand’s strong global appeal. As the process of urbanization and industrialization continues across the region, Apple can expect to remain one of the topOEMsin the region.”
Counterpoint Research’s market-leadingMarket Monitor,MarketPulseandModel Sales年代ervices for mobile handsets are available for subscribing clients.
Feel free to contact us at press@www.arena-ruc.com for questions regarding our in-depth research and insights.
Counterpoint Technology Market Research is a global research firm specializing in products in the TMT (technology, media and telecom) industry. It services major technology and financial firms with a mix of monthly reports, customized projects and detailed analyses of the mobile and technology markets. Its key analysts are seasoned experts in the high-tech industry.
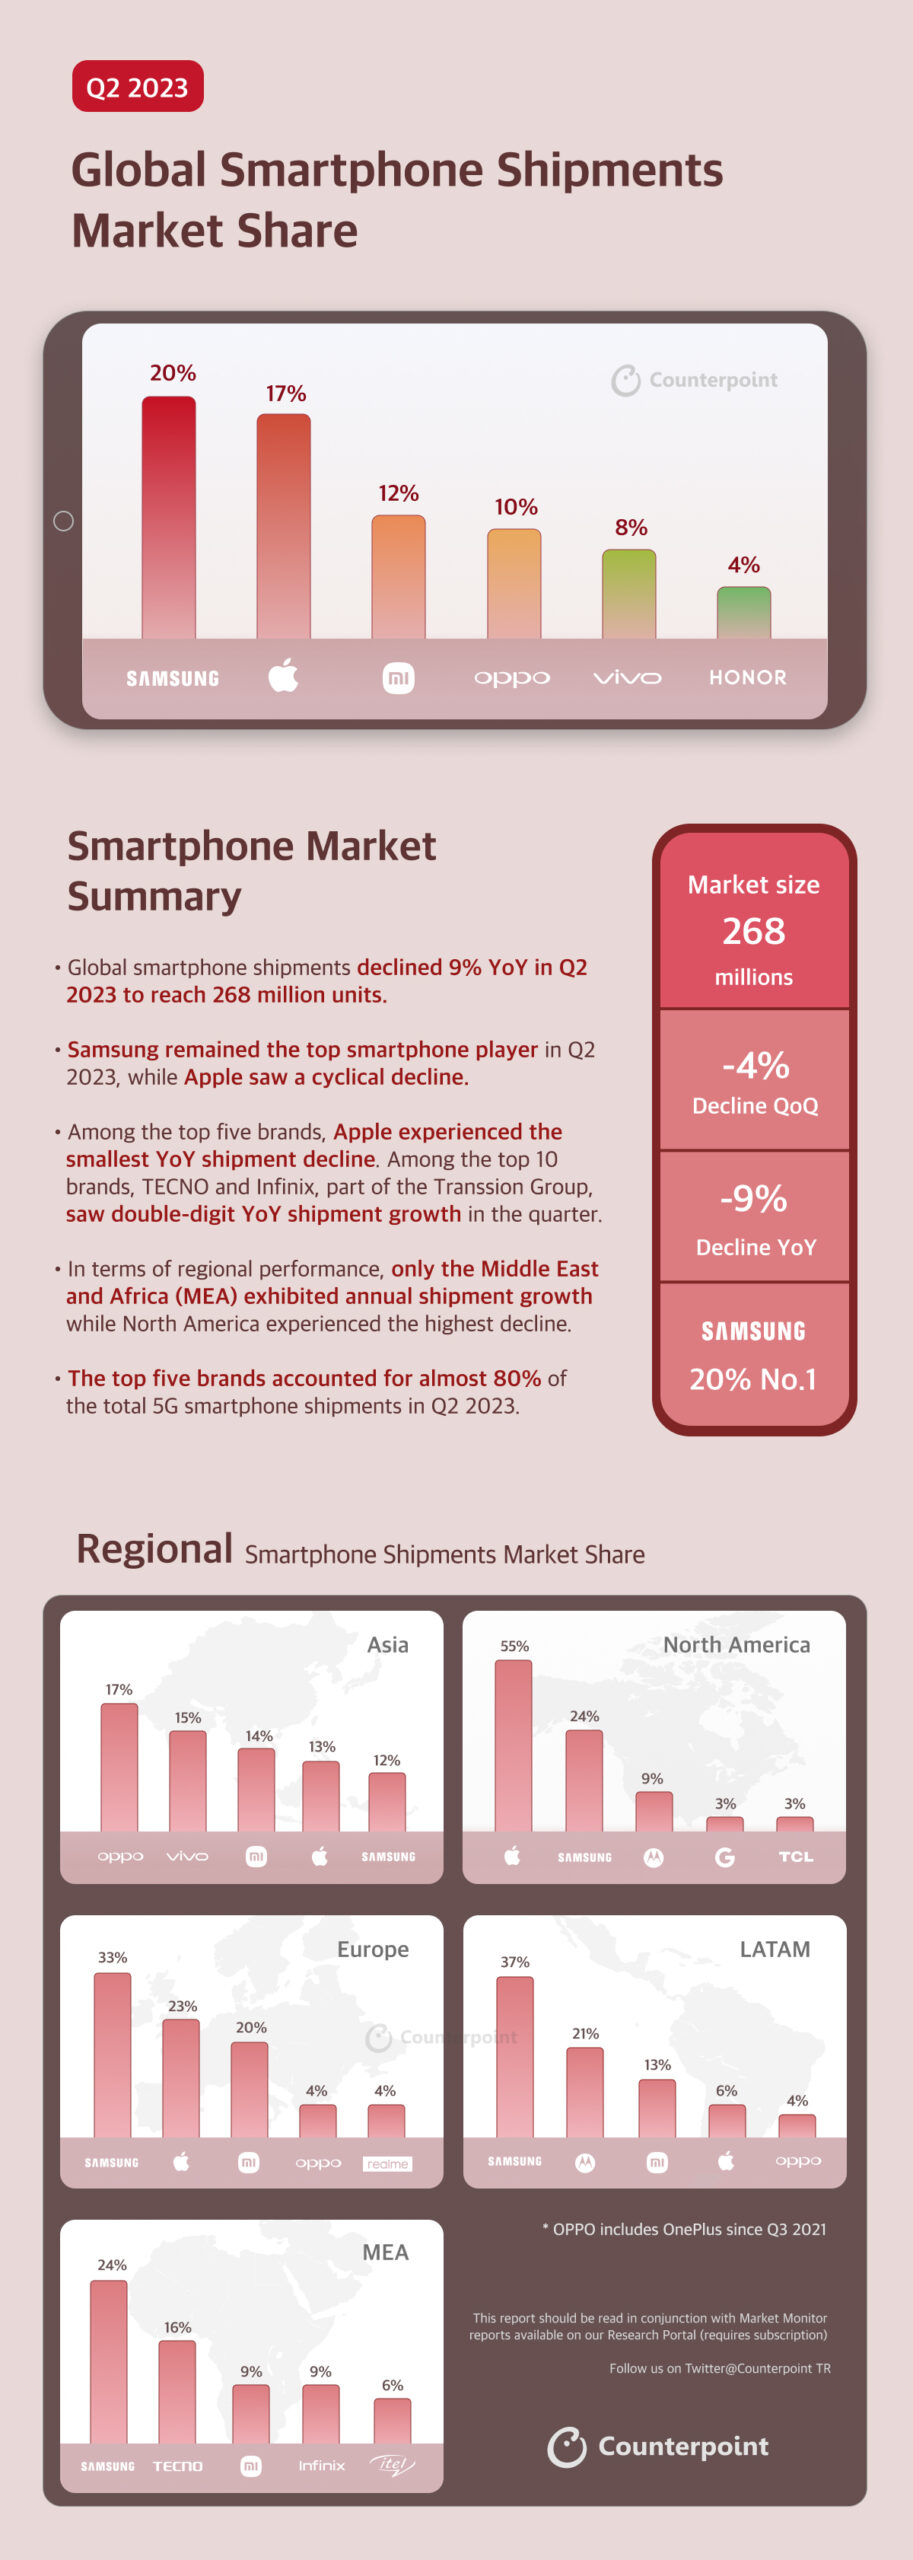
Our Q2 2023 Market Monitor report has been published. We release one infographic each quarter to summarize the global smartphone market activities in a single page.
Some quick observations on the smartphone market:
Global smartphone shipments declined 9% YoY in Q2 2023 to reach 268 million units.
Samsung remained the top smartphone player in Q2 2023, while Apple saw a cyclical decline.
Among the top five brands, Apple experienced the smallest YoY shipment decline. Among the top 10 brands, TECNO and Infinix, part of the Transsion Group, saw double-digit YoY shipment growth in the quarter.
In terms of regional performance, only the Middle East and Africa (MEA) exhibited annual shipment growth while North America experienced the highest decline.
The top five brands accounted for almost 80% of the total 5G smartphone shipments in Q2 2023.
Use the button below to download the high resolution PDF of the infographic:
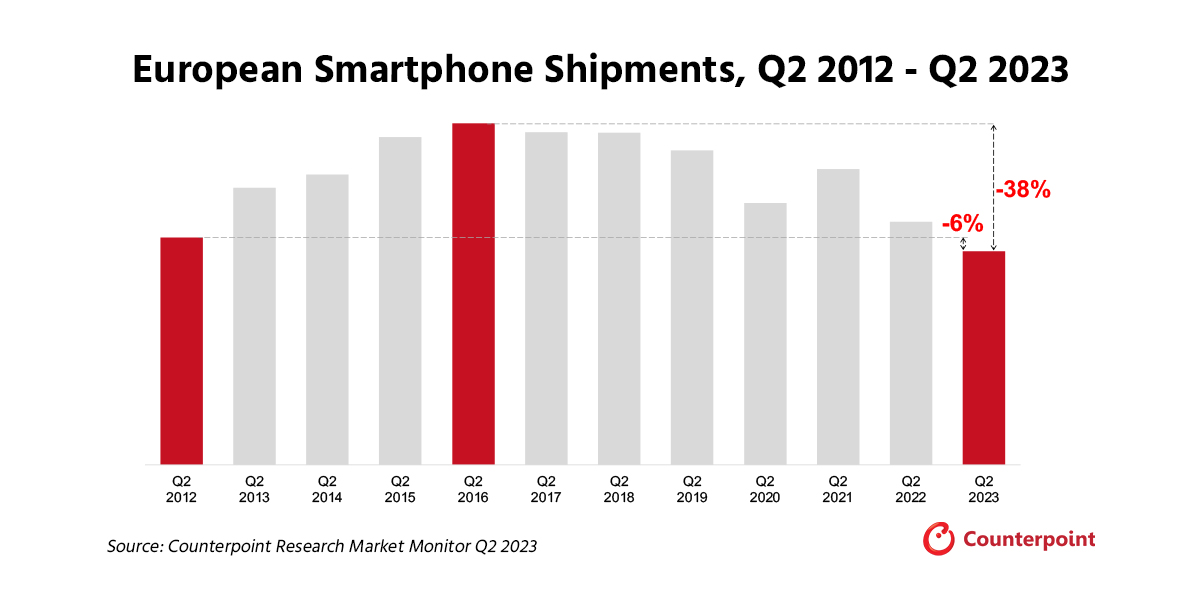
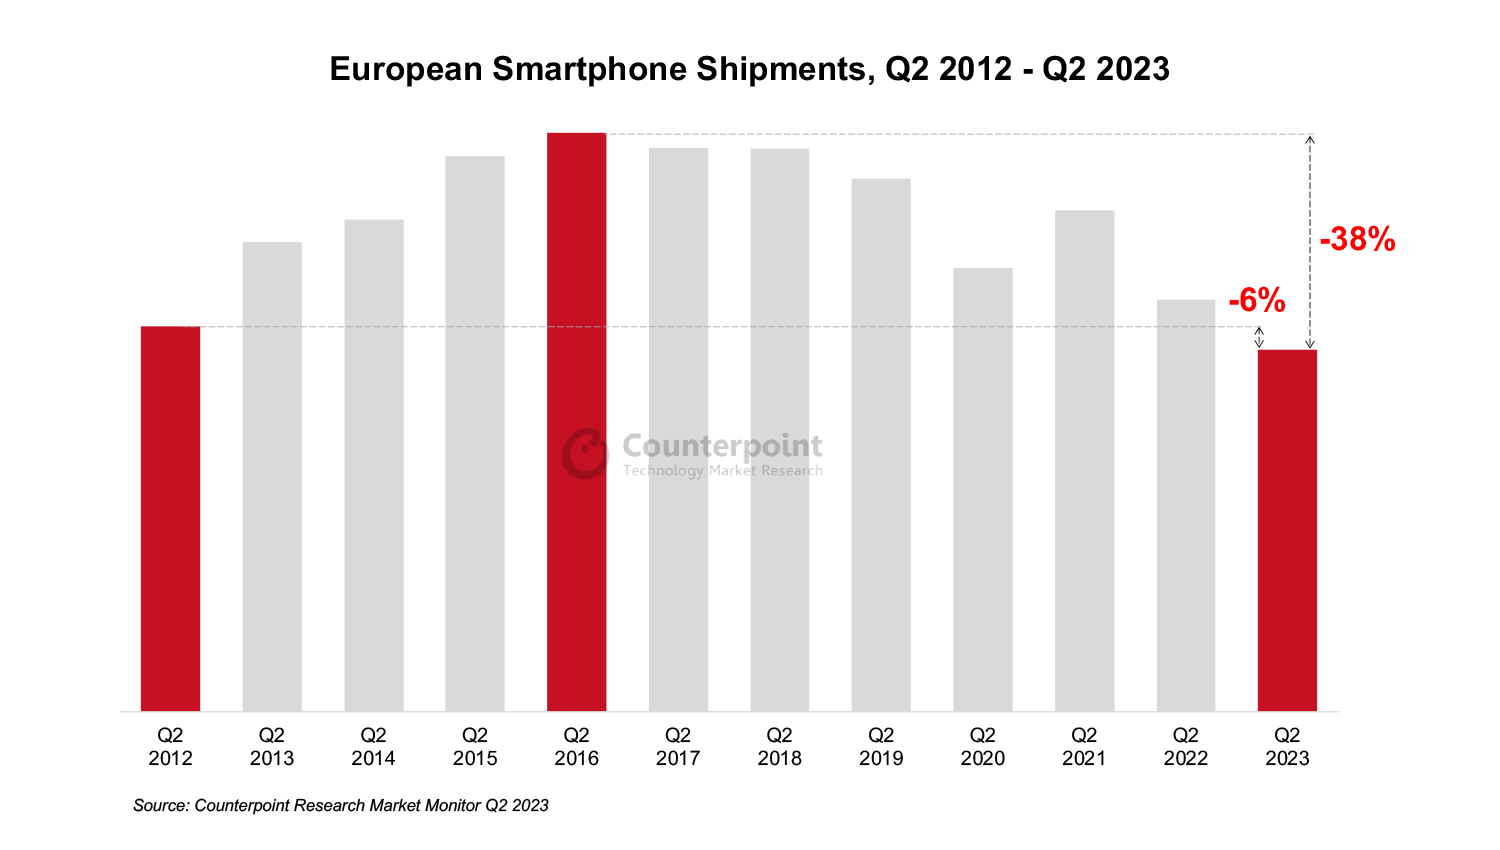
Europe smartphone shipments fell 12% YoY in Q2 2023 to reach lowest since 2012.
Russia only major market to register growth at 4% YoY.
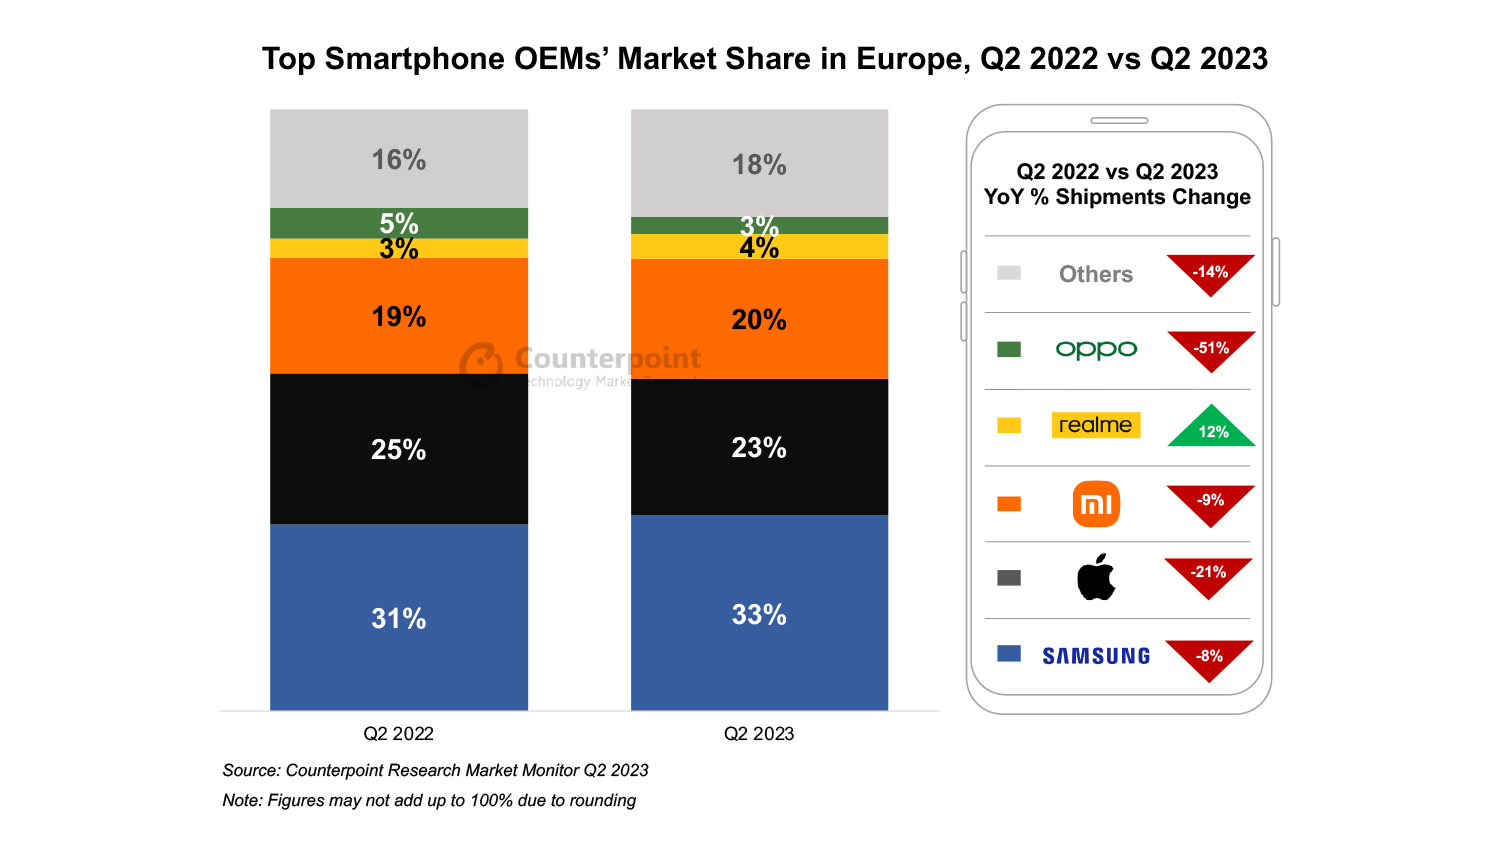
OPPO’s shipments fell 51% YoY hurt by patent issues and difficult market conditions.
2023 smartphone shipments are set to be lower than in 2022.
London, Boston, Toronto, New Delhi, Jakarta, Beijing, Taipei, Seoul – September 1, 2023
European smartphone shipments declined 12% YoY in Q2 2023, marking the lowest quarterly shipment volume since Q1 2012, according to the latest report from Counterpoint Research’s Market Monitor Service.
Western Europe declined by 14% YoY during the quarter while Eastern Europe limited its fall to 8% YoY, despite being in an already battered state. All major European nations performed weakly in Q2 2023, except Russia, which conversely registered 4% YoY growth. However, this was primarily due to lower shipments in Q2 2022 – the first full quarter after Russia’s invasion of Ukraine and the resulting sanctions and market exits of prominent smartphone players.
相对应的人经历了一段艰难的时期在2023年第二季度的专利isputes and uncertainty in several countries, due to which the brand’s shipments dropped 51% YoY. The uncertainty is likely to persist which will result in further shipment declines in the coming quarters.
realme grew 12% YoY, driven primarily by Russia, which accounted for 55% of the brand’s shipments in the region. In Russia, realme benefitted from Samsung and Apple’s market exit, which allowed the company to fill the void left by these heavyweights. Additionally, realme has remained in the second position in Russia for five straight quarters and has been closing the gap with the market leader Xiaomi.
HONOR registered 9% YoY growth during the quarter due to the base effect and its ongoing expansion outside China.
Commenting on the current market dynamics,Research AnalystHarshit Rastogi年代aid, “Despite falling shipment volumes, the higher price bands (wholesale prices exceeding $600) have been capturing a larger share of the market each year. They also have a longer replacement cycle compared to mid-segment and lower-price band smartphones, which further dampens demand. Consequently, OEMs are likely to focus on increasing their ASP and concentrate on services to drive revenue growth in the coming quarters.”
Commenting on market outlook,Associate Director JanStryjakcommented, “The market is unlikely to make a full recovery `this year and 2023 smartphone shipments are set to be lower than in 2022, marking consecutive decade-low shipments in both 2022 and 2023. While the economic conditions are partly to blame, consumer buying behaviour is also changing, suggesting that a lower level of sales will set a new baseline. However, despite the low shipment volumes, upcoming iterations of Apple’s iPhone and Samsung’s foldables are likely to fare well, prompting a bump in sales volumes in the coming quarters.”
Background
Counterpoint Technology Market Research is a global research firm specializing in products in the TMT (technology, media, and telecom) industry. It services major technology and financial firms with a mix of monthly reports, customized projects, and detailed analyses of the mobile and technology markets. Its key analysts are seasoned experts in the high-tech industry.
DOWNLOAD: (Use the buttons below to download the complete chart)
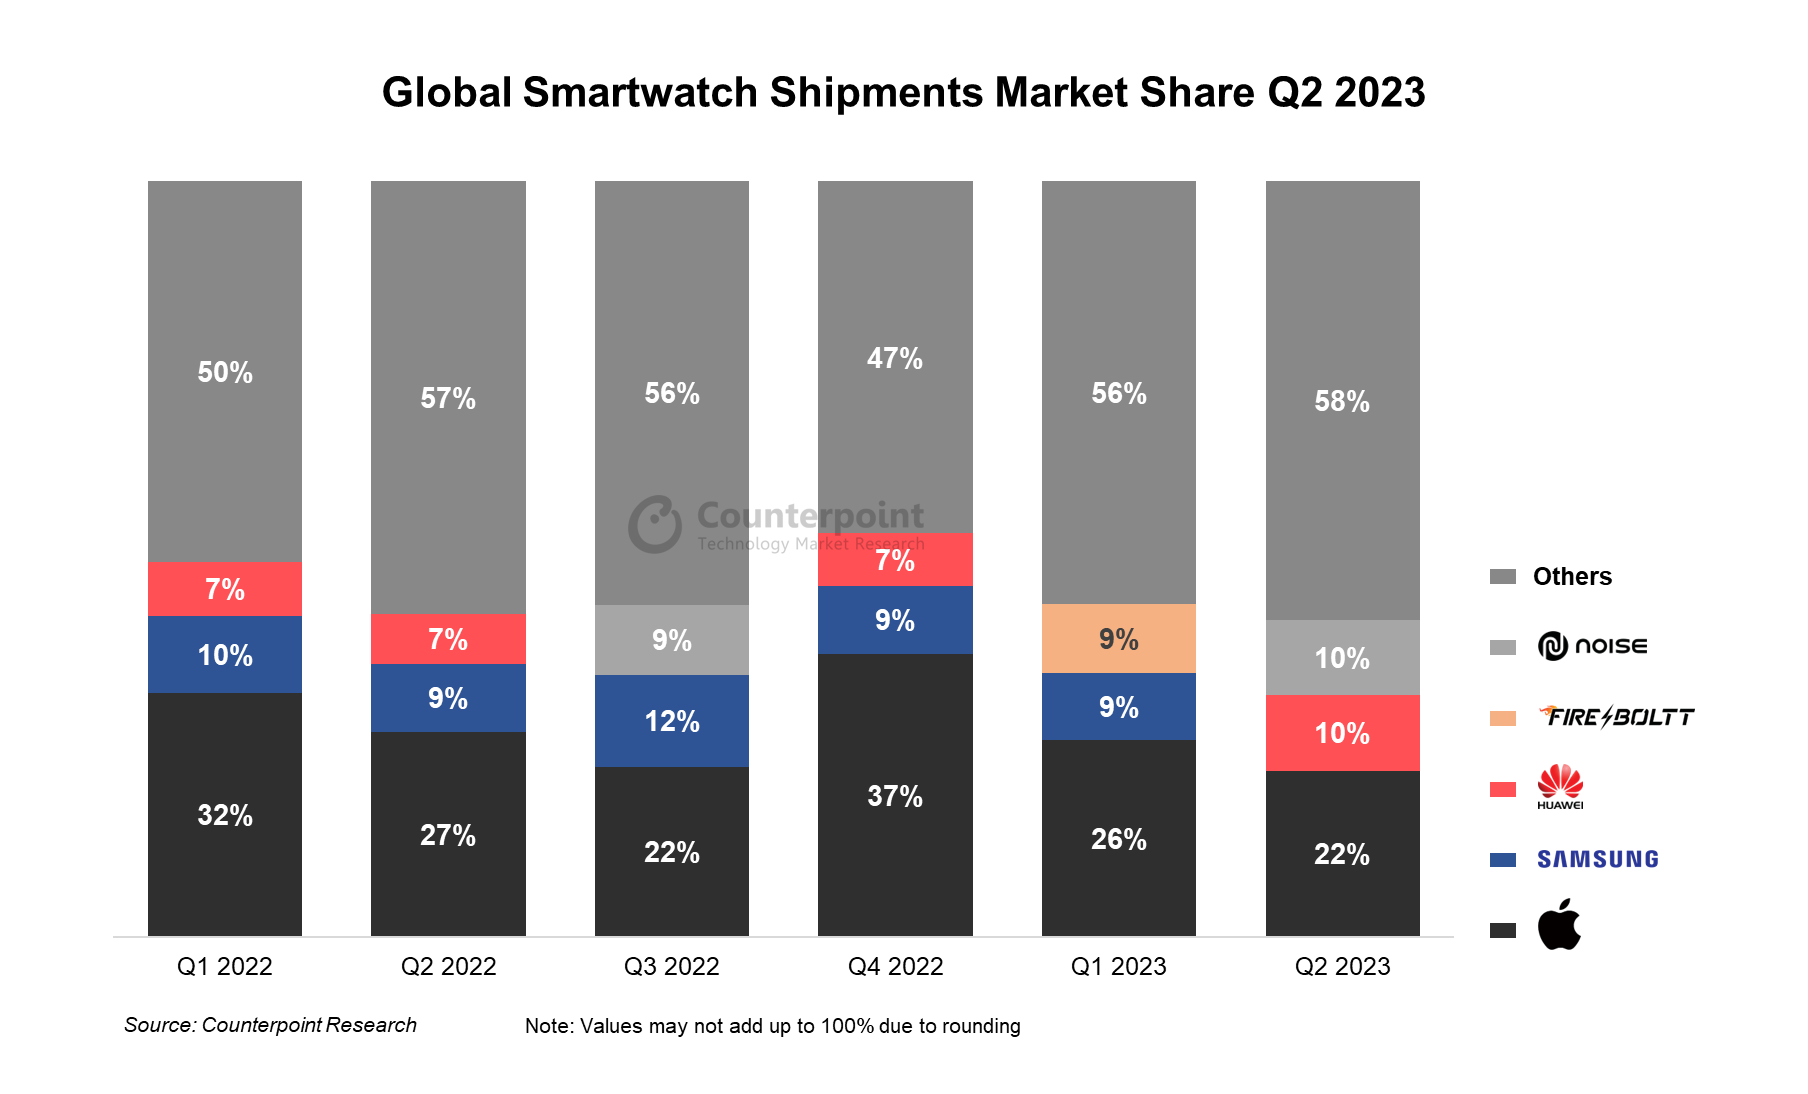
Global Smartwatch Shipments Market Share (Q1 2022 – Q2 2023)
Brands
Q1 2022
Q2 2022
Q3 2022
Q4 2022
Q1 2023
Q2 2023
Apple
32%
27%
22%
37%
26%
22%
Samsung
10%
9%
12%
9%
9%
–
Huawei
7%
7%
7%
10%
Fire Boltt
–
–
–
–
9%
–
Noise
–
–
9%
–
–
10%
Others
50%
57%
56%
47%
56%
58%
Highlights:
The global smartwatch market’s shipments bounced back to increase by 11.1% YoY in Q2 2023 to reach 35 million. The previous two quarters had experienced a YoY decline.
While Apple and Samsung saw YoY declines of 10% and 19% respectively, Huawei and India’s top two brands – Noise and Fire-Boltt – recorded significant growth.
In terms of regional markets, India led the overall global gains as it more than offset declines in North America, Europe and the rest of Asia.
We also have a detailed smartwatch shipments model tracker available for subscribing clients:
Global Smartwatch Shipments by Model Quarterly Tracker, Q2 2023
This report analyses the shipments of smartwatches splitting them in ASPs, price bands and revenues. It also includes model and specs level analysis with a region split. This is a robust quarterly report with fact-based deep analysis that covers multiple dimensions and will help players across the smartwatch value chain to holistically analyze the current state of the global smartwatch market and plan ahead of competition.
The global smartwatch market increased by 11.1% YoY reaching 35million of quarterly shipments. This is a turnaround in three quarters after experiencing a YoY decline in the previous two quarters.
While Apple and Samsung saw YoY declines of 10% and 19% respectively, Huawei and India’s top two brands – Noise and Fire Boltt – recorded significant growth. By region, India led the overall global gains as it more than offset declines in North America, Europe and the rest of Asia.
This data represents the global smartwatch market share by quarter (from 2020-2023) by top brands. For detailed insights on the data/tracker, please reach out to us atcontact(at)www.arena-ruc.com.If you are a member of the press, please contact us atpress(at)www.arena-ruc.comfor any media enquiries.
Disclaimer: The data, charts and other visuals on this page are the exclusive property of Counterpoint Research. While we encourage free use and sharing of all the data on this page, we do request that you always attribute Counterpoint Research
In Q2 2023, global smartwatch shipments increased 11% YoY after declining for two successive quarters.
For the first time in two years, Huawei took the second spot, fueled by a 58% YoY surge in domestic shipments.
India’s market recorded a remarkable 70% YoY growth, whereas North America saw a 9% decline.
Seoul, New Delhi, Hong Kong, Beijing, London, Buenos Aires, San Diego – August 29, 2023
Global smartwatch shipments increased 11% YoY in Q2 2023 after declining in both Q4 2022 and Q1 2023, according to Counterpoint Research’s recently publishedGlobal Smartwatch Model Tracker.India’s shipments soared by 70% YoY, serving as the primary driver for the global market’s rebound. China’s market also recorded a modest increase. Besides, a shift in the competitive landscape was evident as Huawei ascended to the second position in terms of global market share.
Research Analyst Woojin Son年代aid, “Huawei recorded impressive growth in Q2 2023, securing the second position in quarterly shipments for the first time in two years. The leading Chinese brand’s growth stagnated for some time due to technological sanctions and a slowdown in its domestic market. Although the Chinese market’s recovery remained lukewarm, Huawei aggressively pushed new flagship products such as the Watch 4 series into the market in Q2, achieving its highest quarterly shipments after 2020. Huawei seems to be determined to bounce back in the market. It remains to be seen whether this momentum can be effectively expanded to other sectors, such as smartphones.”
Global Top 3 Smartwatch Brands’ Shipment Share, Q2 2023 vs Q2 2022
Apple年代aw a 10% YoY decline in its Q2 2023 shipments. This decline pushed its Q2 shipments to below 8 million units for the first time in three years. Consequently, Apple’s market share fell to 22% from 27% in Q2 2022.
Huaweimade big strides by increasing its domestic market share to 39% following a surge of 58% in shipments. This achievement propelled the brand to the second spot in the global smartwatch market share rankings. Another significant change was observed in the premium segment, especially in the >$500 band. Huawei’s products in the >$500 band in China expanded their share in the band to 52% in Q2 2023, a remarkable leap from the brand’s near-absence from the band in the same quarter of 2022.
Indian brandsNoiseandFire-Bolttemerged as major contenders, boasting 86% and 70% YoY growth, respectively. Within Noise’s offerings, products priced under $50 constituted a significant 98% of total shipments. Noise’s Colorfit Icon series managed to carve out a substantial 28% share of the total shipments. Fire-Boltt also made strides in expanding its market share by capitalizing on cost-effective smartwatches.
Samsungwitnessed a 19% YoY decline in Q2 2023. The brand managed to boost shipments in the Chinese and Indian markets. Samsung’s performance in North America and Europe, its pivotal markets, recorded 24% and 13% YoY declines, respectively.
Smartwatch Shipment Share by Region, Q2 2023 vs Q2 2022
In terms of regional shipment shares, India’s market stood at 34%, a 12% points surge compared to the year-ago period. In Q2 2023, 88% of India’s smartwatch shipments were dominated by products priced <$50. Leading the charge in this segment were Noise, Fire-Boltt and boAt, collectively contributing to 72% of India’s total shipments.
TheChinese market’s share declined due to the swift expansion of India’s market. However, China’s shipments grew 5% from Q2 2022. In terms of revenue, the share of products priced >$500 surged to around 34% in China.
In North America, there was an 9% YoY reduction in shipments in Q2 2023. However, the revenue saw a rise of around 3% due to the sustained popularity of high-end premium products. Nevertheless, North America’s share inglobal smartwatchrevenues declined, compared to both Q2 2022 and Q2 2021.
Background
Counterpoint Technology Market Research is a global research firm specializing in products in the TMT (technology, media, and telecom) industry. It services major technology and financial firms with a mix of monthly reports, customized projects, and detailed analyses of the mobile and technology markets. Its key analysts are seasoned experts in the high-tech industry.
Entry of Chinese brands stirring up regional market.
三星以36.9%的市场份额仍是区域领导人,followed by Motorola with 21.4% share.
Apple’s growth mainly sustained by the iPhone 11.
One in four smartphones shipped in the region is a 5G smartphone.
Buenos Aires, San Diego, Denver, New Delhi, Hong Kong, Seoul, London, Beijing – August 24, 2023
Smartphone年代hipments in Latin America (LATAM) dropped 15.6% YoY but climbed 2.4% QoQ in Q2 2023, according to the latest data fromCounterpoint Research’s Market Monitor年代ervice. The decline was due to the negative impacts of the regional economic crises and weak global smartphone shipments.
Commenting on the market dynamics,Principal Analyst Tina Lu年代aid, “LATAM’s economic growth in 2023 is actually slightly higher than forecast. However, this recovery has not yet inspired an increase in the rate of smartphone replacement. Lowconsumerdemand continued to affect the region during the quarter. Although most countries in the region are seeing declininginflation, consumer confidence is yet to bounce back, as political turmoil continues to constrain the general economy.”
Research Analyst Andres Silva added,“Seasonal factors such as Mother’s Day and Father’s Day promotions helped the market grow slightly QoQ in Q2 2023, although the market declined YoY. The entry of manyChinesebrands at once is stirring up the market as they aim for growth, pushing other brands to become more aggressive. However, the YoY decline affected all the top sixcountriesin the region.”
Top Smartphone OEMs’ Market Share in Latin America, Q2 2022 vs Q2 2023
Source: Counterpoint Research Q2 2023 Market Monitor Note: Figures may not add up to 100% due to rounding
Commenting on the ASP performance in the region,Lu added: “There is a slight premiumization trend going on in the region. Compared to last year, LATAM’s total smartphoneASPonly grew around 4%. This has been a consistent trend. Inflation has some influence on it. However, established brands such as Samsung are pushing to increase the ASP in the region with5Gmodels.”
Market Summary
Samsungwas once again the absolute leader in the LATAM market in Q2 2023. However, its年代hipmentsand market share declined YoY with weakened performance in most of the countries in the region.
Samsung has been very aggressive in offering extra discounts during the promotions. But not enough as its shipments were hurt by the Brazilian market and the entry ofChinesebrands.
Since Samsung is focusing more on premium models now, the availability of its models in the lower price bands is becoming restricted. Thus, its overall value dropped -2% YoY.
Motorola’s shipments decreased YoY but its market share increased slightly. It increased the number of models in the entry-segment E series. It also increased its brand awareness with the launch of theMotorolaEdge 40 Pro in May with an aggressive advertising campaign.
Xiaomi lost share slightly during the quarter but remained stable due to the launch of the Redmi Note 12 during the first week of April. This increased its Q2 2023 shipments and sales.Xiaomialso increased its Poco brand shipments in the open channels in the region.
Xiaomi recovered slightly from its position in Mexico. The participation of the grey market in the southern part of the LATAM region continued to grow.
Apple’s年代hipments and market share both grew YoY in Q2 2023, mainly sustained by the iPhone 11. The4G年代martphones are still driving Apple’s volume in the region.
OPPOcontinued to be a strong fifth player in the region and ranked third in Mexico. Its volume increased by more than 70% in Q2 2023, while its share more than doubled YoY. Despite the growth, its shipments dropped QoQ.
HONOR did not make it to the list, but its growth in LATAM has been notable.HONORwas the brand with the most aggressive growth during the quarter. However, it still needs to build on its branding.
“Others”, mainly composed of regional brands, continued to decrease YoY. This category was most affected by the entry of low-price-band Chinese brands.
Background
Counterpoint Technology Market Research is a global research firm specializing in products in the technology, media and telecom (TMT) industry. It services major technology and financial firms with a mix of monthly reports, customized projects and detailed analyses of the mobile and technology markets. Its key analysts are seasoned experts in the high-tech industry.
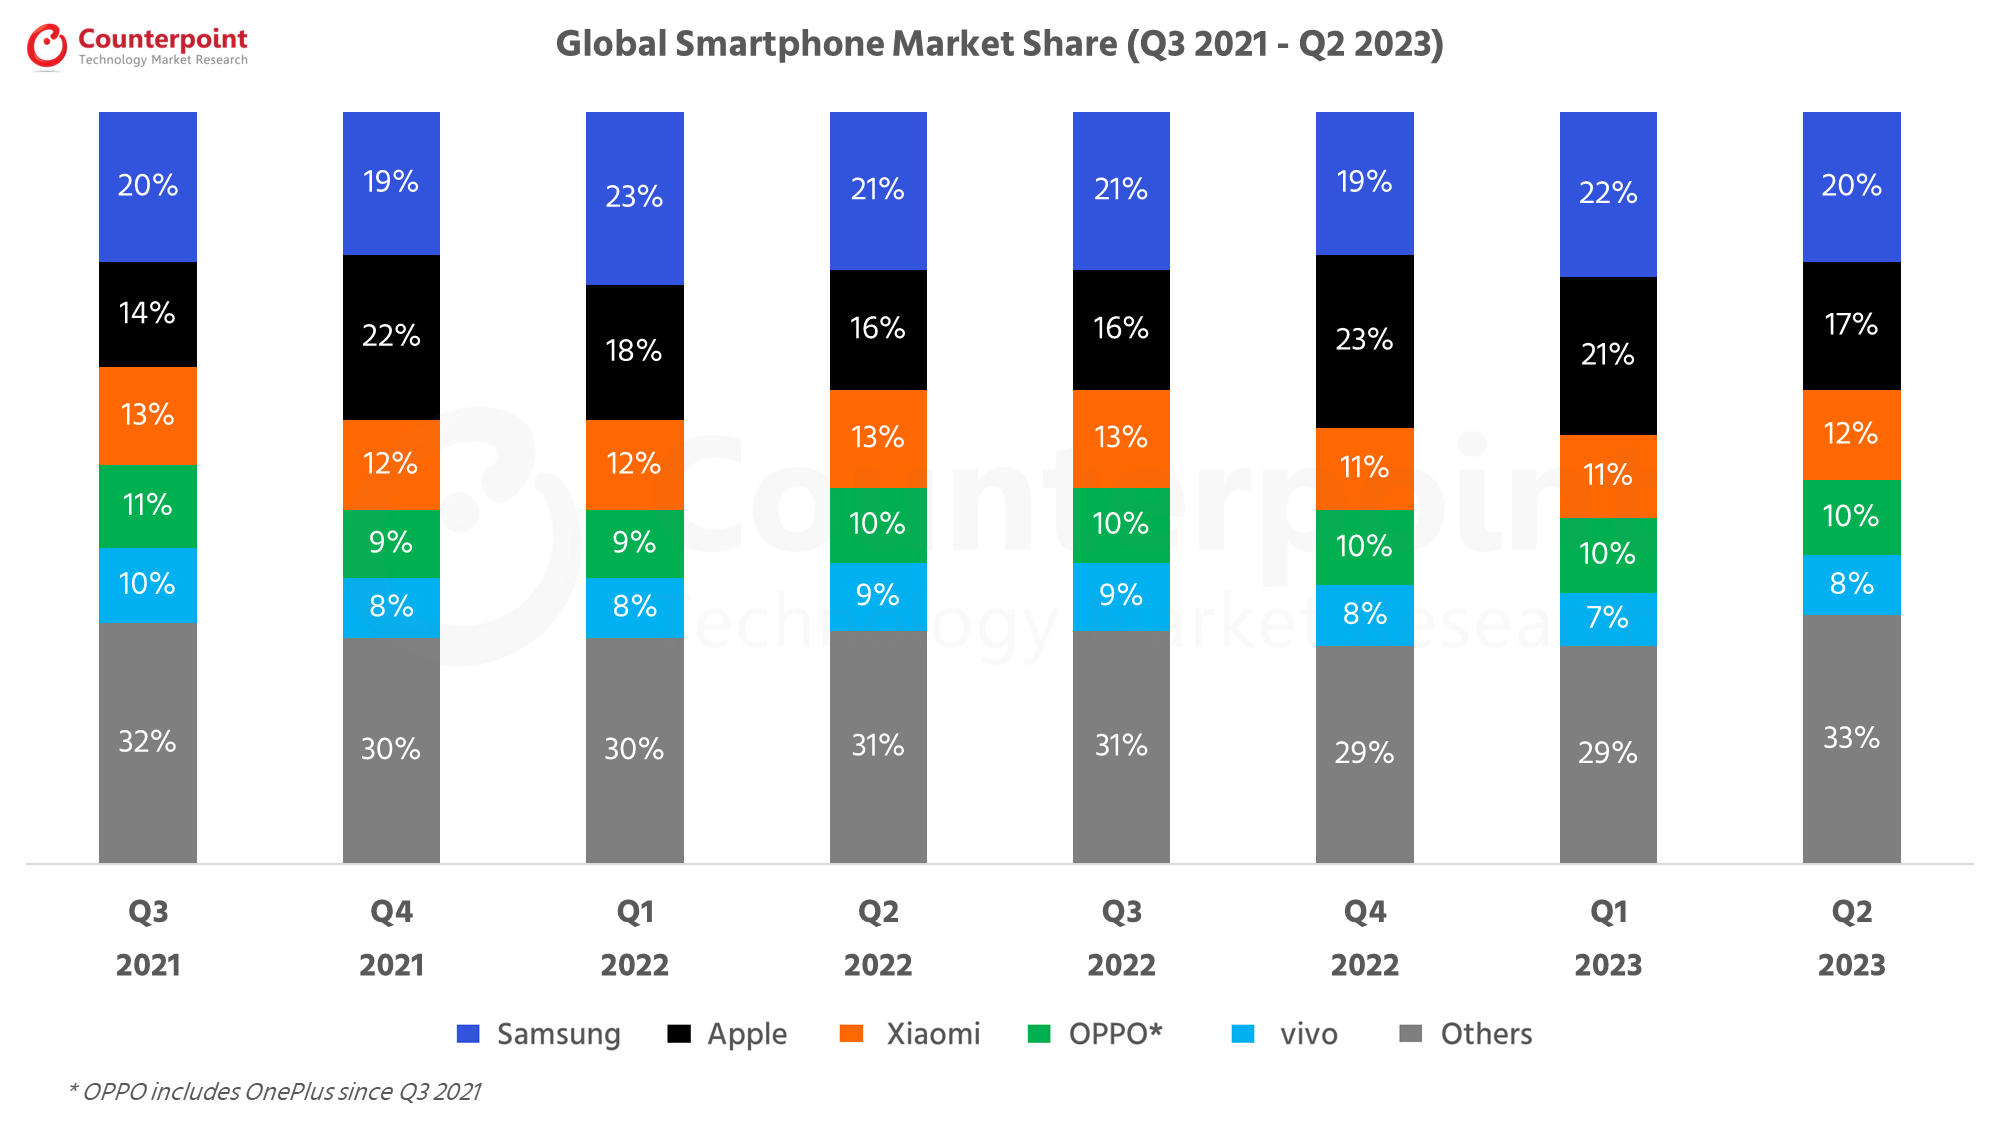
Global Smartphone Shipments Market Data (Q3 2021 – Q2 2023)
Published Date: August 17, 2023
A repository of quarterly data for the global smartphone market. This data is a part of a series of reports which track the mobile handset market:Smartphone and Feature Phone shipmentsevery quarter for more than 140 brands covering more than 95% of the totaldevice shipmentsin the industry.
Global smartphone market share Q2 2023 highlights:
The global smartphone market declined by 9% YoY to reach 268 million units in Q2 2023.
Samsung retained its position as the top smartphone player in Q2 2023, as Apple saw cyclical decline.
Among the top five brands, Apple experienced the least YoY shipment decline. Among the top 10 brands, Tecno and Infinix, part of the Transsion Group, saw double digit annual growth.
In terms of regional performance, Middle East and Africa (MEA) exhibited the only annual shipment growth while North America experienced the highest decline.
The top 5 brands contributed to almost 80% of the total 5G shipments in Q2 2023.
The global smartphone market share numbers are from:
MOBILE DEVICES MONITOR – Q2 2023 (Vendor Region Countries)
This report is part of a series of reports which track the mobile handset market: Smartphone and Feature Phone shipments every quarter for more than 140 brands covering more than 95% of the total device shipments in the industry.
The deliverable includes
• Single pivot format giving in-depth analysis of theglobal handset market • Covers140 +品牌now in comparison to 95 brands earlier • Break out of3 key countriesin each regionto give a further granular view of the regions •18 countries viewas compared to six earlier • Covers more than95% of the global handset shipments • More visuals and analysis by country and by regions
This robust quarterly report with fact-based deep analysis covering multiple dimensions will help players across the handset value chain to holistically analyze the current state of the global handset market and plan ahead of the competition.
This data represents the global smartphone market share by quarter (from 2021-2023) by top OEMs. Global smartphone shipments by market share and millions of units are provided.
For detailed insights on the data, please reach out to us at年代ales(at)www.arena-ruc.com.If you are a member of the press, please contact us atpress(at)www.arena-ruc.comfor any media enquiries.
Q1 2023 Highlights
Published Date: May 9, 2023
Highlights:
The global smartphone market declined by 14% YoY and 7% QoQ to record 280.2 million unit shipments in Q1 2023.
Samsung replaced Apple as the top smartphone player in Q1 2023, driven by its mid-tier A Series and the recently launched S23 series.
Apple’s YoY shipment decline was the least among the top five brands. Consequently, it recorded its highest-ever Q1 share of 21%.
Global smartphone revenues declined by 7% YoY to around $104 billion. Apple, Samsung, Xiaomi increased their Average Selling Prices YoY.
*OPPO includes OnePlus since Q3 2021 **Ranking is according to the latest quarter.
Frequently asked question (FAQs):
• What’s the global market size for smartphones? The global smartphone market shipments declined to reach 280.2 million units in Q1 2023.
• What is the global market for mobile phones? The 2022 global smartphone shipments declined to 1.2 billion units, the lowest since 2013.
• Who dominates the smartphone market? Apple dominated the smartphone market in 2022 by achieving its highest-ever global shipments, revenue and operating profit share.
• How fast is the smartphone market growing? The global smartphone shipments declined by 12% in 2022.
*OPPO includes OnePlus since Q3 2021 **Ranking is according to the latest quarter.
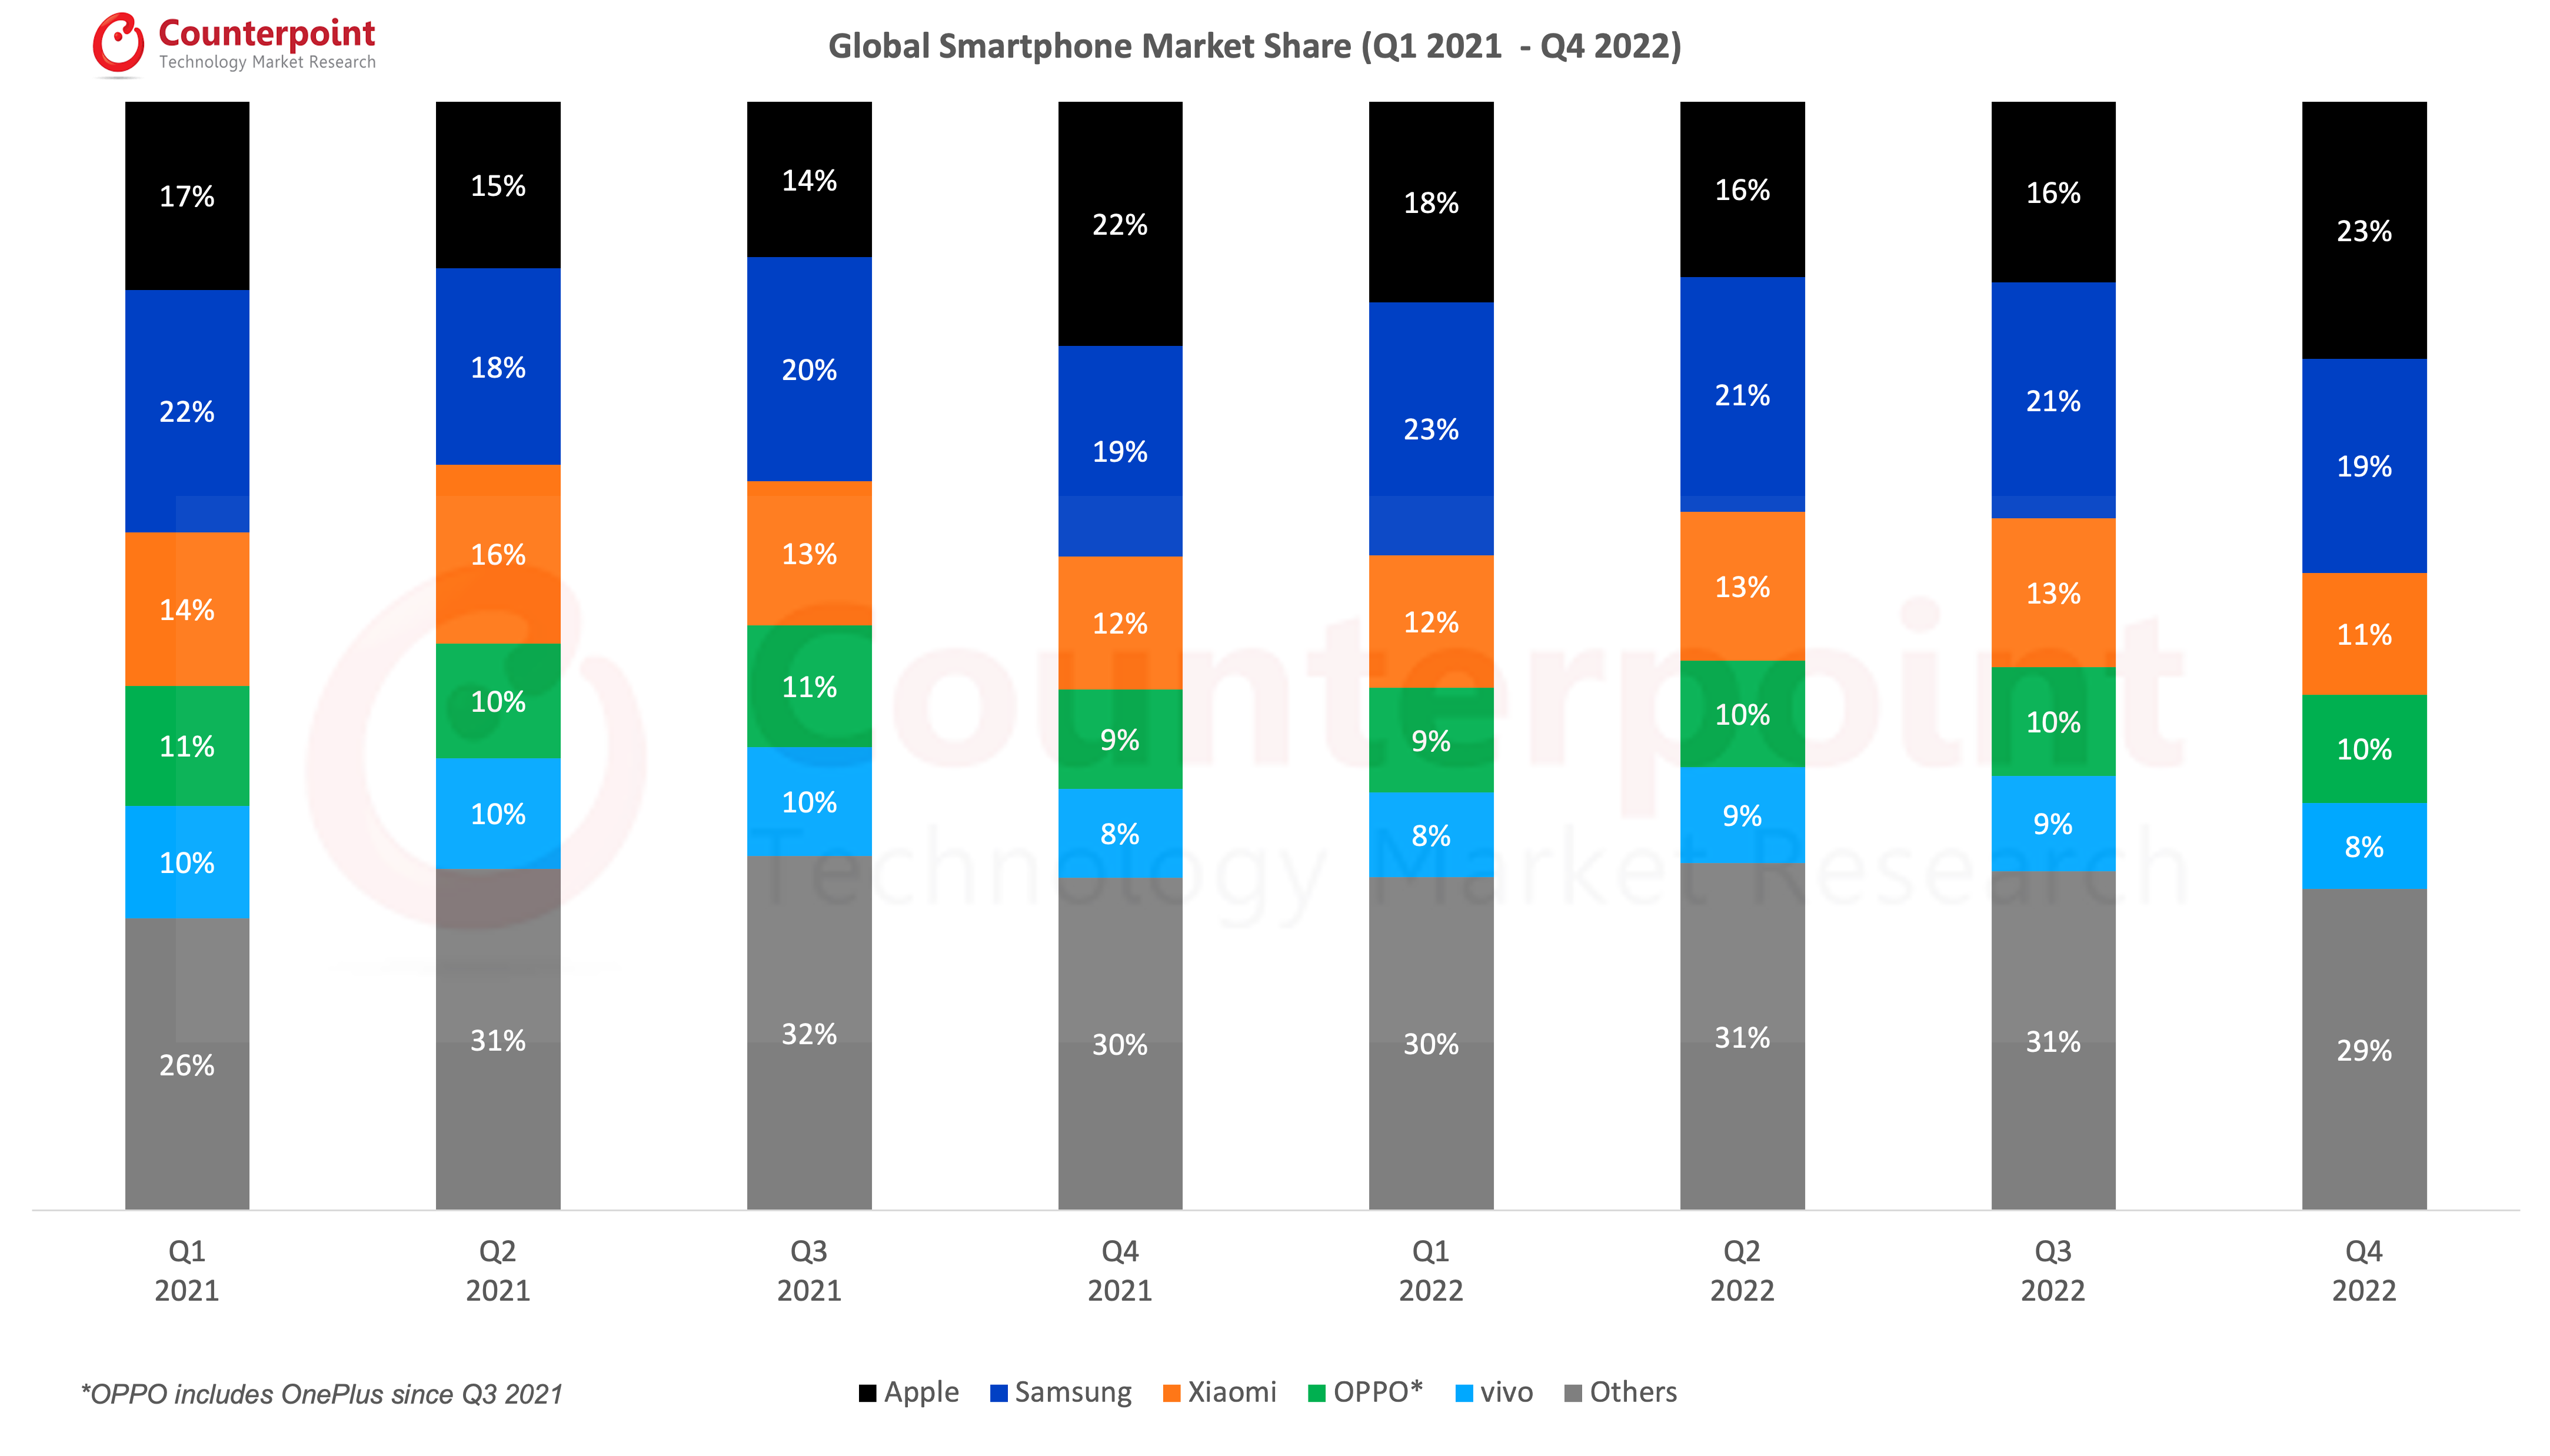
Q3 2022 Highlights
Published Date: December 20, 2022
The global smartphone market declined by 12% YoY even as it grew by 2% QoQ to reach 301 million units in Q3 2022.
While quarterly growth in Apple and Samsung pushed the global smartphone market above 300 million units, a level it failed to reach last quarter, political and economic instability drove negative consumer sentiment.
Apple was the only top-five smartphone brand to grow YoY, with shipments increasing 2% YoY, growing market share by two percentage points to 16%.
Samsung’s shipments declined by 8% YoY but grew 5% QoQ to 64 million.
Xiaomi, OPPO* and vivo, recovered slightly after receiving heavy beatings due to lockdowns in China in Q2, and as they captured more of the market ceded by Apple and Samsung’s exit from Russia.
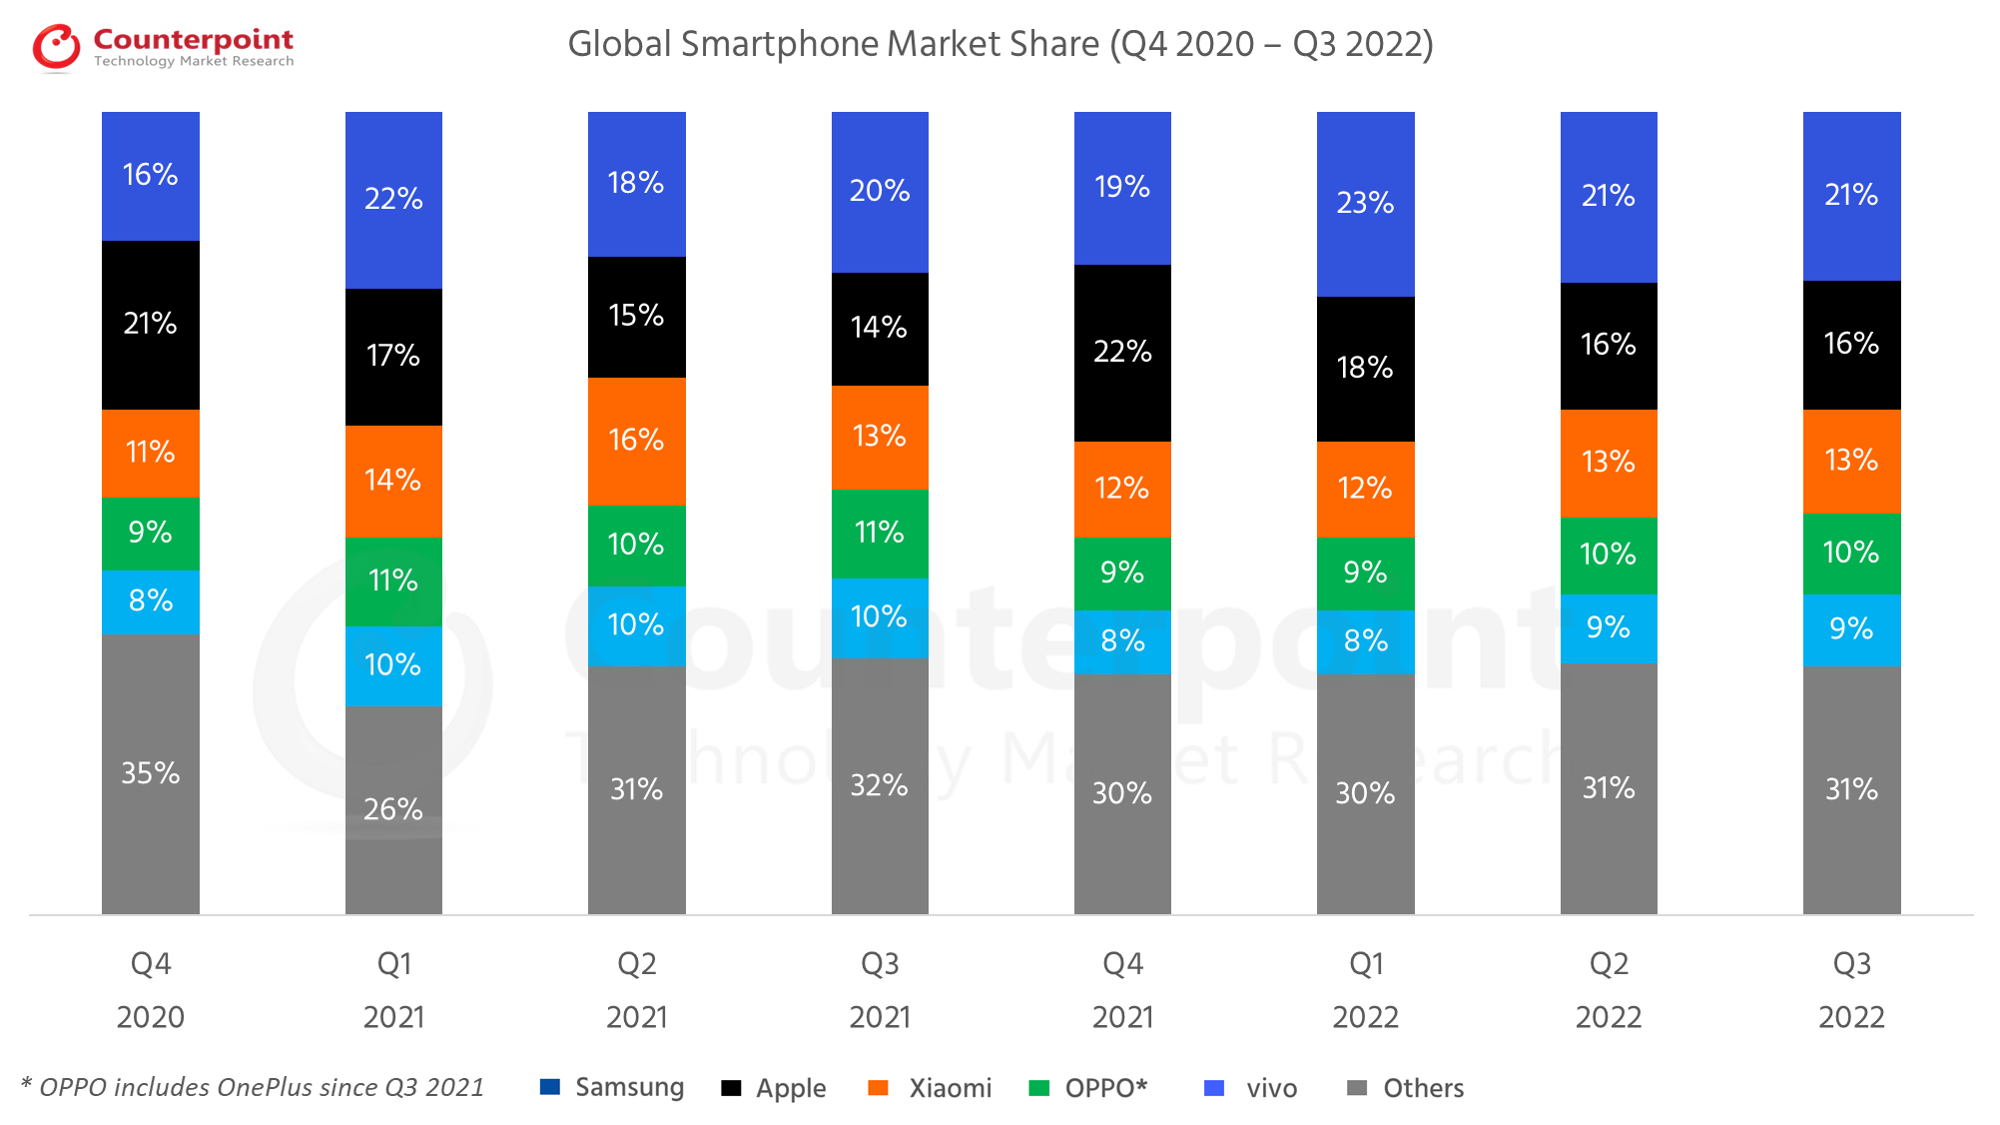
Global Smartphone Shipments Market Share (%)
Brands
Q4 2020
Q1 2021
Q2 2021
Q3 2021
Q4 2021
Q1 2022
Q2 2022
Q3 2022
Samsung
16%
22%
18%
20%
19%
23%
21%
21%
Apple
21%
17%
15%
14%
22%
18%
16%
16%
Xiaomi
11%
14%
16%
13%
12%
12%
13%
13%
OPPO*
9%
11%
10%
11%
9%
9%
10%
10%
vivo
8%
10%
10%
10%
8%
8%
9%
9%
Others
35%
26%
31%
32%
30%
30%
31%
31%
Global Smartphone Shipments(in Millions)
Brands
Q4 2020
Q1 2021
Q2 2021
Q3 2021
Q4 2021
Q1 2022
Q2 2022
Q3 2022
Samsung
62.5
76.6
57.6
69.3
69.0
74.5
62.5
64.3
Apple
81.9
59.5
48.9
48.0
81.5
59.0
46.5
49.2
Xiaomi
43.0
48.5
52.5
44.4
45.0
39.0
39.5
40.5
OPPO*
34.0
38
33.6
38.1
33.9
30.9
28.2
29.5
vivo
33.4
35.5
32.5
33.7
29.3
24.8
25.2
26.0
Others
139.8
96.8
98.0
108.5
112.7
98.1
92.3
92.4
Total Market
394.6
354.9
323.1
342.0
371.4
326.4
294.5
301.9
*OPPO includes OnePlus since Q3 2021 **Ranking is according to the latest quarter.
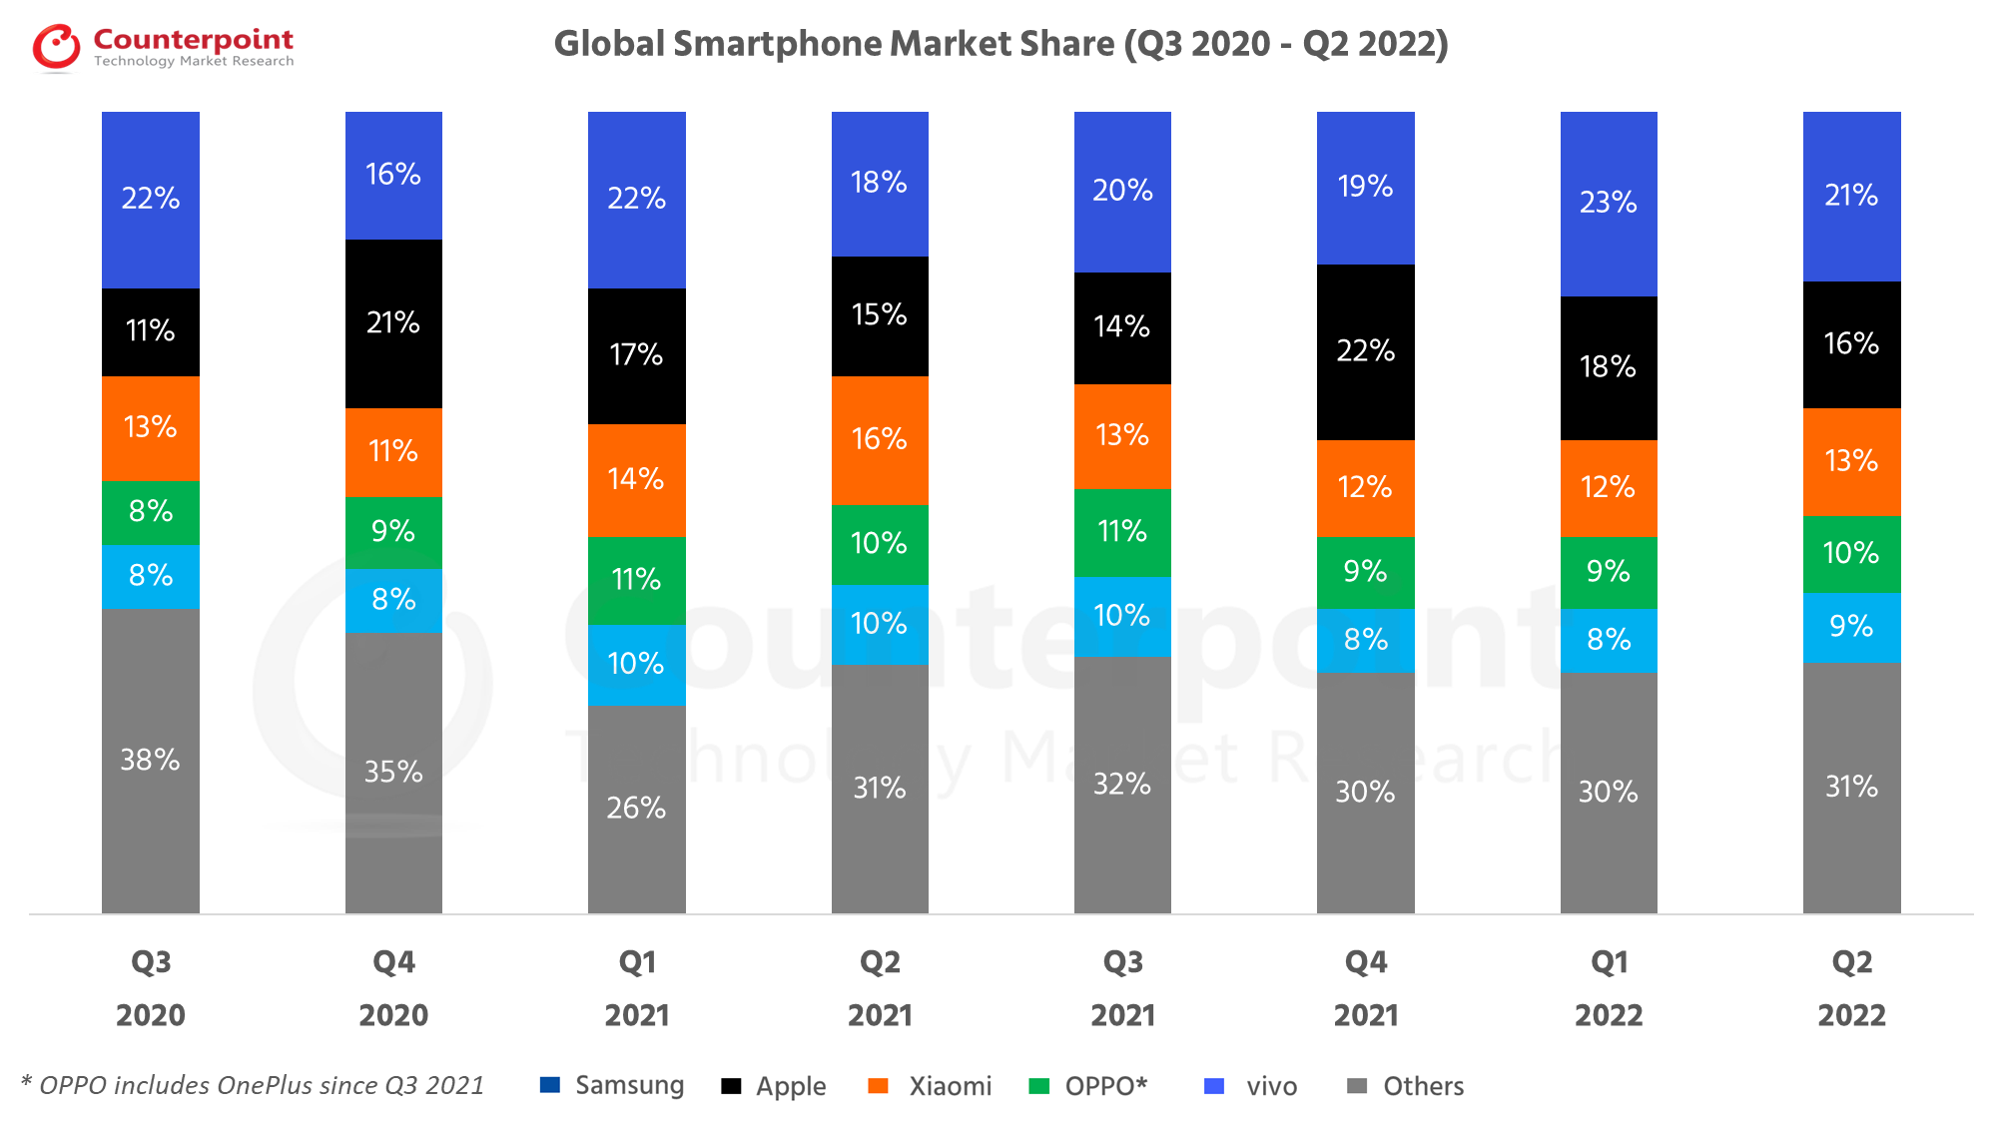
Q2 2022 Highlights
Published Date: August 16, 2022
• The global smartphone market growth saw a decline of 9% YoY and 10% QoQ to 294.5 million units in Q2 2022. • Global smartphone market share carries on consolidation, with top three brands commanding 50% share for three consecutive quarters. • This was the first time quarterly shipments dropped below 300 million units since Q2 2020 during the early part of the COVID-19 pandemic. • Samsung was the only top-five smartphone brand to grow YoY, increasing shipments by 8% YoY and growing market share by three percentage points to 21%. • Apple market share declined by 5% YoY in Q2 2022, although its share increased in a diminished market. • iPhone shipment market share continues to edge upwards, with Apple reaching its highest Q2 2022 shipment share ever • The Android vs iOS market share battle, traditionally contested by Apple in the US, Europe and Japan, is intensifying in markets like China, which is becoming a significant driver of iOS installed based globally. • Xiaomi, OPPO* and vivo, hit by China lockdowns, suffered double digit YoY declines in their respective shipments.
Global Smartphone Shipments Market Share (%)
Brands
Q3 2020
Q4 2020
Q1 2021
Q2 2021
Q3 2021
Q4 2021
Q1 2022
Q2 2022
Samsung
22%
16%
22%
18%
20%
19%
23%
21%
Apple
11%
21%
17%
15%
14%
22%
18%
16%
Xiaomi
13%
11%
14%
16%
13%
12%
12%
13%
OPPO*
8%
9%
11%
10%
11%
9%
9%
10%
vivo
8%
8%
10%
10%
10%
8%
8%
9%
Others
38%
35%
26%
31%
32%
30%
30%
31%
Global Smartphone Shipments(in Millions)
Brands
Q3 2020
Q4 2020
Q1 2021
Q2 2021
Q3 2021
Q4 2021
Q1 2022
Q2 2022
Samsung
80.4
62.5
76.6
57.6
69.3
69.0
74.5
62.5
Apple
41.7
81.9
59.5
48.9
48.0
81.5
59.0
46.5
Xiaomi
46.5
43.0
48.5
52.5
44.4
45.0
39.0
39.5
OPPO*
31.0
34.0
38.0
33.6
38.1
33.9
30.9
28.2
vivo
31.0
33.4
35.5
32.5
33.7
29.3
24.8
25.5
Others
135.0
139.8
96.8
98.0
108.5
112.7
98.2
92.3
Total Market
365.6
394.6
354.9
323.1
342.0
371.4
326.4
294.5
*OPPO includes OnePlus since Q3 2021 **Ranking is according to the latest quarter.
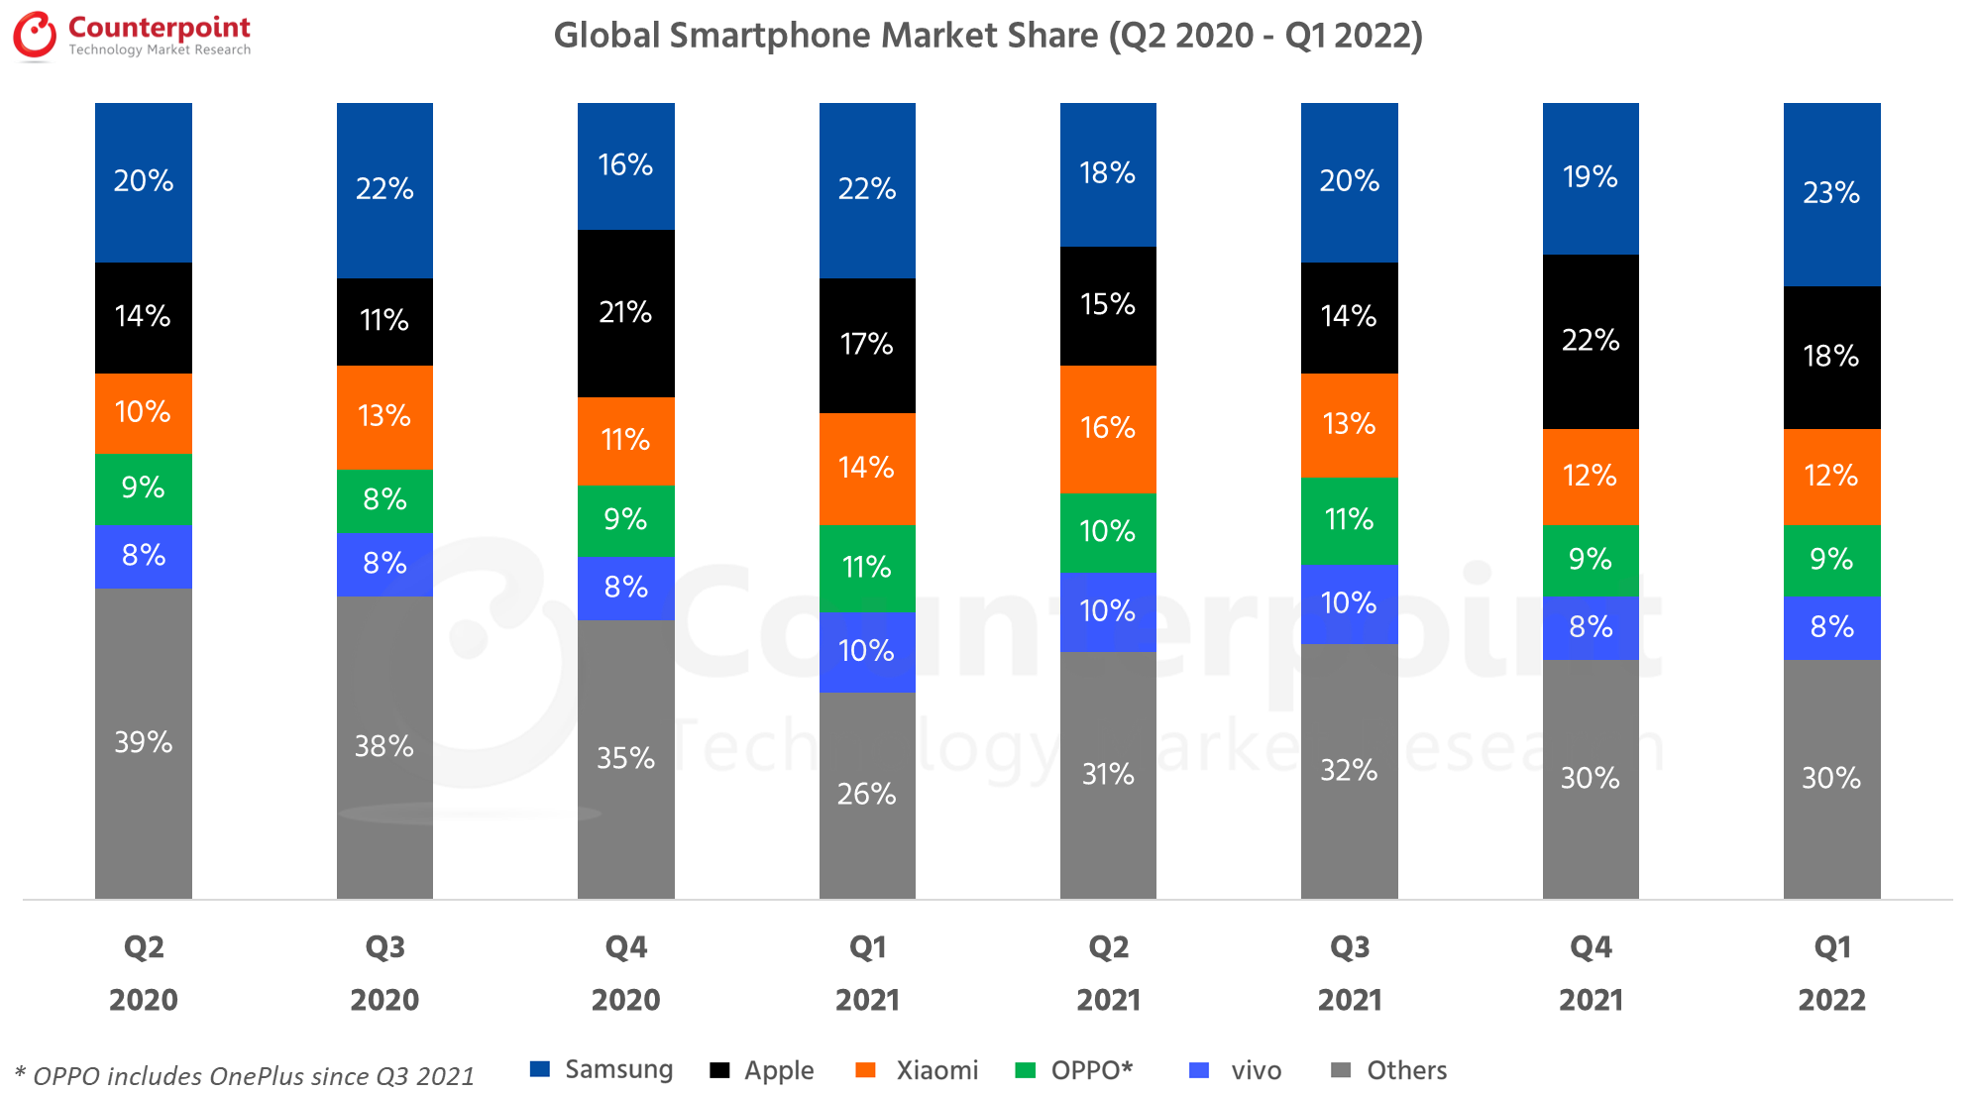
Q1 2022 Highlights
Published Date: May 16, 2022
•全球智能手机市场同比下降了7%and 12% QoQ to 328 million units in Q1 2022. • While Samsung’s shipments declined 3% YoY, it was the only top-five smartphone brand to grow QoQ. Its market share rose to 23% from 19% last quarter, resulting in Samsung taking the top spot from Apple in Q1 2022. • Apple’s shipments declined by 1% annually to reach 59 million units in Q1 2022. This was after an expected seasonal quarterly shipment decline of 28%. • Xiaomi, OPPO* and vivo’s component struggles continued, causing a quarterly and annual decline in their respective shipments.
Global Smartphone Shipments Market Share (%)
Brands
Q2 2020
Q3 2020
Q4 2020
Q1 2021
Q2 2021
Q3 2021
Q4 2021
Q1 2022
Samsung
20%
22%
16%
22%
18%
20%
19%
23%
Apple
14%
11%
21%
17%
15%
14%
22%
18%
Xiaomi
10%
13%
11%
14%
16%
13%
12%
12%
OPPO*
9%
8%
9%
11%
10%
11%
9%
9%
vivo
8%
8%
8%
10%
10%
10%
8%
8%
Others
39%
38%
35%
26%
31%
32%
30%
30%
Global Smartphone Shipments (in Millions)
Brands
Q2 2020
Q3 2020
Q4 2020
Q1 2021
Q2 2021
Q3 2021
Q4 2021
Q1 2022
Samsung
54.2
80.4
62.5
76.6
57.6
69.3
69.0
74.5
Apple
37.5
41.7
81.9
59.5
48.9
48.0
81.5
59.0
Xiaomi
26.5
46.5
43.0
48.5
52.5
44.4
45.0
39.0
OPPO
24.5
31.0
34.0
38.0
33.6
38.1
33.9
30.9
vivo
22.5
31.0
33.4
35.5
32.5
33.7
29.3
24.8
Others
110.9
135.0
139.8
96.8
98.0
108.5
112.7
98.1
Total Market
276.1
365.6
394.6
354.9
323.1
342.0
371.4
326.4
*OPPO includes OnePlus since Q3 2021 **Ranking is according to the latest quarter.
Why is the smartphone market declining in Q1 2022?
The global smartphone market growth saw a decline of 7% YoY, shipping 328 million units in Q1 2022 caused by the ongoing component shortages, as well as COVID resurgence at the beginning of the quarter and the Russia-Ukraine war towards the end. The global smartphone market also, as expected, had a seasonal decline of 12% QoQ. The component supply crunch was felt more severely by major Chinese OEMs such as Xiaomi, OPPO* and vivo as compared with Samsung, which seems to have overcome component shortages that affected its supply last year, as evidenced by higher-than-expected growth in its shipments despite a late flagship launch.
Consequently, Samsung regained the top spot from Apple which had emerged as the biggest smartphone vendor globally in Q4 2021 thanks to its latest iPhone 13 series.
Which country has the highest market share of smartphones globally?
With its share at around 22.5% of the global smartphone shipments in Q1 2022,Chinaremains the world’s biggest smartphone market. This is down from around 25.6% in Q1 2021 as China’s economy grew slower than expected due to COVID-related lockdowns and shipment volumes declined by over 19% YoY. While China’s share of global smartphone market growth (shipments) remains flat QoQ thanks to a small peak in demand during Chinese New Year and as the global smartphone market declined QoQ due to seasonality, in terms of absolute shipments, China saw a quarterly decline of over 12%.
荣誉已成为最大的智能手机玩家in China, chipping into vivo and OPPO*’s shares and stepping into the position previously held by Huawei from which it recently separated. Although vivo did not succeed in regaining the top position due to HONOR’s rise at a time when it is itself facing component shortages, it did recover somewhat thanks to its newly launched mid-end S12 series that is popular with younger customers and the affordable the Y series which showed strong performance in the quarter.
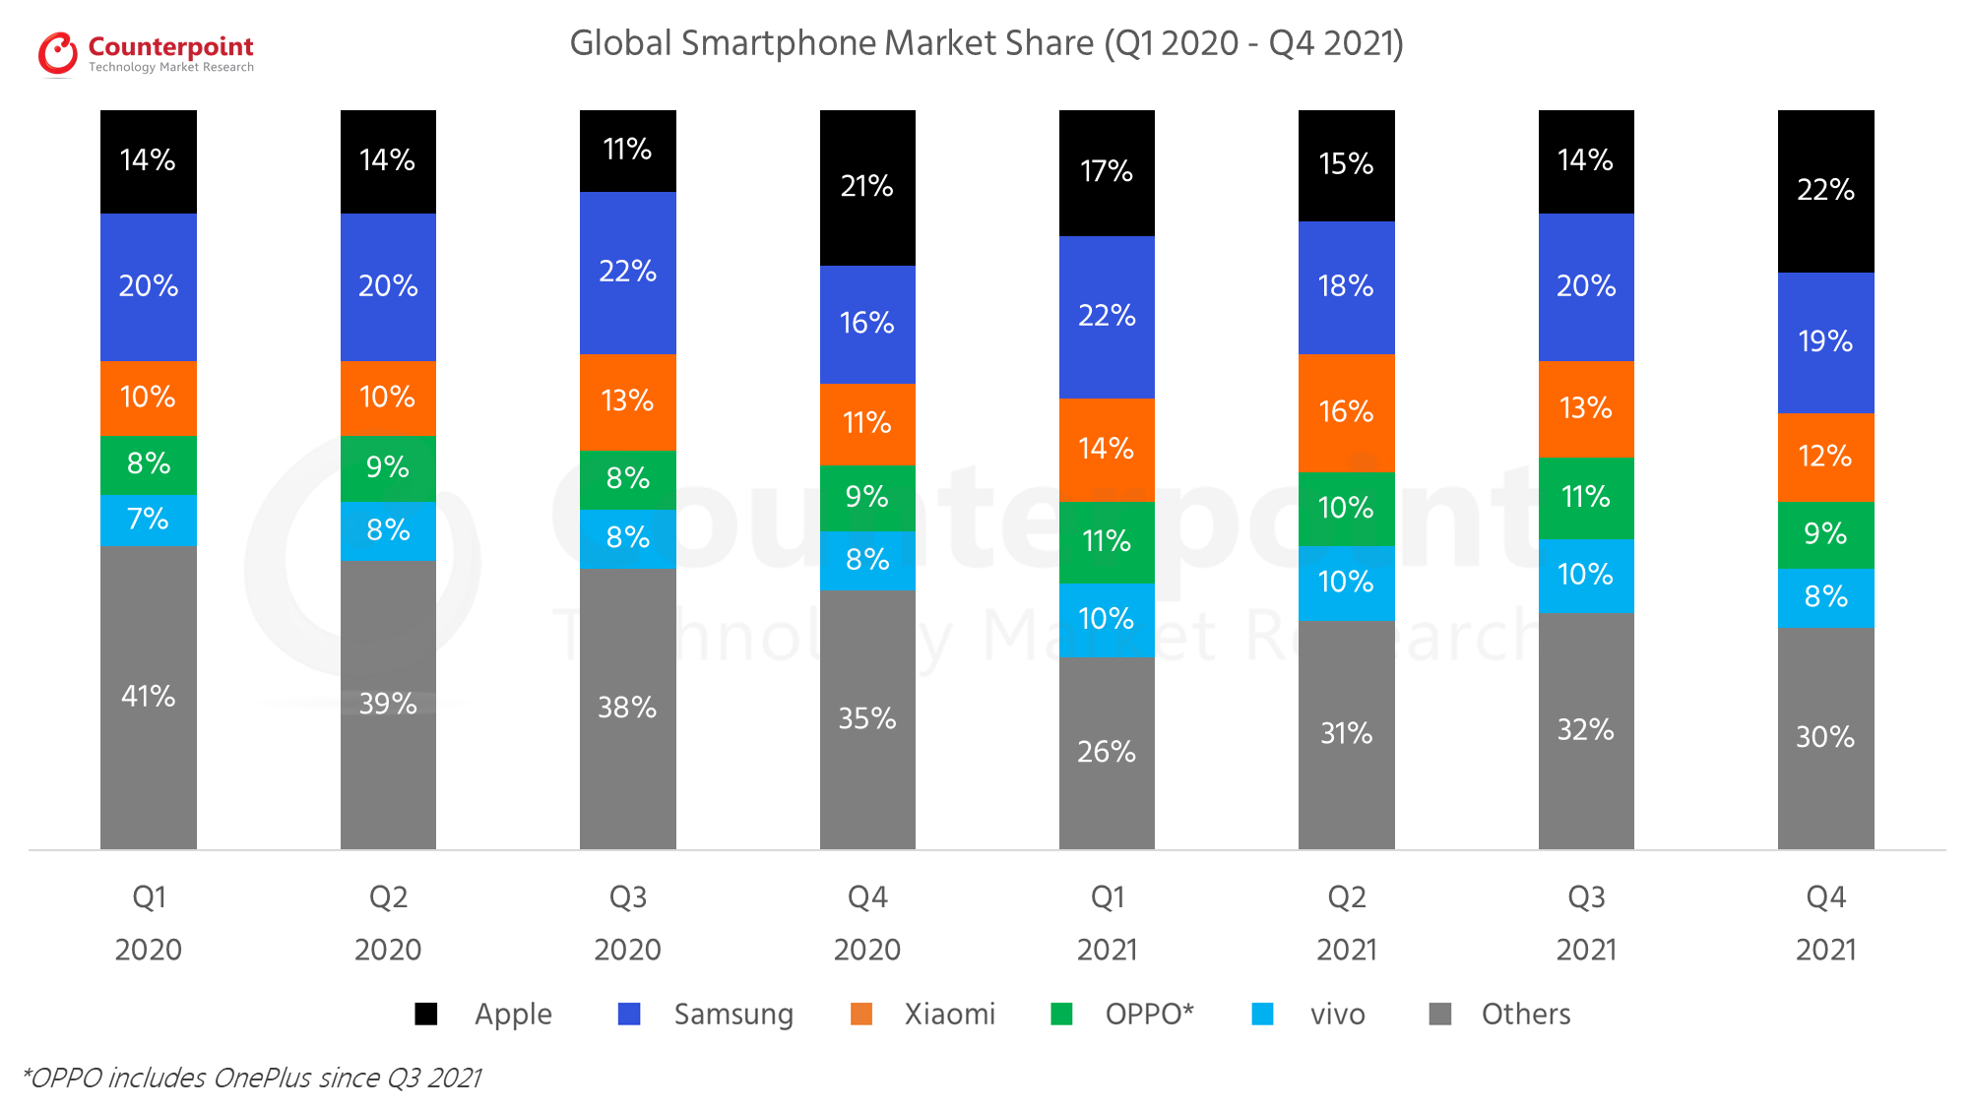
Q4 2021 Highlights
Published Date: February 16, 2022
• Global smartphone market growth saw an increase of 4% YoY to reach 1.39 billion units in 2021. Q4 2021 shipments declined 6% YoY to reach 371 million units. • Samsung led the global smartphone market in 2021 with annual shipments of 272 million units. • Apple, Xiaomi, OPPO^ and vivo recorded their highest-ever annual shipments. • The top five brands gained share due to a significant decline by Huawei, and LG’s exit from the market. • Apple surpassed Samsung to take the number one spot in Q4 2021 with smartphone shipments increasing by 70% QoQ to 81.5 million units in Q4 2021, despite remaining flat YoY. • Apple recorded their highest-ever annual shipments of 237.9 million units in 2021 driven by successful launch of iPhone 13 series and consistent performance of iPhone 12 series.
Global Smartphone Shipments Market Share (%)
Brands
Q1 2020
Q2 2020
Q3 2020
Q4 2020
Q1 2021
Q2 2021
Q3 2021
Q4 2021
Apple
14%
14%
11%
21%
17%
15%
14%
22%
Samsung
20%
20%
22%
16%
22%
18%
20%
19%
Xiaomi
10%
10%
13%
11%
14%
16%
13%
12%
OPPO*
8%
9%
8%
9%
11%
10%
11%
9%
vivo
7%
8%
8%
8%
10%
10%
10%
8%
Others
41%
39%
38%
35%
26%
31%
32%
30%
Global Smartphone Shipments (in Millions)
Brands
Q1 2020
Q2 2020
Q3 2020
Q4 2020
Q1 2021
Q2 2021
Q3 2021
Q4 2021
Apple
40.0
37.5
41.7
81.9
59.5
48.9
48.0
81.5
Samsung
58.6
54.2
80.4
62.5
76.6
57.6
69.3
69.0
Xiaomi
29.7
26.5
46.5
43.0
48.5
52.5
44.4
45.0
OPPO*
22.3
24.5
31.0
34.0
38.0
33.6
38.1
33.9
vivo
21.6
22.5
31.0
33.4
35.5
32.5
33.7
29.3
Others
122.8
110.9
135.0
139.8
96.8
98.0
108.5
112.7
Total Market
295.0
276.1
365.6
394.6
354.9
323.1
342.0
371.4
*OPPO includes OnePlus since Q3 2021 **Ranking is according to the latest quarter.
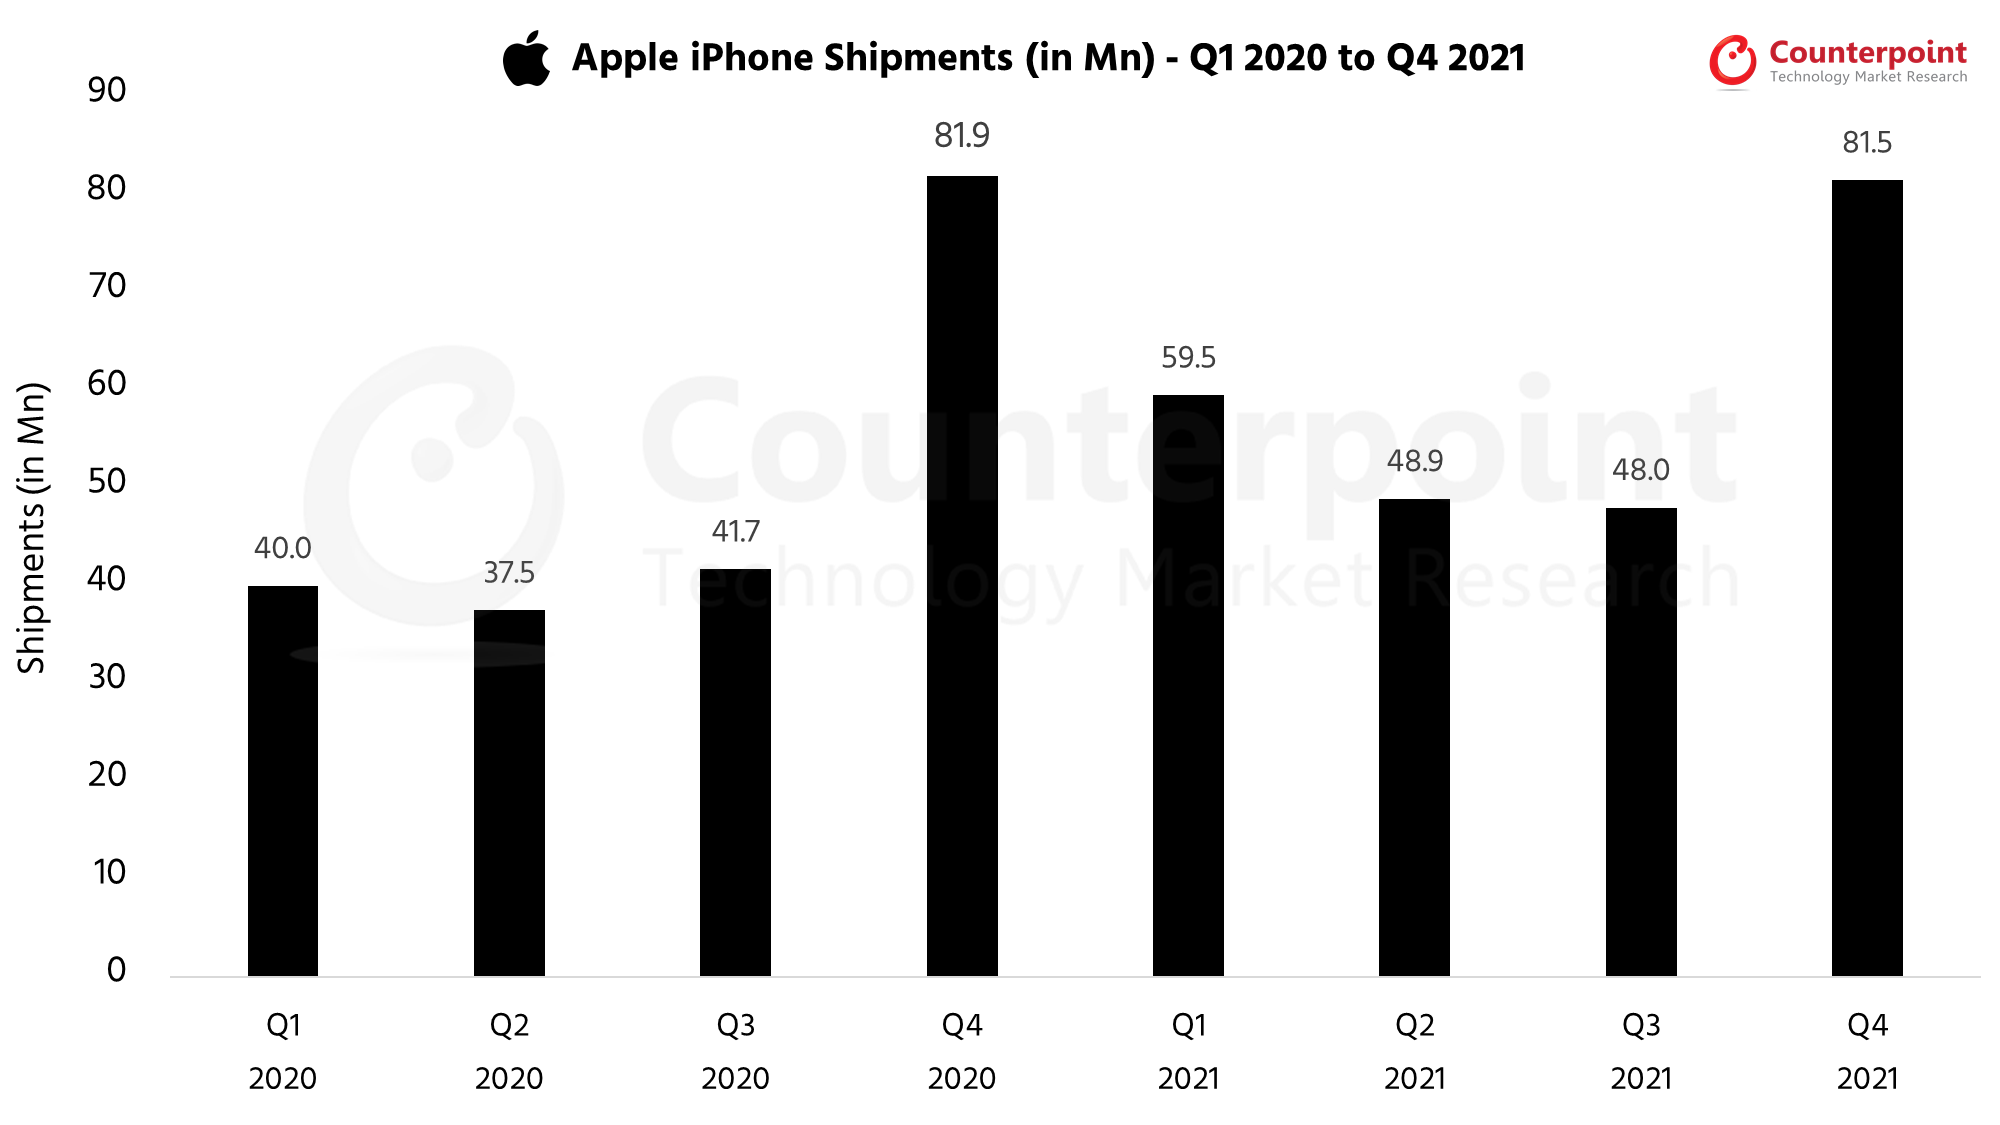
Apple Market Share: Q4 2021
Apple Market Share (iPhone Shipments in Millions)
Quarter
Q1 2020
Q2 2020
Q3 2020
Q4 2020
Q1 2021
Q2 2021
Q3 2021
Q4 2021
Ship-ments (in Mn)
40.0
37.5
41.7
81.9
59.5
48.9
48.0
81.5
Q3 2021 Highlights
Published Date: November 16, 2021
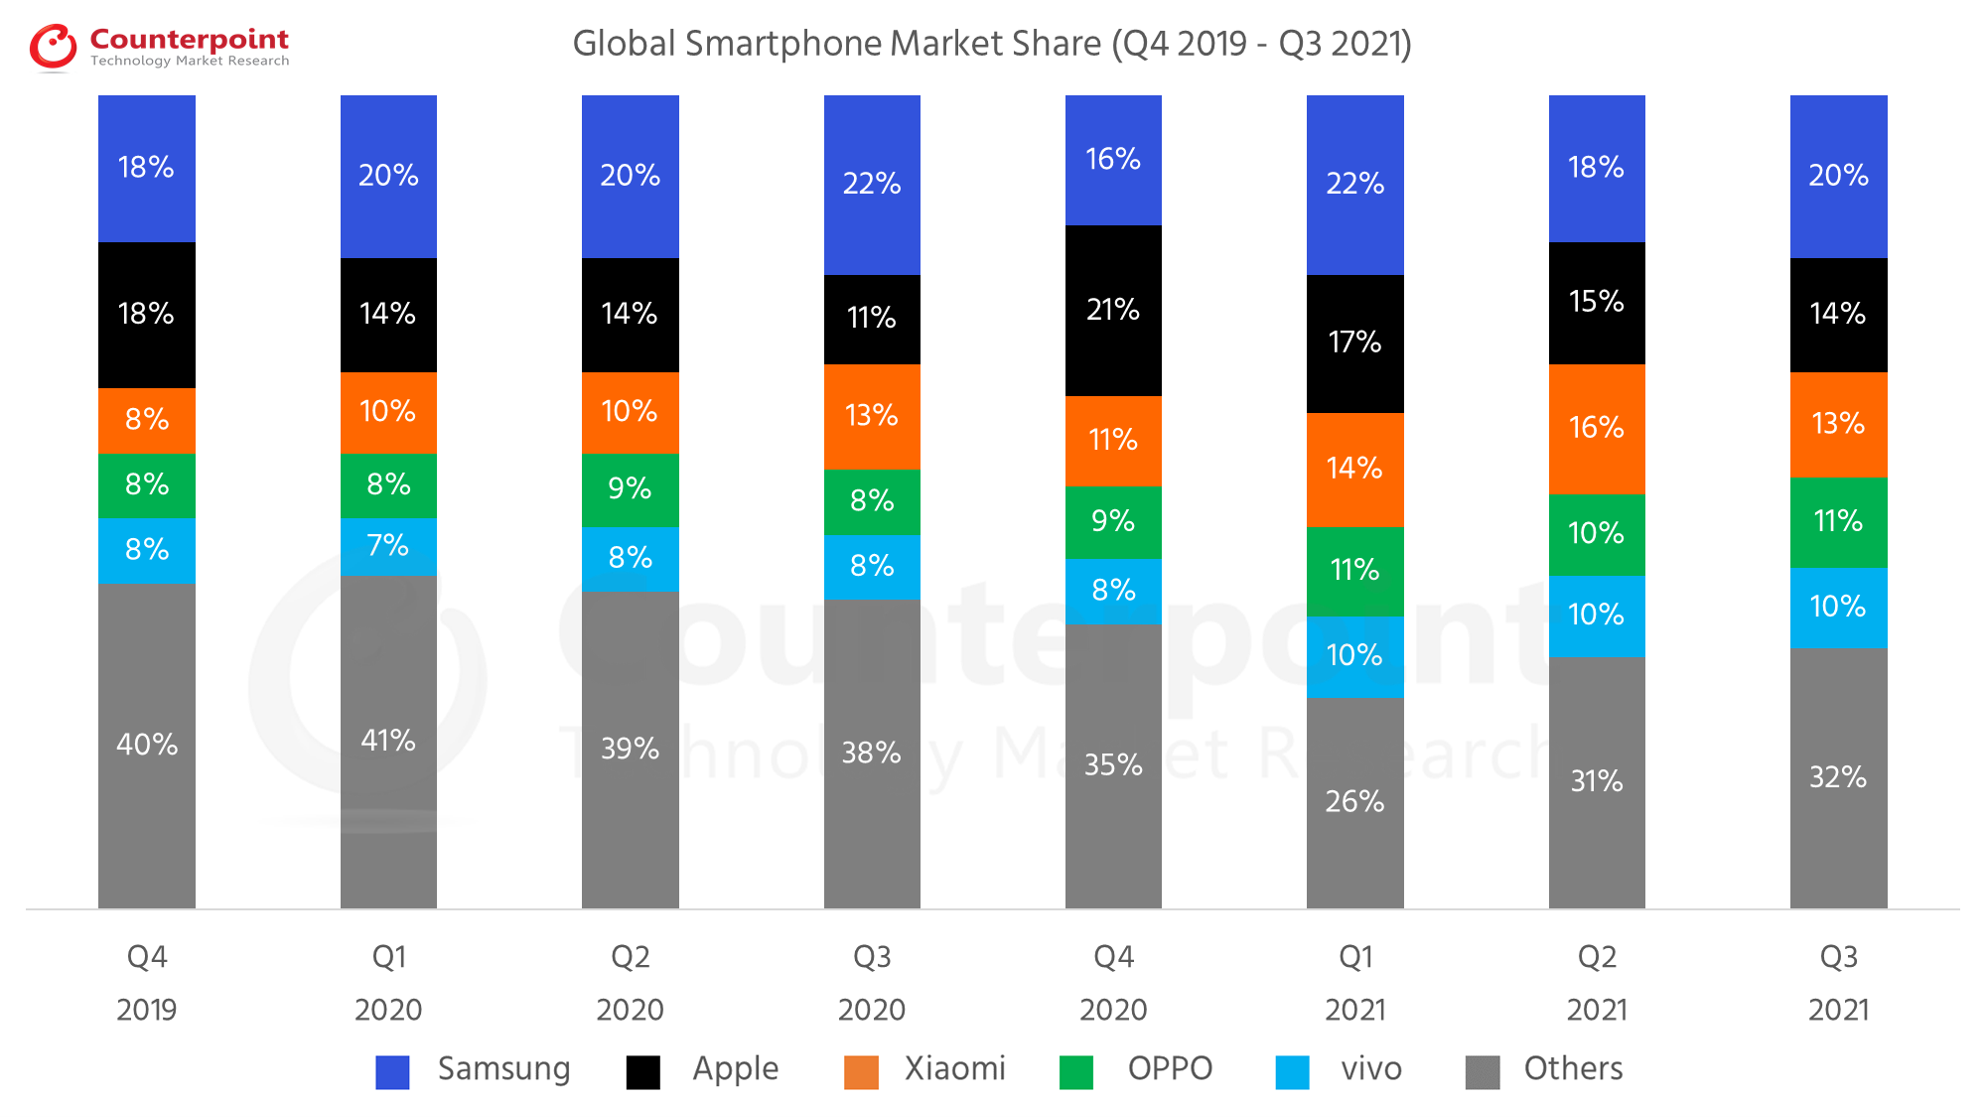
• The global smartphone market growth saw an increase of 6% QoQ but declined by 6% YoY in Q3 2021, clocking global shipments of 342 million units, down from 365.6 million in Q3 2020. • Samsung retained the number one spot in Q3 2021 with smartphone shipments increasing by 20% QoQ to 69.3 million units in Q3 2021. • Xiaomi shipped 44.4 million units in Q3 2021, down 5% YoY and 15% QoQ as it was severely hit by the ongoing component shortages. • vivo grew 8% YoY and 3% QoQ to reach 33.7 million units. vivo continued to lead China’s smartphone market with 17.3 million units in Q3 2021. • realme achieved its highest-ever shipment performance with 16.2 million units in Q3 2021. The record quarter came at a time when component shortages were at their peak. • Global handset market wholesale revenue grew 10% YoY and 6% QoQ in Q3 2021 to reach over $103 billion.
Global Smartphone Shipments Market Share (%)
Brands
Q4 2019
Q1 2020
Q2 2020
Q3 2020
Q4 2020
Q1 2021
Q2 2021
Q3 2021
Samsung
18%
20%
20%
22%
16%
22%
18%
20%
Apple
18%
14%
14%
11%
21%
17%
15%
14%
Xiaomi
8%
10%
10%
13%
11%
14%
16%
13%
OPPO
8%
8%
9%
8%
9%
11%
10%
11%
vivo
8%
7%
8%
8%
8%
10%
10%
10%
Others
40%
41%
39%
38%
35%
26%
31%
32%
Global Smartphone Shipments
Brands
Q4 2019
Q1 2020
Q2 2020
Q3 2020
Q4 2020
Q1 2021
Q2 2021
Q3 2021
Samsung
70.4
58.6
54.2
80.4
62.5
76.6
57.6
69.3
Apple
72.3
40.0
37.5
41.7
81.9
59.5
48.9
48.0
Xiaomi
32.9
29.7
26.5
46.5
43.0
48.5
52.5
44.4
OPPO
30.7
22.3
24.5
31.0
34.0
38.0
33.6
38.1
vivo
31.5
21.6
22.5
31.0
33.4
35.5
32.5
33.7
Others
163.4
122.8
110.9
135.0
139.8
96.8
98.0
108.5
Total Market
401.1
295.0
276.1
365.6
394.6
354.9
323.1
342.0
*Ranking is according to the latest quarter.
Q2 2021 Highlights
Published Date: August 16, 2021
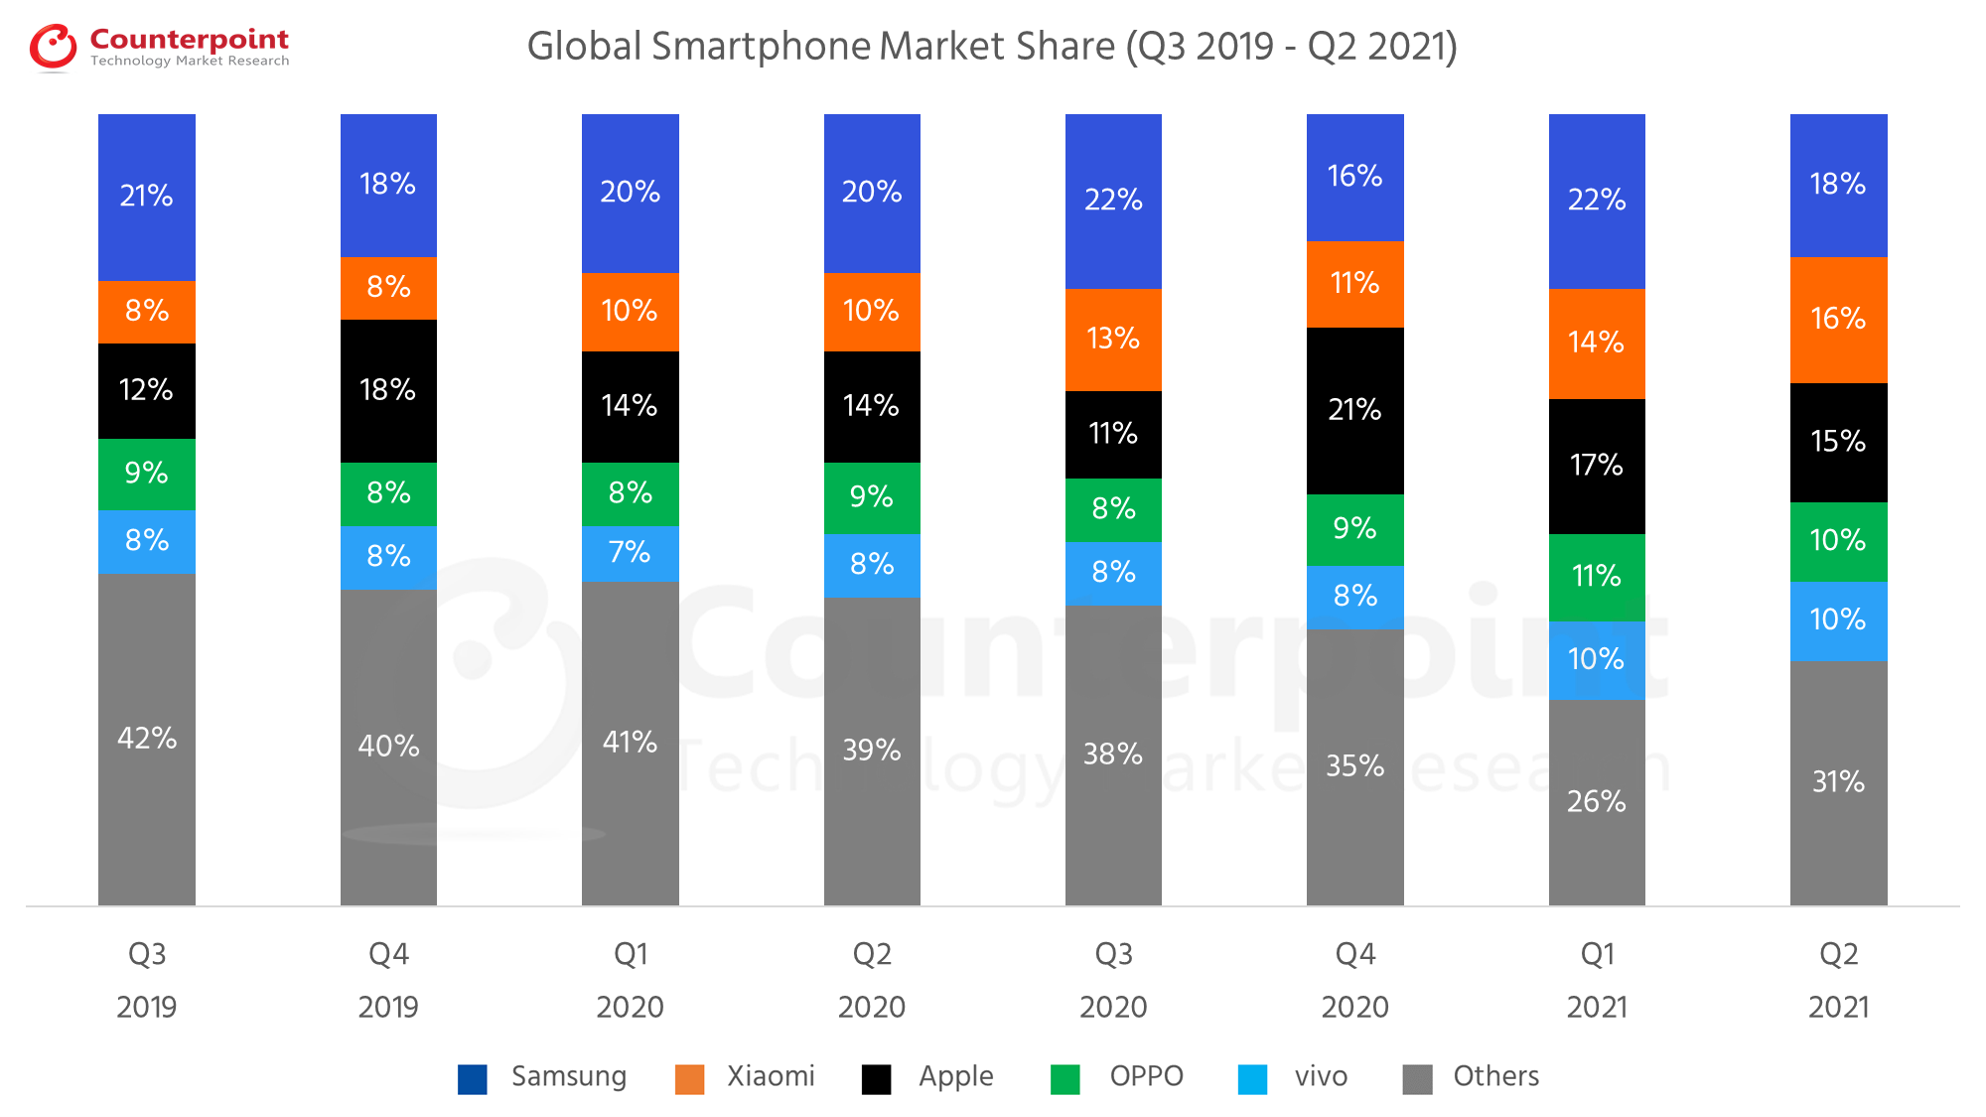
• Global smartphone market grew 19% YoY but declined by 7% QoQ as 323 million units were shipped, led by Samsung. • Xiaomi eclipses 52 million smartphones, becoming the world’s second-largest smartphone brand for the first time ever. •三星保留与shipme榜首nts reaching 58 million units in Q2 2021, however, its market share declined to 18% as compared to 22% in Q1 2021 as its shipments declined by 24% QoQ. • realme grew by 135% YoY and 17% QoQ, crossing cumulative shipments of 100 million smartphones since its entry into the smartphone market. • Global smartphone shipment revenues grew by 25% YoY to $96 billion in Q2 2021 setting a second-quarter record.
Global Smartphone Shipments Market Share (%)
Brands
Q3 2019
Q4 2019
Q1 2020
Q2 2020
Q3 2020
Q4 2020
Q1 2021
Q2 2021
Samsung
21%
18%
20%
20%
22%
16%
22%
18%
Xiaomi
8%
8%
10%
10%
13%
11%
14%
16%
Apple
12%
18%
14%
14%
11%
21%
17%
15%
OPPO
9%
8%
8%
9%
8%
9%
11%
10%
vivo
8%
8%
7%
8%
8%
8%
10%
10%
Others
42%
40%
41%
39%
38%
35%
26%
31%
Global Smartphone Shipments
Brands
Q3 2019
Q4 2019
Q1 2020
Q2 2020
Q3 2020
Q4 2020
Q1 2021
Q2 2021
Samsung
78.2
70.4
58.6
54.2
80.4
62.5
76.6
57.9
Xiaomi
31.7
32.9
29.7
26.5
46.2
43.0
48.5
52.5
Apple
44.8
72.3
40.0
37.5
41.7
81.9
59.5
48.9
OPPO
32.3
31.4
22.3
24.5
31.0
34.0
38.0
33.6
vivo
31.3
31.5
21.6
22.5
31.0
33.4
35.5
32.5
Others
161.7
162.6
122.8
110.9
135.3
139.8
96.8
97.7
Total
Market
380.0
401.1
295.0
276.1
365.6
394.6
354.9
323.1
*Ranking is according to the latest quarter.
Q1 2021 Highlights
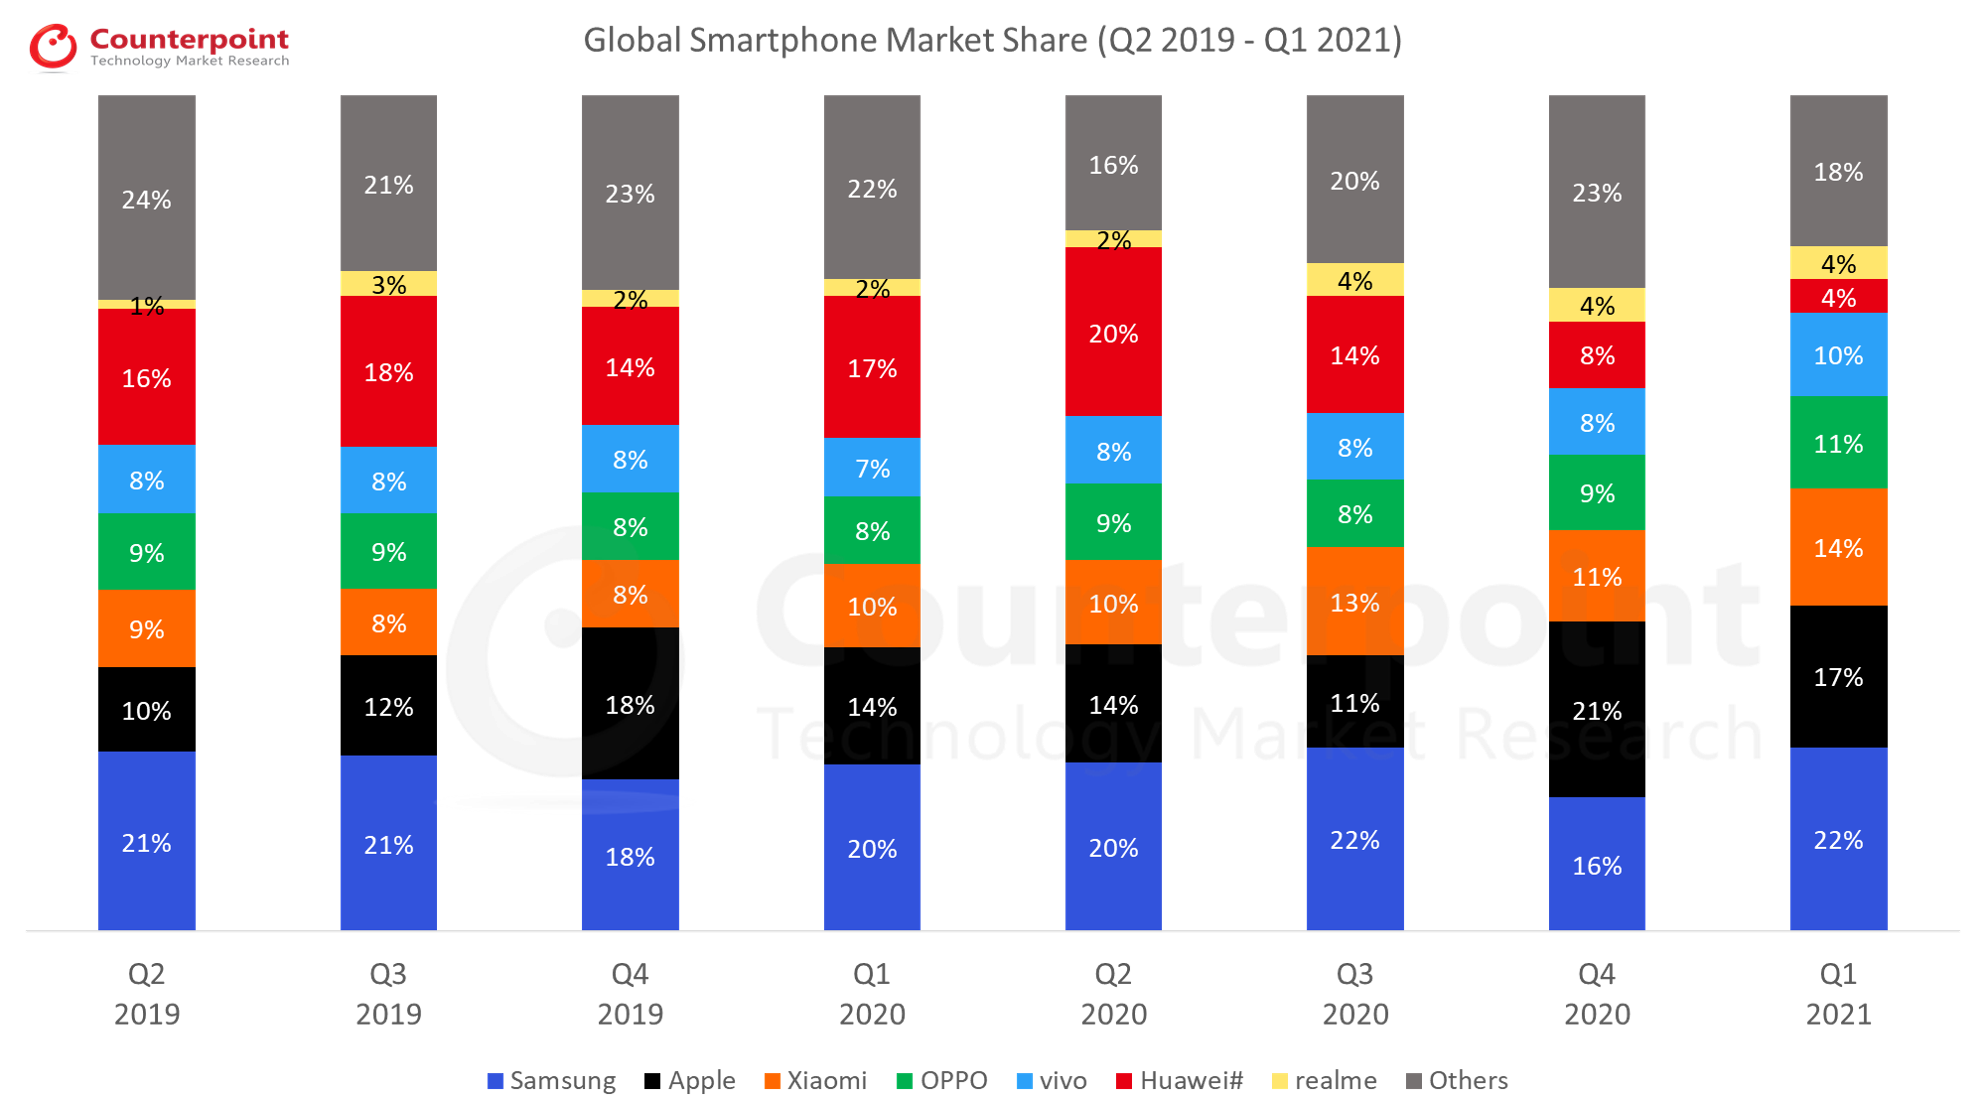
Published Date: May 16, 2021
• Global smartphone shipment revenue crossed the $100 billion mark for the first time for a March-ending quarter to reach $113 billion. • Global shipments grew 20% YoY, reaching 354 million units, led by OPPO, vivo, Xiaomi and Apple. • Samsung regained its top spot as the world’s biggest OEM, with shipments reaching 76.8 million units in Q1 2021. • Apple iPhone active installed base reached a new high this quarter.
Global Smartphone Shipments Market Share (%)
Brands
Q2 2019
Q3 2019
Q4 2019
Q1 2020
Q2 2020
Q3 2020
Q4 2020
Q1 2021
Samsung
21%
21%
18%
20%
20%
22%
16%
22%
Apple
10%
12%
18%
14%
14%
11%
21%
17%
Xiaomi
9%
8%
8%
10%
10%
13%
11%
14%
OPPO
9%
9%
8%
8%
9%
8%
9%
11%
vivo
8%
8%
8%
7%
8%
8%
8%
10%
Huawei#
16%
18%
14%
17%
20%
14%
8%
4%
realme
1%
3%
2%
2%
2%
4%
4%
4%
Others
24%
21%
23%
22%
16%
20%
23%
18%
Global Smartphone Shipments
Brands
Q2 2019
Q3 2019
Q4 2019
Q1 2020
Q2 2020
Q3 2020
Q4 2020
Q1 2021
Samsung
76.3
78.2
70.4
58.6
54.2
80.4
62.5
76.6
Apple
36.5
44.8
72.3
40.0
37.5
41.7
81.9
59.5
Xiaomi
32.3
31.7
32.9
29.7
26.5
46.2
43.0
48.5
OPPO
30.6
32.3
31.4
22.3
24.5
31.0
34.0
38.0
vivo
27.0
31.3
31.5
21.6
22.5
31.0
33.4
35.5
Huawei#
56.6
66.8
56.2
49.0
54.8
50.9
33.0
15.0
realme
5.0
10.2
7.8
7.2
6.4
14.8
14.0
12.8
Others
92.8
84.7
98.6
66.6
49.7
69.6
92.8
69.0
Total
Market
357.1
380.0
401.1
295.0
276.1
365.6
394.6
354.9
*Ranking is according to the latest quarter.
#Huawei includes HONOR in all quarters except Q1 2021 reflecting the separation of the two brands.
Q4 2020 Highlights
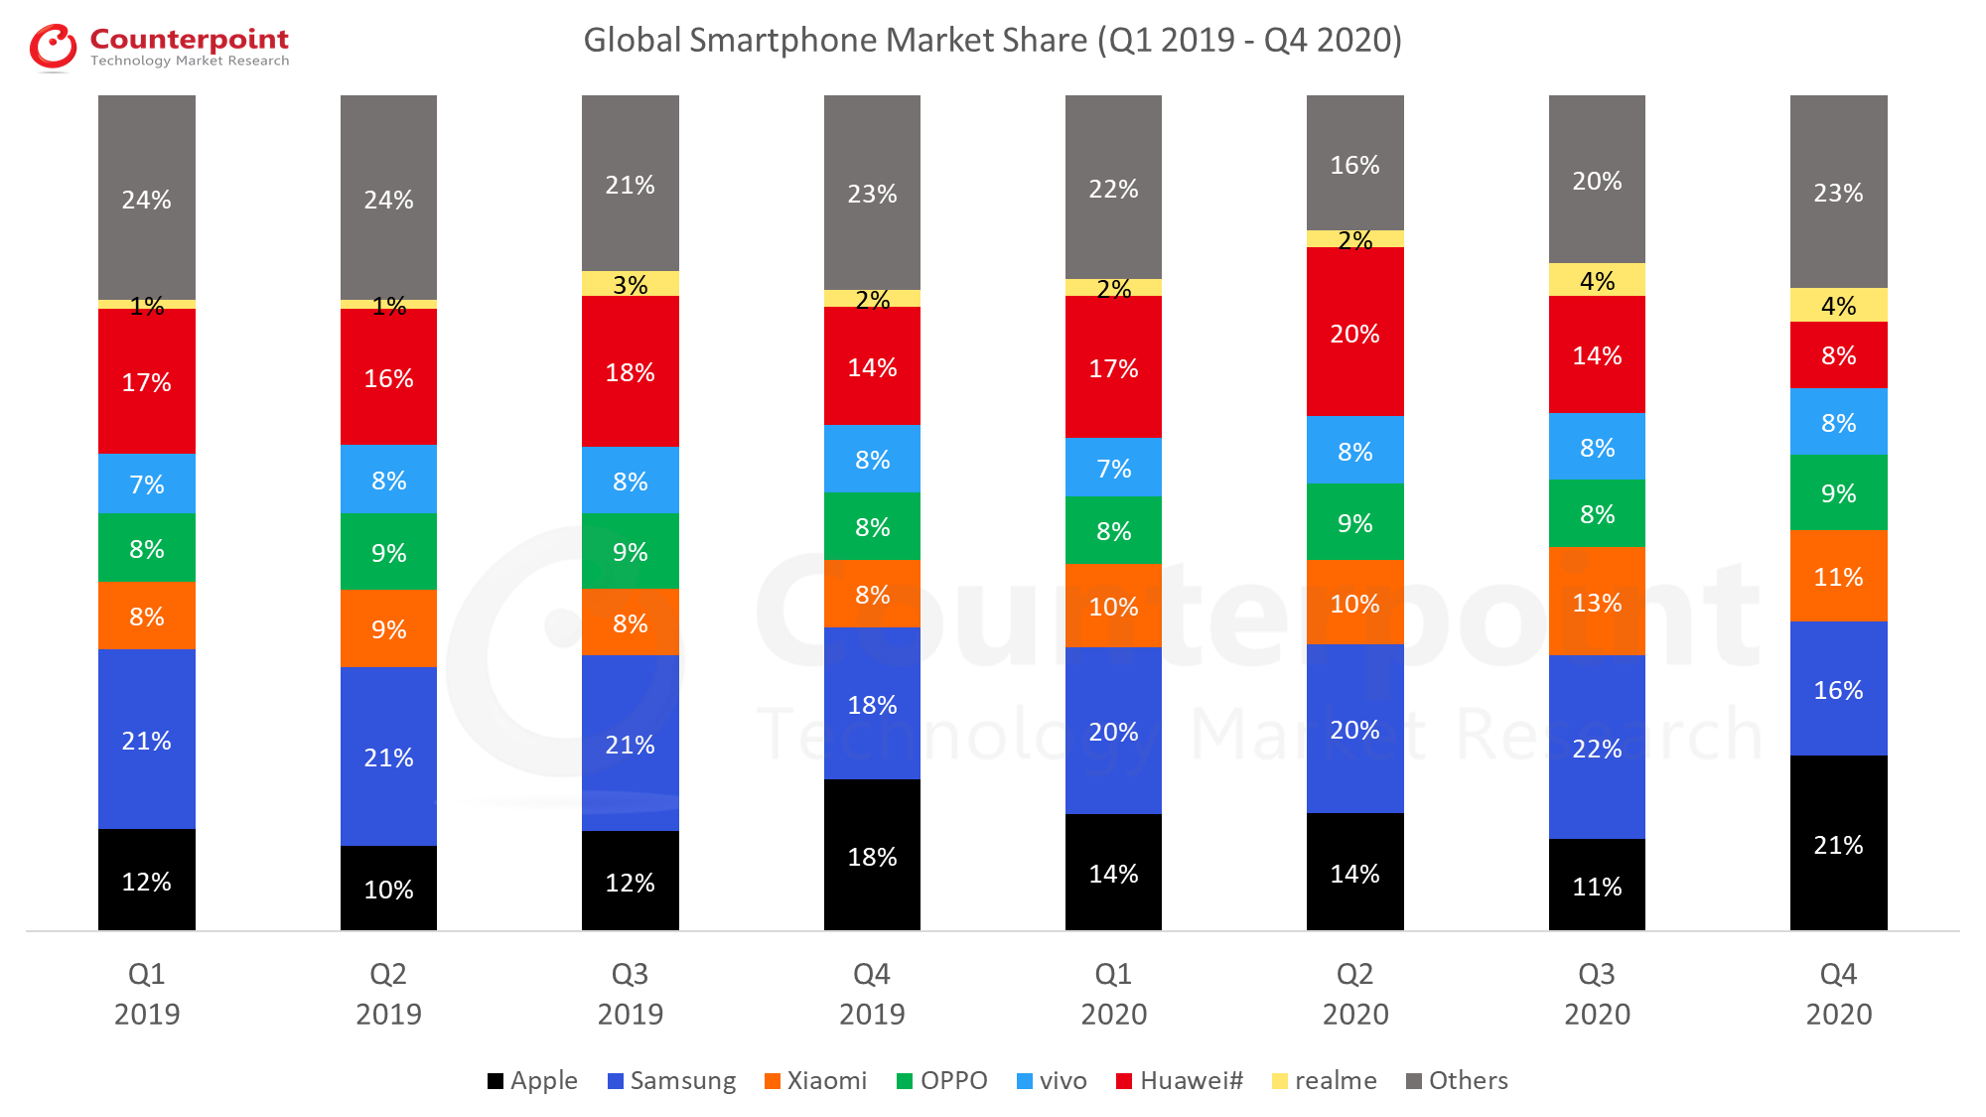
Published Date: February 16, 2021
• The global smartphone market continued to recover in Q4 2020, rebounding 8% QoQ to 395.9 million units. • Apple’s 8% YoY and 96% QoQ growth helped it lead the market in Q4 2020. • Samsung slipped to the second spot with 62.5 million units in Q4 2020, However, it led the overall market in CY 2020. • For the first time, OPPO and vivo surpassed Huawei to capture the fourth and fifth spots respectively, Huawei slipped to the sixth spot. • realme emerged as the fastest growing brand in CY 2020 with 65% YoY growth.
Global Smartphone Shipments Market Share (%)
Brands
Q1 2019
Q2 2019
Q3 2019
Q4 2019
Q1 2020
Q2 2020
Q3 2020
Q4 2020
Apple
12%
10%
12%
18%
14%
14%
11%
21%
Samsung
21%
21%
21%
18%
20%
20%
22%
16%
Xiaomi
8%
9%
8%
8%
10%
10%
13%
11%
OPPO
8%
9%
9%
8%
8%
9%
8%
9%
vivo
7%
8%
8%
8%
7%
8%
8%
8%
Huawei#
17%
16%
18%
14%
17%
20%
14%
8%
realme
1%
1%
3%
2%
2%
2%
4%
4%
Others
24%
24%
21%
23%
22%
16%
20%
23%
Global Smartphone Shipments
Brands
Q1 2019
Q2 2019
Q3 2019
Q4 2019
Q1 2020
Q2 2020
Q3 2020
Q4 2020
Apple
42.0
36.5
44.8
72.3
40.0
37.5
41.7
81.9
Samsung
72.0
76.3
78.2
70.4
58.6
54.2
80.4
62.5
Xiaomi
27.8
32.3
31.7
32.9
29.7
26.5
46.2
43.0
OPPO
25.7
30.6
32.3
31.4
22.3
24.5
31.0
34.0
vivo
23.9
27.0
31.3
31.5
21.6
22.5
31.0
33.4
Huawei#
59.1
56.6
66.8
56.2
49.0
54.8
50.9
33.0
realme
2.8
5.0
10.2
7.8
7.2
6.4
14.8
14.0
Others
87.7
92.8
84.7
98.6
66.6
49.7
69.6
92.8
*Ranking is according to the latest quarter. #Huawei includes HONOR.
Q3 2020 Highlights
Samsung regained the top spot, shipping 80.4 million units with 48% QoQ and 3% YoY growth with the highest ever shipment in the last three years.
Realme shipment grew 132% QoQ, becoming the world’s fastest brand to hit 50 million shipments since inception.
Xiaomi grew 75% QoQ contributing 13% in total smartphone shipment. Notably, this was also the first time when Xiaomi surpassed Apple to capture the third spot.
The market share for BBK Group (OPPO, Vivo, Realme, and OnePlus) has increased from 20% in Q2 to 22% in Q3 2020. The group is close to becoming the largest smartphone manufacturer group globally with three of its brands in the top 10.
Global Smartphone Shipments Market Share (%)
Brands
Q4 2018
Q1 2019
Q2 2019
Q3 2019
Q4 2019
Q1 2020
Q2 2020
Q3 2020
Samsung
18%
21%
21%
21%
18%
20%
20%
22%
Huawei#
15%
17%
16%
18%
14%
17%
20%
14%
Xiaomi
6%
8%
9%
8%
8%
10%
10%
13%
Apple
17%
12%
10%
12%
18%
14%
14%
11%
OPPO
8%
8%
9%
9%
8%
8%
9%
8%
vivo
7%
7%
8%
8%
8%
7%
8%
8%
realme
–
1%
1%
3%
2%
2%
2%
4%
Others
26%
24%
24%
21%
23%
22%
16%
20%
Global Smartphone Shipments
Brands
Q4 2018
Q1 2019
Q2 2019
Q3 2019
Q4 2019
Q1 2020
Q2 2020
Q3 2020
Samsung
69.8
72.0
76.3
78.2
70.4
58.6
54.2
80.4
Huawei#
59.7
59.1
56.6
66.8
56.2
49.0
54.8
50.9
Xiaomi
25.6
27.8
32.3
31.7
32.9
29.7
26.5
46.2
Apple
65.9
42.0
36.5
44.8
72.3
40.0
37.5
41.7
OPPO
31.3
25.7
30.6
32.3
31.4
22.3
24.5
31.0
vivo
26.5
23.9
27.0
31.3
31.5
21.6
22.5
31.0
realme
–
2.8
5.0
10.2
7.8
7.2
6.4
14.8
Others
115.8
87.7
92.8
84.7
98.6
66.6
48.6
69.6
*Ranking is according to the latest quarter.
#Huawei includes HONOR.
Q2 2020 Highlights
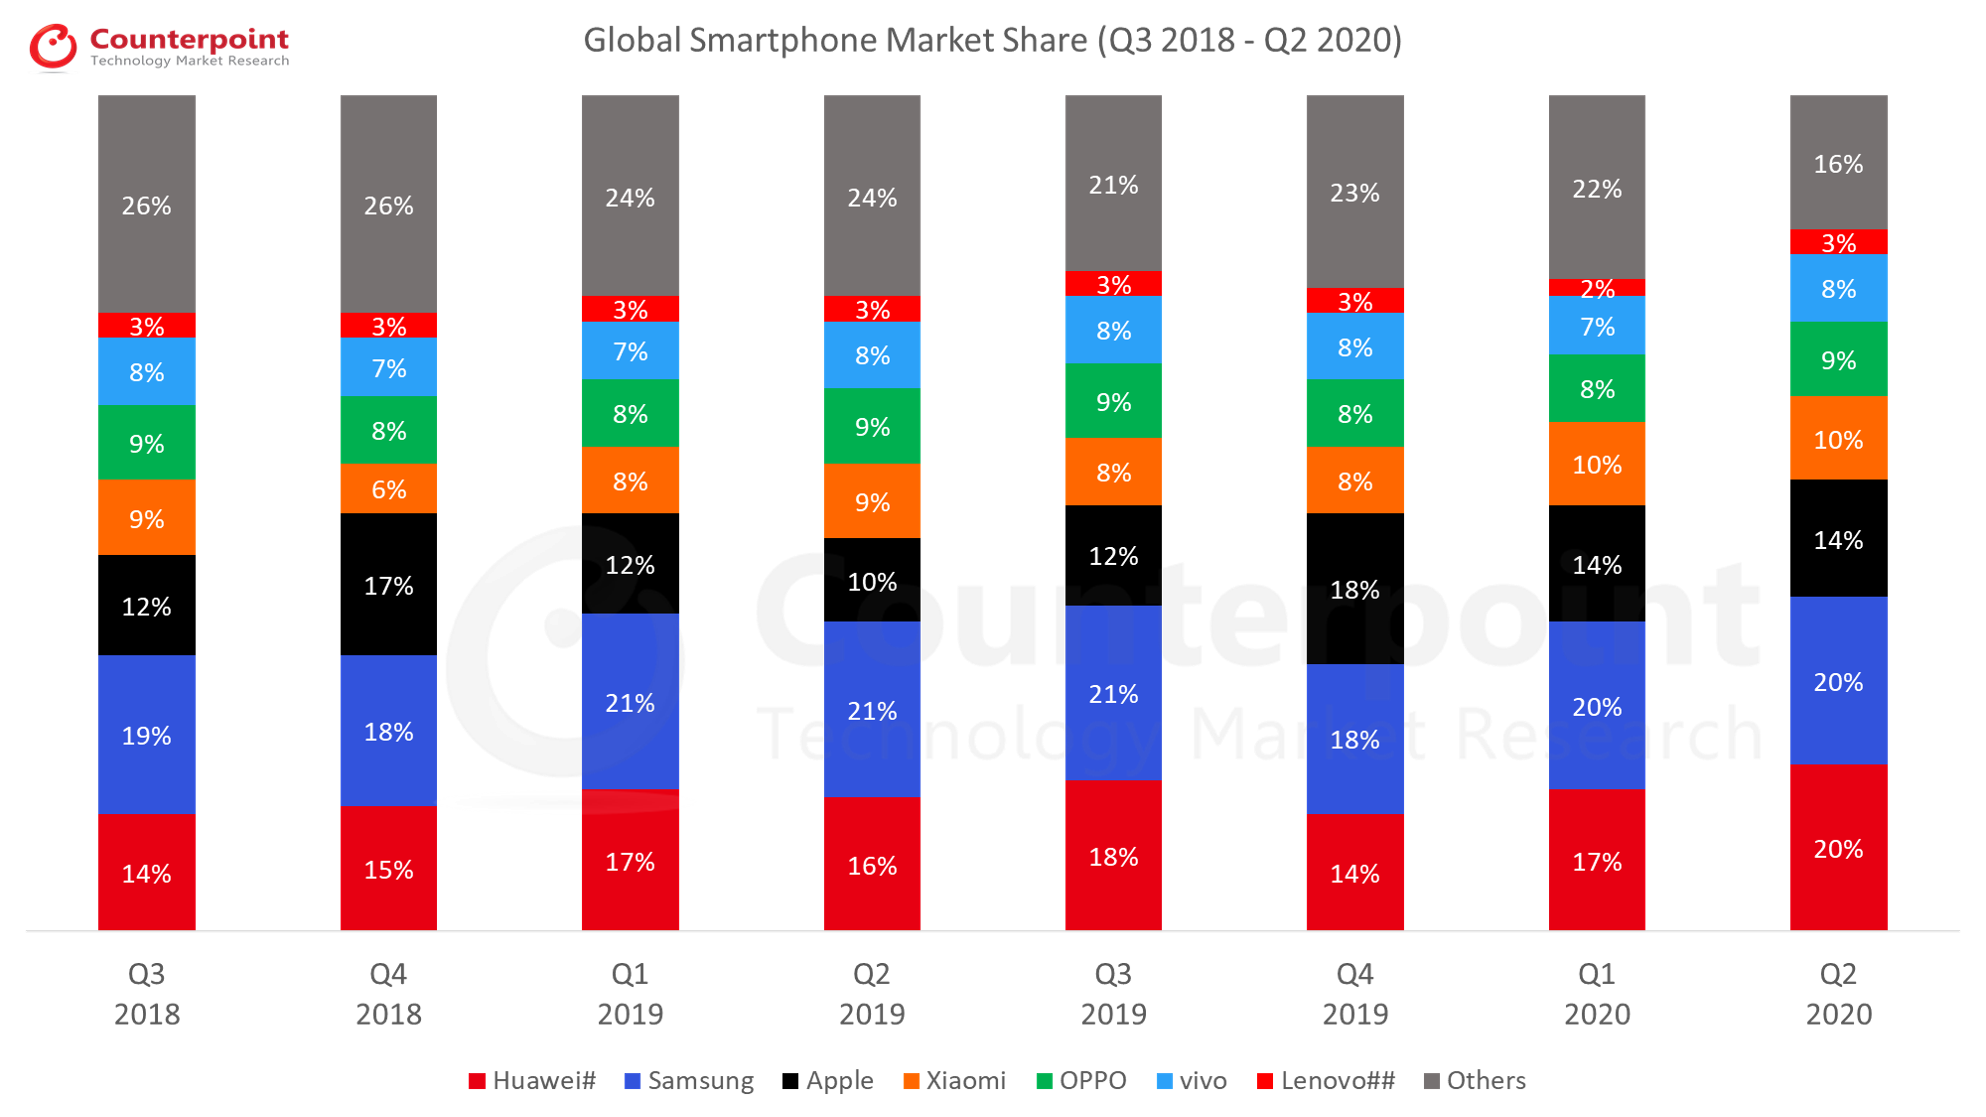
The share of the top 10 brands reached 88% compared to 80% last year. Brands outside of the top 10 declined 55% YoY. The impact of COVID-19 was more severe on smaller brands that tend to have lower online presence and that tend to cater more to the entry-level segments.
Huawei continued its push in China and surpassed Samsung to lead the global smartphone market. Huawei’s shipments declined only 3% YoY globally as it grew 11% YoY in China.
Samsungdeclined 29% YoY as its core markets including LATAM, India, the USA and Europe were struggling from the effects of the pandemic and lockdowns.
realmewas the only major brand achieving double-digit annual growth. realme grew 11% YoY in the quarter as several markets in Europe and India recovered in June. realme was also the fastest-growing brand in the quarter and was number 7th in terms of sales.
Apple iPhone shipments grew 3% YoY and revenues grew 2% YoY. The company saw sustained momentum of the iPhone 11 and a great sales start of the iPhone SE. All regions saw revenue growth.
Global Smartphone Shipments Market Share (%)
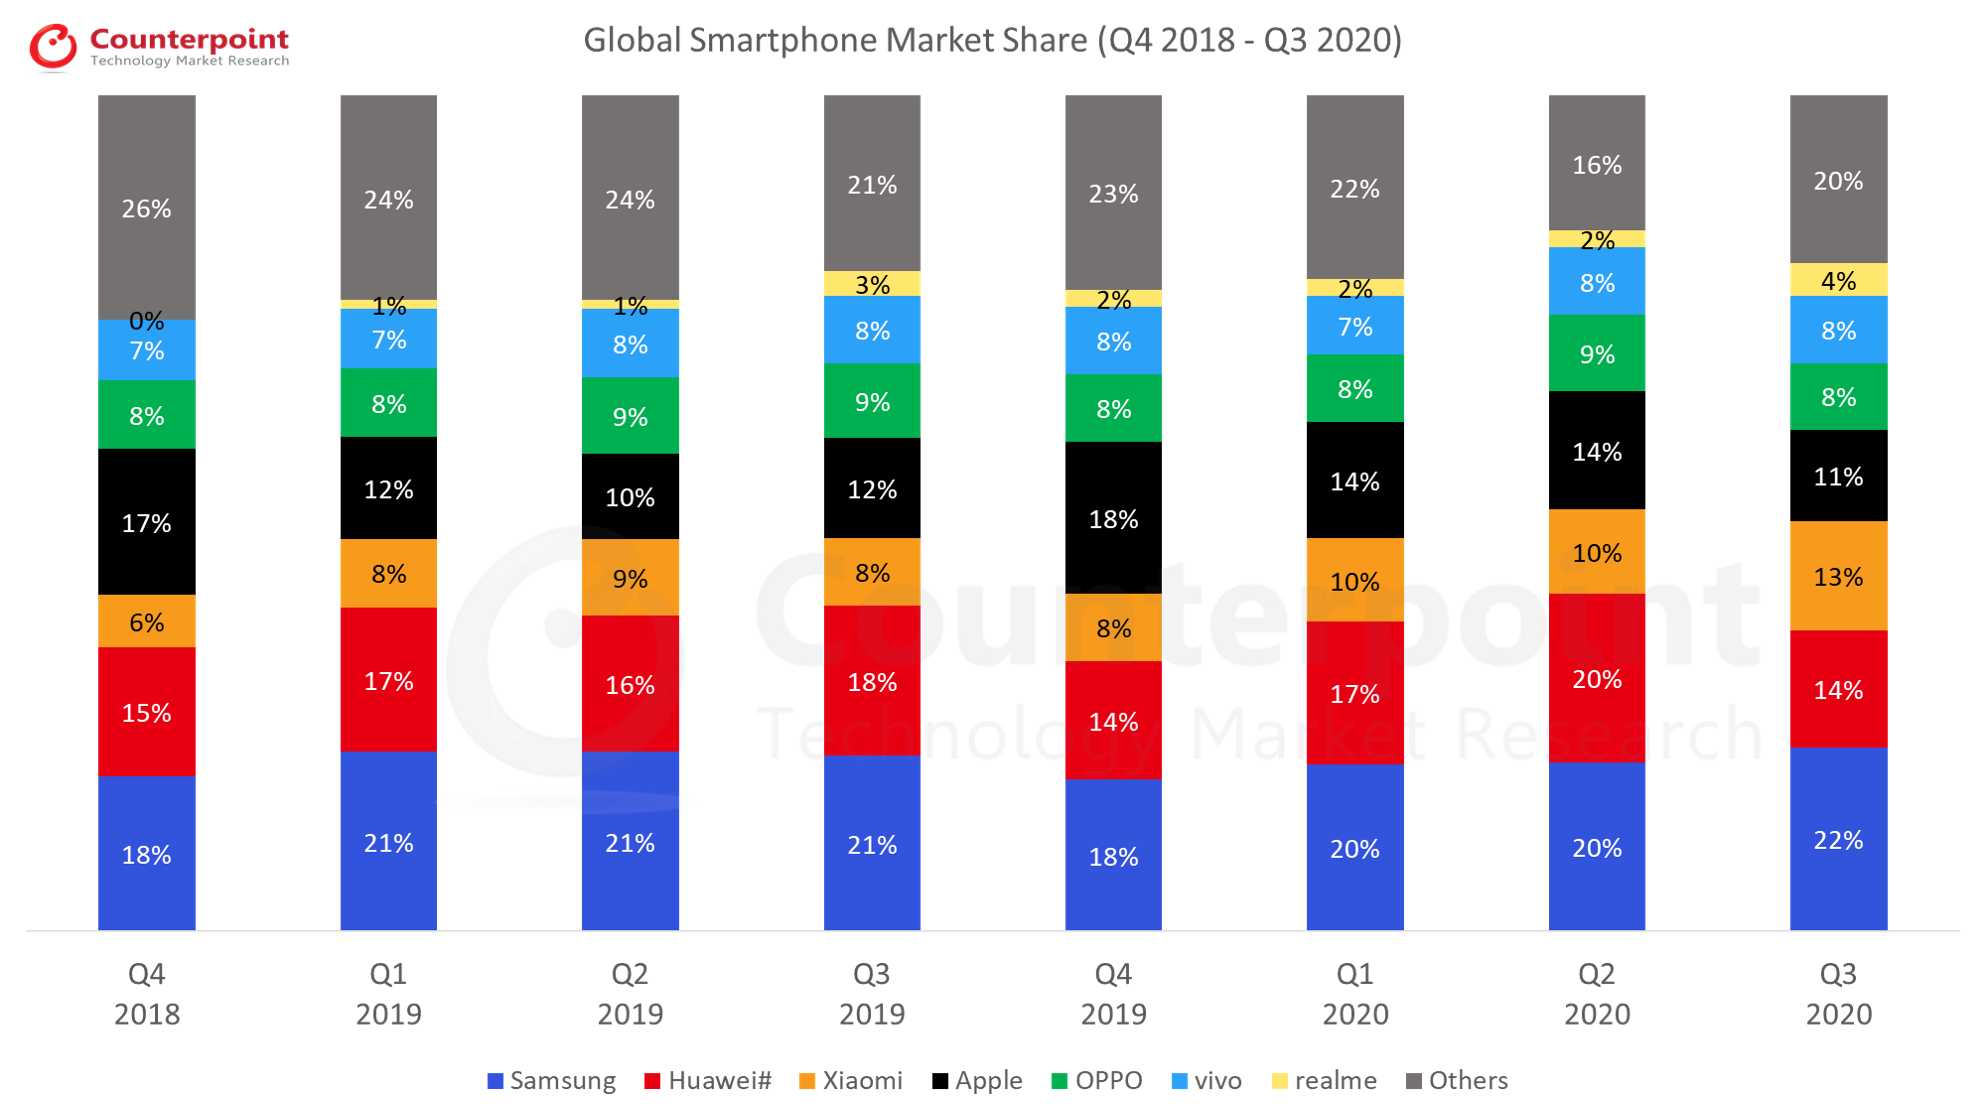
Brands
Q3 2018
Q4 2018
Q1 2019
Q2 2019
Q3 2019
Q4 2019
Q1 2020
Q2 2020
Huawei#
14%
15%
17%
16%
18%
14%
17%
20%
Samsung
19%
18%
21%
21%
21%
18%
20%
20%
Apple
12%
17%
12%
10%
12%
18%
14%
14%
Xiaomi
9%
6%
8%
9%
8%
8%
10%
10%
OPPO
9%
8%
8%
9%
9%
8%
8%
9%
vivo
8%
7%
7%
8%
8%
8%
7%
8%
Lenovo##
3%
3%
3%
3%
3%
3%
2%
3%
Others
26%
26%
24%
24%
21%
23%
22%
16%
Global Smartphone Shipments
Brands
Q3 2018
Q4 2018
Q1 2019
Q2 2019
Q3 2019
Q4 2019
Q1 2020
Q2 2020
Huawei#
52.0
59.7
59.1
56.6
66.8
56.2
49.0
54.8
Samsung
72.3
69.8
72.0
76.3
78.2
70.4
58.6
54.2
Apple
46.9
65.9
42.0
36.5
44.8
72.3
40.0
37.5
Xiaomi
33.3
25.6
27.8
32.3
31.7
32.9
29.7
26.5
OPPO
33.9
31.3
25.7
30.6
32.3
31.4
22.3
24.5
vivo
30.5
26.5
23.9
27.0
31.3
31.5
21.6
22.5
Lenovo##
11.0
10.1
9.5
9.5
10.0
11.7
5.9
7.5
Others
110.9
115.8
87.7
92.8
84.7
98.6
66.6
48.6
*Ranking is according to the latest quarter. #Huawei includes HONOR. ##Lenovo includes Motorola.
Q1 2020 Highlights
The global smartphone market declined its fastest ever, down 13% YoY in Q1 2020.
This is the first time since Q1 2014, that the smartphone market has fallen below 300Mn units in a quarter.
The COVID-19 pandemic has disrupted the signs of any recovery that the market started showing in Q4 2019.
Samsungled the smartphone market during the quarter capturing one-fifth of the global smartphone shipments. The OEM declined 18% YoY during the quarter and is expected to see a steeper decline in Q2 2020.
Huawei continued its push in China and surpassed Apple again during the quarter. The OEM declined 17% YoY during the quarter. Over half of the smartphone shipments for Huawei are now in China.
Apple remained resilient even during the COVID-19 as iPhone shipments declined only 5% YoY during the quarter. The iPhone revenues were down 7% YoY for the same period. The impact on some European and Asian countries was mild.
Xiaomi grew 7% YoY during the quarter. The OEM continued to lead theIndia年代martphone market reaching its highest ever market share (30%) since Q1 2018.
Compared to other major OEMs, Vivo declined less (10% YoY) during the quarter. A strong performance in the Indian Smartphone Market partially offset declines in other markets.
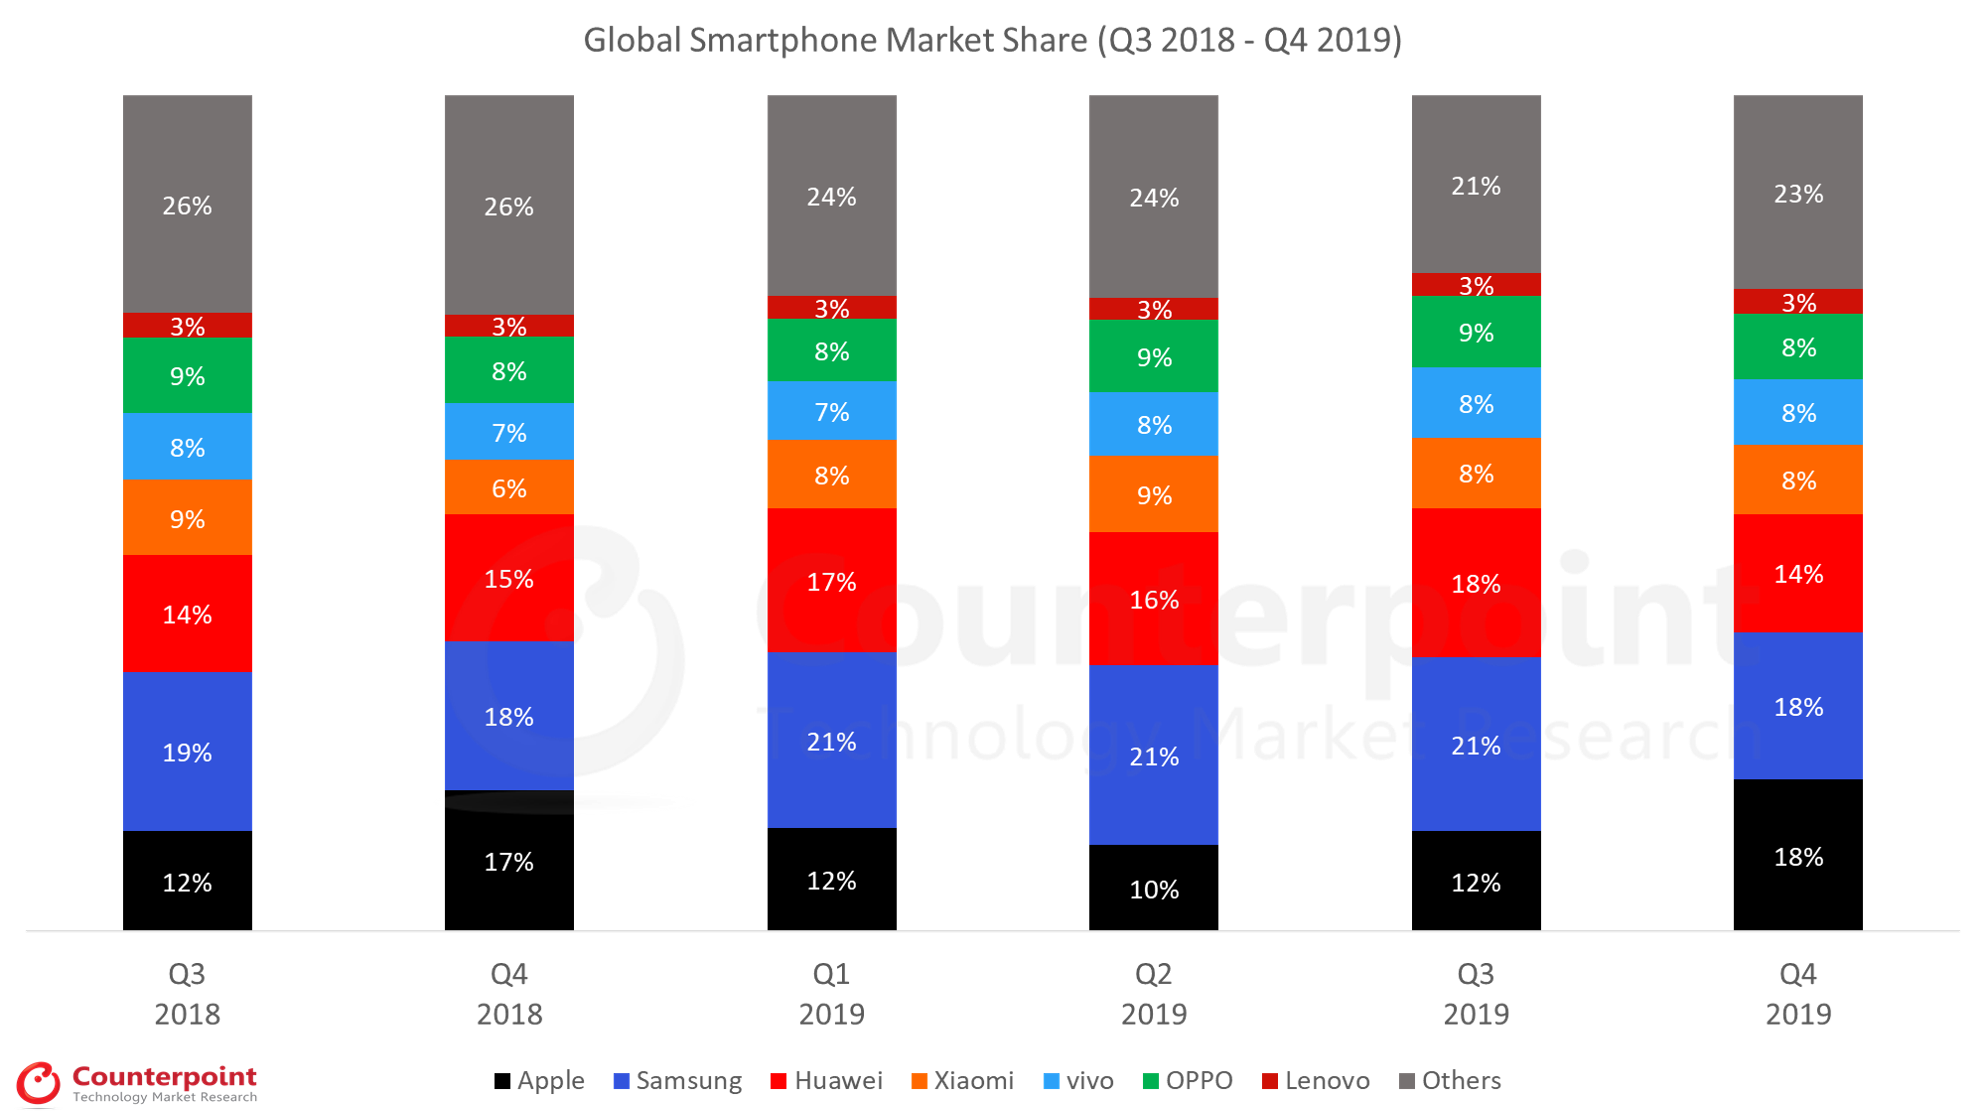
Global smartphone shipments reached 401 million units in Q4 2019 showing a 2% YoY growth as compared to Q4 2018.
The top three brands,Samsung, Huawei and Apple, captured more than 50% of the smartphone market, with the rest of the market left for hundreds of other brands to compete fiercely.
Samsung remained flat during 2019 Q4 while grew 2% YoY for CY 2019.Samsung has been oneof the leading players in 5G in 2019, shipping over 6.5 Million 5G capable devices in 2019.
Apple iPhone shipments grew 10% YoY during the Q4 2019 even without a 5G variant.The iPhone 11 seriesreceived an excellent consumer response in all regions. The dual-camera and lower pricing of iPhone 11 helped propel sales.
realme continued its growth streak and remained the fastest growing brand during the quarter (163% YoY) as well as the year (453% YoY). The brand entered the top five in the Indian market for the full year, which contributed to its strong growth.
The top three brands, Samsung, Huawei and Apple, together cornered almost half of the smartphone market, with the rest of the market left for hundreds of other brands to compete fiercely.
Samsungcontinued its growth at 8.4%YoY, capturing over one-fifth of the global smartphone market.This is due to strong Note 10 and Galaxy A series sales.
Huaweigrew a very healthy 28.5% YoY globally. It captured a record 40% market share in the Chinese smartphone market.
Apple iPhone shipments were down 4%,and as a result revenues fell 11% YoY.
BBK Group (OPPO, Vivo, Realme, and OnePlus) is close to becoming the largest smartphone manufacturer groupglobally, accounting for over 20% of the global smartphone market and three of its brands in the top 10.
For Q4 2018,Huawei, OPPO and vivocontinue to dominate with strong performances in China, India, Asia and parts of Europe. The trio have multiple regions to enter and grow moving forward into 2019.
SamsungandApple年代aw a tough quarter and tough 2018 as demand for their flagship phones have waned due to competition from affordable premium and more cutting-edge phones from Chinese brands such as Huawei and OnePlus.
Xiaomireached a record fourth position for the full year after two years of setbacks thanks to immense growth in India. It has surpassed OPPO globally to take back the fourth position.
Smartphone shipments declined 2% annually to 360 million units in Q2 2018.
The top 10 brands accounted for 79% of the smartphone volumes in Q2 2018.
Samsung led the smartphone market by volume with a market share of 20% in Q2 2018 even though it registered an annual decline of 11% due to weak sales of its flagship Galaxy S9 series smartphones.
Huawei shipments grew 41% annually in Q2 2018. The company managed to be the fastest growing (21%) smartphone brand amid a declining China smartphone market and grew fully 71% overseas.
Apple shipped 41.3 million iPhones during Q2 2018, up 1% compared to the same quarter last year. iPhone X remains the top seller for Apple during the quarter.
Smartphone shipments declined 3% annually reaching 360 million units in Q1 2018.
The China market decline in Q1 2018, affected the overall growth of some of the key Chinese brands including OPPO and vivo. Both saw a decline in the quarter as a result of the China market slowdown.
Smartphone penetration fell to 76% of all the mobile phones shipped in the quarter. This was partly due to an increase in feature phone shipments by some key brands such as Nokia HMD and Reliance Jio who both saw YoY growth.
Top 10 brands accounted for 76% of the smartphone volumes in Q1 2018.
In order to access Counterpoint Technology Market Research Limited (Company or We hereafter) Web sites, you may be asked to complete a registration form. You are required to provide contact information which is used to enhance the user experience and determine whether you are a paid subscriber or not. Personal Information When you register on we ask you for personal information. We use this information to provide you with the best advice and highest-quality service as well as with offers that we think are relevant to you. We may also contact you regarding a Web site problem or other customer service-related issues. We do not sell, share or rent personal information about you collected on Company Web sites.
How to unsubscribe and Termination
You may request to terminate your account or unsubscribe to any email subscriptions or mailing lists at any time. In accessing and using this Website, User agrees to comply with all applicable laws and agrees not to take any action that would compromise the security or viability of this Website. The Company may terminate User’s access to this Website at any time for any reason. The terms hereunder regarding Accuracy of Information and Third Party Rights shall survive termination.
Website Content and Copyright
This Website is the property of Counterpoint and is protected by international copyright law and conventions. We grant users the right to access and use the Website, so long as such use is for internal information purposes, and User does not alter, copy, disseminate, redistribute or republish any content or feature of this Website. User acknowledges that access to and use of this Website is subject to these TERMS OF USE and any expanded access or use must be approved in writing by the Company. – Passwords are for user’s individual use – Passwords may not be shared with others – Users may not store documents in shared folders. – Users may not redistribute documents to non-users unless otherwise stated in their contract terms.
Changes or Updates to the Website
The Company reserves the right to change, update or discontinue any aspect of this Website at any time without notice. Your continued use of the Website after any such change constitutes your agreement to these TERMS OF USE, as modified. Accuracy of Information: While the information contained on this Website has been obtained from sources believed to be reliable, We disclaims all warranties as to the accuracy, completeness or adequacy of such information. User assumes sole responsibility for the use it makes of this Website to achieve his/her intended results.
Third Party Links: This Website may contain links to other third party websites, which are provided as additional resources for the convenience of Users. We do not endorse, sponsor or accept any responsibility for these third party websites, User agrees to direct any concerns relating to these third party websites to the relevant website administrator.
Cookies and Tracking
We may monitor how you use our Web sites. It is used solely for purposes of enabling us to provide you with a personalized Web site experience. This data may also be used in the aggregate, to identify appropriate product offerings and subscription plans. Cookies may be set in order to identify you and determine your access privileges. Cookies are simply identifiers. You have the ability to delete cookie files from your hard disk drive.


 This data is based on the smartphone AP/SoC shipments


 Looking at individual brands, Samsung, TECNO and
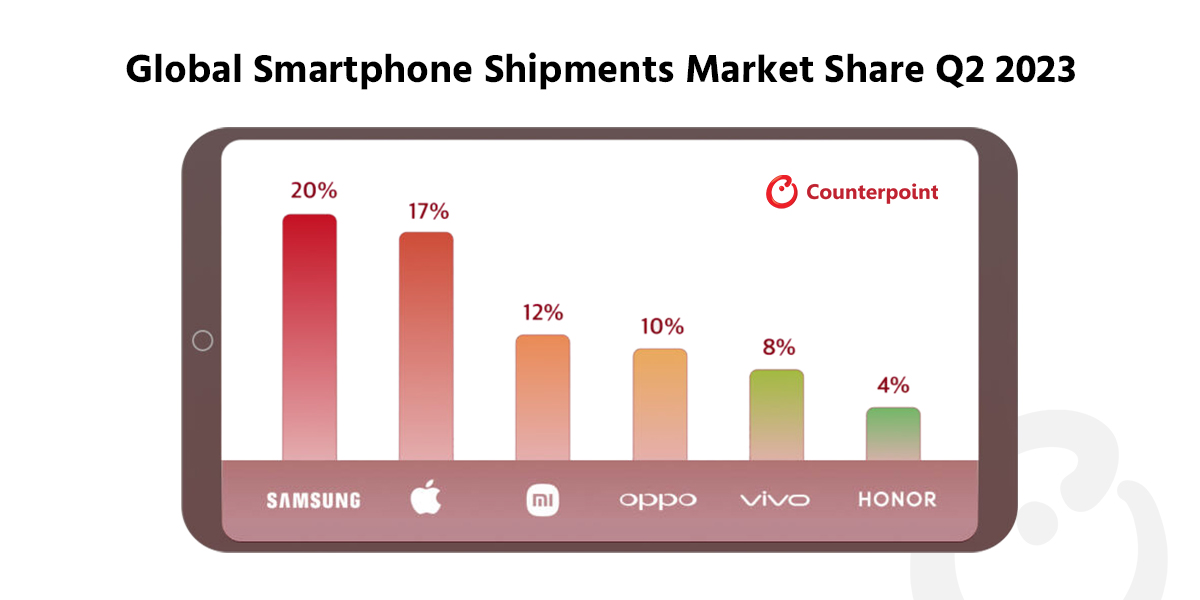


 Source:
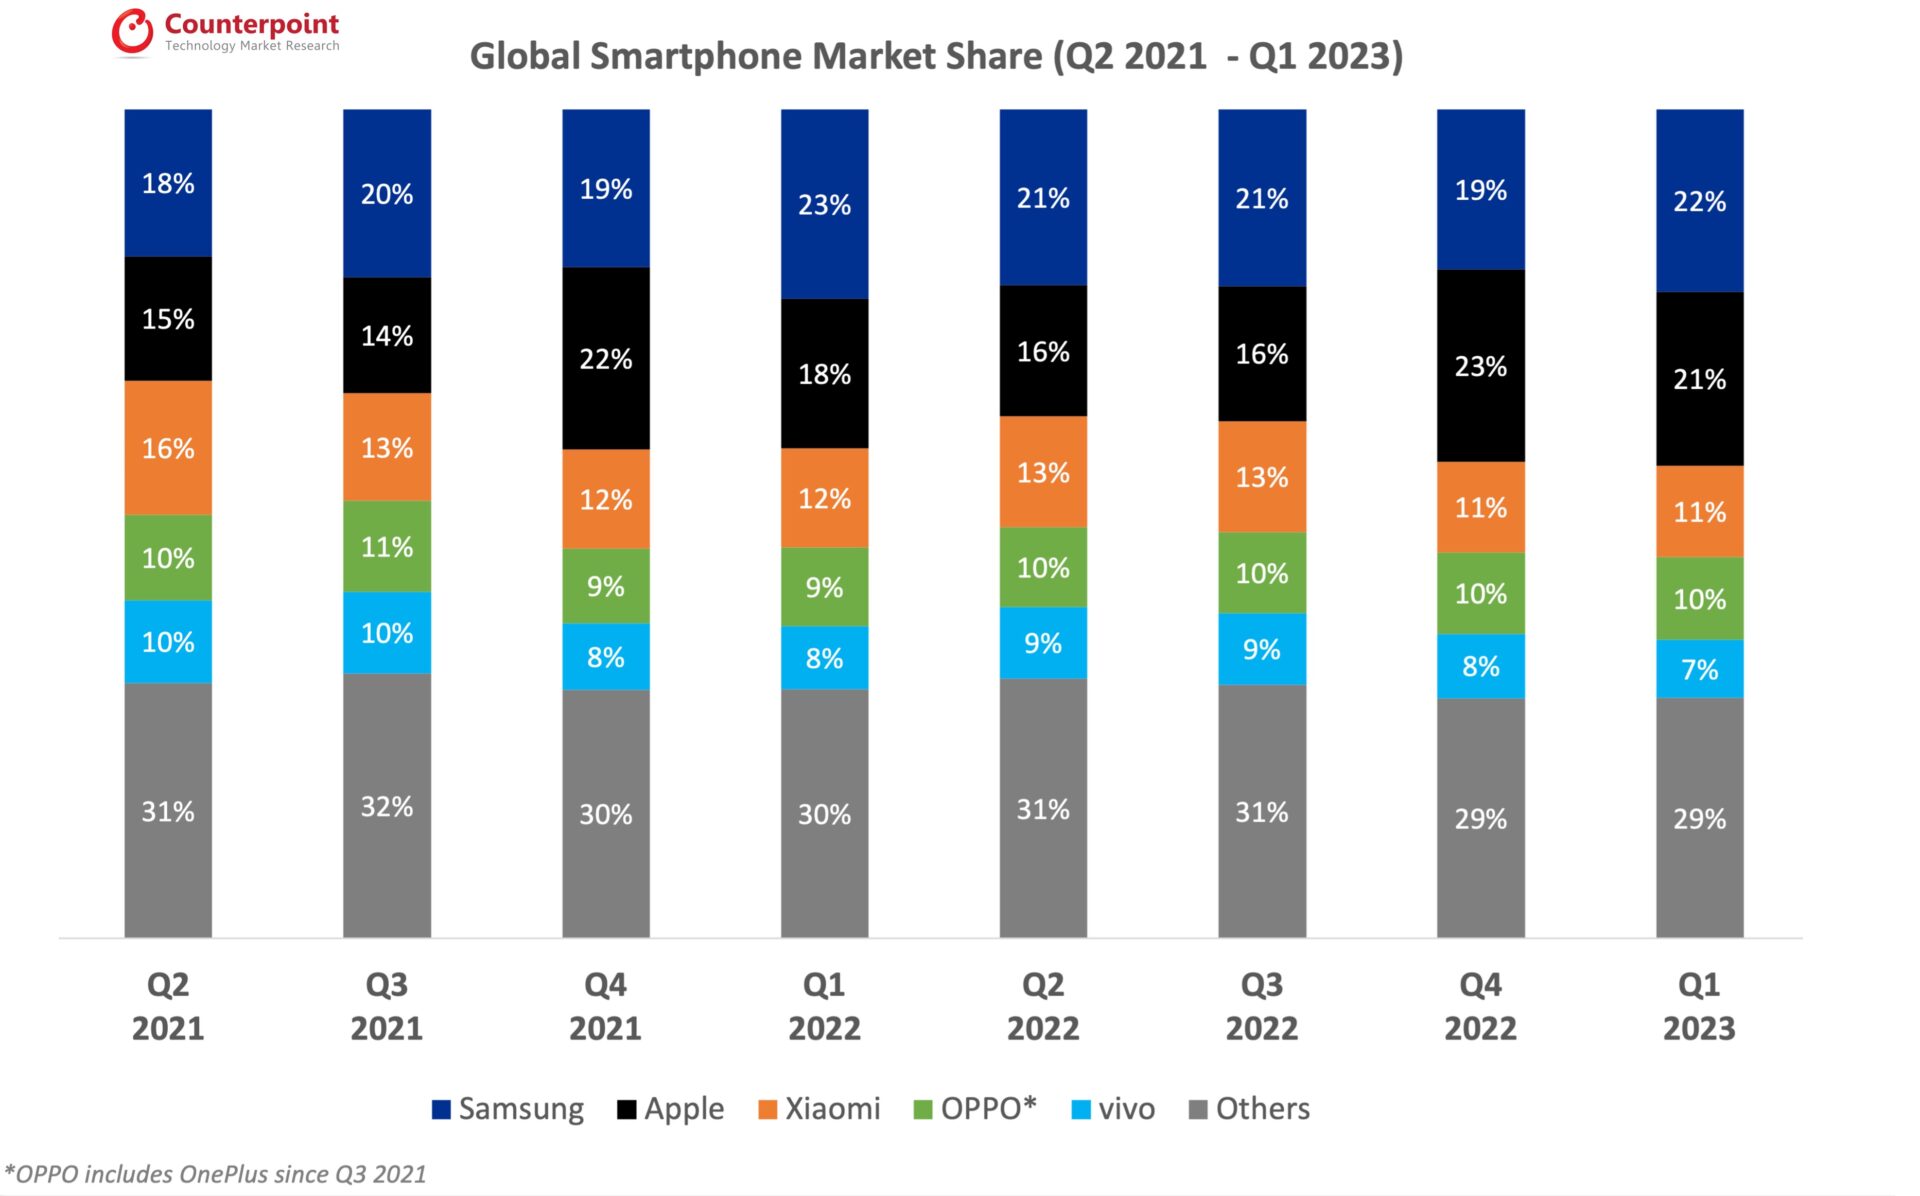

 Source:
 Source:
 Source:
 Source: