Apple’s iPhone 11 was the third best-selling model in Mexico in Q2 2023.
60% of the models in the top 10 list were priced below $150.
三星’s Galaxy A34, Galaxy A54 5G were the only two 5G models on the top 10 list.
Mexicois the second most important smartphone market in Latin America. The country has the second-highest population in the region and hosts an extremely competitive ecosystem. Mexico’s geographical size and lack of import barriers make it an extremely attractivesmartphonemarket.
The top-selling models accounted for 35% of Mexico’s total smartphonemarketin Q2 2023. The top 10 list almost appears like Samsung’s performance for the quarter as the brand dominated the top-selling chart in Mexico in Q2 2023. Five of the 10 best-selling models were from三星. According to Counterpoint’s Market Pulse Report, Samsung’s share in Q2 2023 was slightly more than 30%.
OPPO and Motorola both had two models in the Q2 2023 top-selling list. Motorola, which has always been a strong player in theMexicanmarket, launched a few new models during the quarter that helped the brand increase its market share. OPPO, a relatively new entrant in theLATAMmarket, managed to retain its third position in market share with two of its models in the top-selling list.
来源:对比研究市场脉搏,202年第二季度3
60% of the models in the top 10 list were priced below $150. This price band accounts for 52% of the overallsmartphonemarket in Mexico. However, premiumization is infiltrating the Mexican market, and the number of models in the >$150 band is increasing in the top-selling list. This trend is accelerating slowly but will surely lead to a higher overall smartphone ASP.
Apple’s four-year-oldiPhone11 has been part of the Mexican bestseller list for a few quarters now. It was the third best-selling model in the Mexican market in Q2 2023. The iPhone 11, which is a 4G model, was the most expensive model on the list. The massive sales of this model reflect the strength of Apple’s branding.
The 4G version of OPPO’s Reno 7 was another model in the bestsellers list priced more than $150. This is quite an achievement for the brand, which arrived in the region just three years ago.OPPOis still building its branding in the Mexican market. The Reno 7 has been in the Mexican top-selling chart since December 2022.
It is noteworthy that only two models in the chart are 5G phones – the Samsung Galaxy A34 and the Samsung Galaxy A54 5G. The latter one is also the most expensive Samsung model in the top-selling list. Meanwhile, Telcel has been pushing its subscriber base to replace their phone with a 5G one. Mexican consumers are still not ready for5Gtechnology. They would rather get more specs than access the technology.
In some markets, operators await evidence of successful use cases before switching to 5G SA.
In H1 2023, the Asia-Pacific region continued to lead in terms of 5G SA Core deployments.
Ericsson led the overall market followed by Nokia, Huawei, ZTE, Samsung, and Mavenir.
Counterpoint Research’s recently publishedJuly update的5G SA Core Trackeris a culmination of an extensive study of the5GSA market. It provides details of all operators with 5G SA cores in commercial operation at the end of H1 2023, including market share by region, vendor, and the popular frequency bands for deployments. Apart from that, it touches upon the potential monetization opportunities for telecom operators across different domains and uses cases.
Last year, there was steady growth in the commercial deployment of5GStandalone (SA), with more than 20 operators moving to 5G standalone core. However, the pace slowed down in H1 2023 with the number of operators launching commercial 5G SA ranging in single digits. The primary reason for the slowdown in commercialdeploymentof 5G SA was the restraint arising from global macroeconomic factors and the lack of a clear picture of 5G monetization for operators. Although the pace of commercial deployment has slowed down in 2023,operatorsare working on monetization avenues, and are working on SA-specific use cases, including on-demand network slicing and FWA.
Most of the 5G SA commercial deployments have been in developed economies, and Counterpoint Research expects the next bulk ofnetworkrollouts will take place in emerging markets. This will drive the continuing transition from 5G NSA to 5G SA.
Exhibit 1: 5G SA Deployments by Region, H1 2023
As shown in Exhibit 1, the Asia-Pacific region led the segment, followed by Europe and North America, with the other regions – Middle East and Africa, and Latin America – lagging.
Key Points
Key points discussed in the report include:
Operators– 47 operators have deployed 5G SA commercially with many more in the testing and trial phase. Globally, most of the deployments are in developed economies with those in emerging economies lagging. Although the pace of deployment is steady in developedmarkets, it is progressing slowly in emerging markets, and in some markets, operators are biding their time and looking for evidence of successful use cases before switching from 5G NSA to SA. The ongoing economic headwinds also delayed the commercial deployment of SA, which was seen in H1 2023.
Vendors– Ericsson and Nokia lead the5GSA Core market globally and are benefiting from the geopolitical sanctions on Chinese vendors Huawei and ZTE in some markets. South Korea’s Samsung and Japan’s NEC are mainly focused on their respective domestic markets but are expanding their reach to Tier-2 operators and emergingmarkets, while emerging vendors Parallel Wireless and Mavenir are working with leading operators in Europe, and Middle East and Africa.
Spectrum– Most operators are deploying 5G in mid-band frequencies, n78, as it provides faster speeds and good coverage. Some operators have also launched commercialservicesin the sub-GHz n28 and mmWave wave n258 bands. FWA seems to be the most popular use case at present but there is a lot of interest in edge services and network slicing as well.
Use Cases– Operators are looking for avenues to monetize the5G服务,因为他们正在努力使RoI from their investments in 5G. Although FWA is a promised application for 5G SA monetization, there are many other use cases that operators can look into to increase their RoI, includingnetworkslicing, live broadcasting, XR applications, and private networks. Although eMBB is the most widely used 5G use case currently, MNOs need to move to 5G SA to leverage URLLC and mMTC use cases.
Report Overview
Counterpoint Research’s5G SA Core Tracker, July 2023provides an overview of the 5G Standalone (SA) market, highlighting the key trends and drivers that are shaping the market, along with details of commercial launches by vendor, region, and frequency band. Additionally, the tracker provides details about the 5G SA vendor ecosystem split into two categories – public operator and private network markets.
Table of Contents:
Overview
Market Update
5G SA Market Deployments
Commercial Deployment by Operators
Network Engagements by Region
Network Engagements by Deployments Status
Leading 5G Core Vendors
Mobile Core Vendor Ecosystem
5G Core Vendors Market Landscape
Outlook
5G Standalone Use Cases
Background
Counterpoint Technology Market Research is a global research firm specializing in products in the TMT (technology, media and telecom) industry. It services major technology and financial firms with a mix of monthly reports, customized projects and detailed analyses of the mobile and technology markets. Its key analysts are seasoned experts in the high-tech industry.
Global Smartphone Shipments Market Data (Q3 2021 – Q2 2023)
Published Date: August 17, 2023
A repository of quarterly data for the global smartphone market. This data is a part of a series of reports which track the mobile handset market:Smartphone and Feature Phone shipmentsevery quarter for more than 140 brands covering more than 95% of the totaldevice shipmentsin the industry.
Global smartphone market share Q2 2023 highlights:
The global smartphone market declined by 9% YoY to reach 268 million units in Q2 2023.
三星retained its position as the top smartphone player in Q2 2023, as Apple saw cyclical decline.
Among the top five brands, Apple experienced the least YoY shipment decline. Among the top 10 brands, Tecno and Infinix, part of the Transsion Group, saw double digit annual growth.
在中东地区表现方面,和Africa (MEA) exhibited the only annual shipment growth while North America experienced the highest decline.
The top 5 brands contributed to almost 80% of the total 5G shipments in Q2 2023.
For our detailed research on the global smartphone market in Q2 2023, clickhere.
The global smartphone market share numbers are from:
MOBILE DEVICES MONITOR – Q2 2023 (Vendor Region Countries)
这s report is part of a series of reports which track the mobile handset market: Smartphone and Feature Phone shipments every quarter for more than 140 brands covering more than 95% of the total device shipments in the industry.
The deliverable includes
• Single pivot format giving in-depth analysis of theglobal handset market • Covers140 +品牌now in comparison to 95 brands earlier • Break out of3 key countriesin each regionto give a further granular view of the regions •18 countries viewas compared to six earlier • Covers more than95% of the global handset shipments • More visuals and analysis by country and by regions
这s robust quarterly report with fact-based deep analysis covering multiple dimensions will help players across the handset value chain to holistically analyze the current state of the global handset market and plan ahead of the competition.
这s data represents the global smartphone market share by quarter (from 2021-2023) by top OEMs. Global smartphone shipments by market share and millions of units are provided.
For detailed insights on the data, please reach out to us atsales(at)www.arena-ruc.com. If you are a member of the press, please contact us atpress(at)www.arena-ruc.comfor any media enquiries.
Q1 2023 Highlights
Published Date: May 9, 2023
Highlights:
The global smartphone market declined by 14% YoY and 7% QoQ to record 280.2 million unit shipments in Q1 2023.
三星replaced Apple as the top smartphone player in Q1 2023, driven by its mid-tier A Series and the recently launched S23 series.
Apple’s YoY shipment decline was the least among the top five brands. Consequently, it recorded its highest-ever Q1 share of 21%.
Global smartphone revenues declined by 7% YoY to around $104 billion. Apple, Samsung, Xiaomi increased their Average Selling Prices YoY.
For our detailed research on the global smartphone market in Q1 2023, clickhere.
Global Smartphone Shipments Market Share (%)
Brands
Q2 2021
Q3 2021
Q4 2021
Q1 2022
Q2 2022
Q3 2022
Q4 2022
Q1 2023
三星
18%
20%
19%
23%
21%
21%
19%
22%
Apple
15%
14%
22%
18%
16%
16%
23%
21%
Xiaomi
16%
13%
12%
12%
13%
13%
11%
11%
OPPO*
10%
11%
9%
9%
10%
10%
10%
10%
vivo
10%
10%
8%
8%
9%
9%
8%
7%
Others
31%
32%
30%
30%
31%
31%
29%
29%
Global Smartphone Shipments(in Millions)
Brands
Q2 2021
Q3 2021
Q4 2021
Q1 2022
Q2 2022
Q3 2022
Q4 2022
Q1 2023
三星
57.6
69.3
69.0
74.5
62.5
64.3
58.3
60.6
Apple
48.9
48.0
81.5
59.0
46.5
49.2
70.0
58.0
Xiaomi
52.5
44.4
45.0
39.0
39.5
40.5
33.2
30.5
OPPO*
33.6
38.1
33.9
30.9
28.2
29.5
29.6
24.0
vivo
32.5
33.7
29.3
24.8
25.5
26.0
23.4
21.2
Others
98.0
108.5
112.7
98.1
92.3
92.4
89.4
85.9
Total Market
323.1
342.0
371.4
326.4
294.5
301.9
303.9
280.2
*OPPO includes OnePlus since Q3 2021 **Ranking is according to the latest quarter.
Frequently asked question (FAQs):
• What’s the global market size for smartphones? The global smartphone market shipments declined to reach 280.2 million units in Q1 2023.
• What is the global market for mobile phones? The 2022 global smartphone shipments declined to 1.2 billion units, the lowest since 2013.
• Who dominates the smartphone market? Apple dominated the smartphone market in 2022 by achieving its highest-ever global shipments, revenue and operating profit share.
• How fast is the smartphone market growing? The global smartphone shipments declined by 12% in 2022.
Apple replaced Samsung as the top smartphone player in Q4 2022, driven by the recent launch of the iPhone 14 series.
Apple market sharefor Q4 2022 was 23% followed by Samsung market share of 19%.
The 2022 global smartphone shipments declined by 12% to 1.2 billion units, the lowest since 2013.
Global smartphone revenues declined by 9% to $409 billion, the lowest since 2017.
Apple achieved its highest-ever global smartphone shipment, revenue and operating profit share in 2022.
For our detailed research on the global smartphone market in Q4 2022, clickhere.
Global Smartphone Shipments Market Share (%)
Brands
Q1 2021
Q2 2021
Q3 2021
Q4 2021
Q1 2022
Q2 2022
Q3 2022
Q4 2022
Apple
17%
15%
14%
22%
18%
16%
16%
23%
三星
22%
18%
20%
19%
23%
21%
21%
19%
Xiaomi
14%
16%
13%
12%
12%
13%
13%
11%
OPPO*
11%
10%
11%
9%
9%
10%
10%
10%
vivo
10%
10%
10%
8%
8%
9%
9%
8%
Others
26%
31%
32%
30%
30%
31%
31%
29%
Global Smartphone Shipments(in Millions)
Brands
Q1 2021
Q2 2021
Q3 2021
Q4 2021
Q1 2022
Q2 2022
Q3 2022
Q4 2022
Apple
59.5
48.9
48.0
81.5
59.0
46.5
49.2
70.0
三星
76.6
57.6
69.3
69.0
74.5
62.5
64.3
58.3
Xiaomi
48.5
52.5
44.4
45.0
39.0
39.5
40.5
33.2
OPPO*
38
33.6
38.1
33.9
30.9
28.2
29.5
29.6
vivo
35.5
32.5
33.7
29.3
24.8
25.5
26.0
23.4
Others
96.8
98.0
108.5
112.7
98.1
92.3
92.4
89.4
Total Market
354.9
323.1
342.0
371.4
326.4
294.5
301.9
303.9
*OPPO includes OnePlus since Q3 2021 **Ranking is according to the latest quarter.
Q3 2022 Highlights
Published Date: December 20, 2022
The global smartphone market declined by 12% YoY even as it grew by 2% QoQ to reach 301 million units in Q3 2022.
While quarterly growth in Apple and Samsung pushed the global smartphone market above 300 million units, a level it failed to reach last quarter, political and economic instability drove negative consumer sentiment.
Apple was the only top-five smartphone brand to grow YoY, with shipments increasing 2% YoY, growing market share by two percentage points to 16%.
三星的出货量同比下降了8%,但增长了5%QoQ to 64 million.
Xiaomi, OPPO* and vivo, recovered slightly after receiving heavy beatings due to lockdowns in China in Q2, and as they captured more of the market ceded by Apple and Samsung’s exit from Russia.
Global Smartphone Shipments Market Share (%)
Brands
Q4 2020
Q1 2021
Q2 2021
Q3 2021
Q4 2021
Q1 2022
Q2 2022
Q3 2022
三星
16%
22%
18%
20%
19%
23%
21%
21%
Apple
21%
17%
15%
14%
22%
18%
16%
16%
Xiaomi
11%
14%
16%
13%
12%
12%
13%
13%
OPPO*
9%
11%
10%
11%
9%
9%
10%
10%
vivo
8%
10%
10%
10%
8%
8%
9%
9%
Others
35%
26%
31%
32%
30%
30%
31%
31%
Global Smartphone Shipments(in Millions)
Brands
Q4 2020
Q1 2021
Q2 2021
Q3 2021
Q4 2021
Q1 2022
Q2 2022
Q3 2022
三星
62.5
76.6
57.6
69.3
69.0
74.5
62.5
64.3
Apple
81.9
59.5
48.9
48.0
81.5
59.0
46.5
49.2
Xiaomi
43.0
48.5
52.5
44.4
45.0
39.0
39.5
40.5
OPPO*
34.0
38
33.6
38.1
33.9
30.9
28.2
29.5
vivo
33.4
35.5
32.5
33.7
29.3
24.8
25.2
26.0
Others
139.8
96.8
98.0
108.5
112.7
98.1
92.3
92.4
Total Market
394.6
354.9
323.1
342.0
371.4
326.4
294.5
301.9
*OPPO includes OnePlus since Q3 2021 **Ranking is according to the latest quarter.
Q2 2022 Highlights
Published Date: August 16, 2022
• The global smartphone market growth saw a decline of 9% YoY and 10% QoQ to 294.5 million units in Q2 2022. • Global smartphone market share carries on consolidation, with top three brands commanding 50% share for three consecutive quarters. • This was the first time quarterly shipments dropped below 300 million units since Q2 2020 during the early part of the COVID-19 pandemic. • Samsung was the only top-five smartphone brand to grow YoY, increasing shipments by 8% YoY and growing market share by three percentage points to 21%. • Apple market share declined by 5% YoY in Q2 2022, although its share increased in a diminished market. • iPhone shipment market share continues to edge upwards, with Apple reaching its highest Q2 2022 shipment share ever • The Android vs iOS market share battle, traditionally contested by Apple in the US, Europe and Japan, is intensifying in markets like China, which is becoming a significant driver of iOS installed based globally. •小米, OPPO* and vivo, hit by China lockdowns, suffered double digit YoY declines in their respective shipments.
Global Smartphone Shipments Market Share (%)
Brands
Q3 2020
Q4 2020
Q1 2021
Q2 2021
Q3 2021
Q4 2021
Q1 2022
Q2 2022
三星
22%
16%
22%
18%
20%
19%
23%
21%
Apple
11%
21%
17%
15%
14%
22%
18%
16%
Xiaomi
13%
11%
14%
16%
13%
12%
12%
13%
OPPO*
8%
9%
11%
10%
11%
9%
9%
10%
vivo
8%
8%
10%
10%
10%
8%
8%
9%
Others
38%
35%
26%
31%
32%
30%
30%
31%
Global Smartphone Shipments(in Millions)
Brands
Q3 2020
Q4 2020
Q1 2021
Q2 2021
Q3 2021
Q4 2021
Q1 2022
Q2 2022
三星
80.4
62.5
76.6
57.6
69.3
69.0
74.5
62.5
Apple
41.7
81.9
59.5
48.9
48.0
81.5
59.0
46.5
Xiaomi
46.5
43.0
48.5
52.5
44.4
45.0
39.0
39.5
OPPO*
31.0
34.0
38.0
33.6
38.1
33.9
30.9
28.2
vivo
31.0
33.4
35.5
32.5
33.7
29.3
24.8
25.5
Others
135.0
139.8
96.8
98.0
108.5
112.7
98.2
92.3
Total Market
365.6
394.6
354.9
323.1
342.0
371.4
326.4
294.5
*OPPO includes OnePlus since Q3 2021 **Ranking is according to the latest quarter.
Q1 2022 Highlights
Published Date: May 16, 2022
• The global smartphone market declined by 7% YoY and 12% QoQ to 328 million units in Q1 2022. • While Samsung’s shipments declined 3% YoY, it was the only top-five smartphone brand to grow QoQ. Its market share rose to 23% from 19% last quarter, resulting in Samsung taking the top spot from Apple in Q1 2022. • Apple’s shipments declined by 1% annually to reach 59 million units in Q1 2022. This was after an expected seasonal quarterly shipment decline of 28%. •小米, OPPO* and vivo’s component struggles continued, causing a quarterly and annual decline in their respective shipments.
Global Smartphone Shipments Market Share (%)
Brands
Q2 2020
Q3 2020
Q4 2020
Q1 2021
Q2 2021
Q3 2021
Q4 2021
Q1 2022
三星
20%
22%
16%
22%
18%
20%
19%
23%
Apple
14%
11%
21%
17%
15%
14%
22%
18%
Xiaomi
10%
13%
11%
14%
16%
13%
12%
12%
OPPO*
9%
8%
9%
11%
10%
11%
9%
9%
vivo
8%
8%
8%
10%
10%
10%
8%
8%
Others
39%
38%
35%
26%
31%
32%
30%
30%
全球智能手机出货量(百万)
Brands
Q2 2020
Q3 2020
Q4 2020
Q1 2021
Q2 2021
Q3 2021
Q4 2021
Q1 2022
三星
54.2
80.4
62.5
76.6
57.6
69.3
69.0
74.5
Apple
37.5
41.7
81.9
59.5
48.9
48.0
81.5
59.0
Xiaomi
26.5
46.5
43.0
48.5
52.5
44.4
45.0
39.0
OPPO
24.5
31.0
34.0
38.0
33.6
38.1
33.9
30.9
vivo
22.5
31.0
33.4
35.5
32.5
33.7
29.3
24.8
Others
110.9
135.0
139.8
96.8
98.0
108.5
112.7
98.1
Total Market
276.1
365.6
394.6
354.9
323.1
342.0
371.4
326.4
*OPPO includes OnePlus since Q3 2021 **Ranking is according to the latest quarter.
Why is the smartphone market declining in Q1 2022?
The global smartphone market growth saw a decline of 7% YoY, shipping 328 million units in Q1 2022 caused by the ongoing component shortages, as well as COVID resurgence at the beginning of the quarter and the Russia-Ukraine war towards the end. The global smartphone market also, as expected, had a seasonal decline of 12% QoQ. The component supply crunch was felt more severely by major Chinese OEMs such as Xiaomi, OPPO* and vivo as compared with Samsung, which seems to have overcome component shortages that affected its supply last year, as evidenced by higher-than-expected growth in its shipments despite a late flagship launch.
Consequently, Samsung regained the top spot from Apple which had emerged as the biggest smartphone vendor globally in Q4 2021 thanks to its latest iPhone 13 series.
Which country has the highest market share of smartphones globally?
与全球智能的市场份额在22.5%左右phone shipments in Q1 2022,China仍然是世界上最大的智能手机市场。这s is down from around 25.6% in Q1 2021 as China’s economy grew slower than expected due to COVID-related lockdowns and shipment volumes declined by over 19% YoY. While China’s share of global smartphone market growth (shipments) remains flat QoQ thanks to a small peak in demand during Chinese New Year and as the global smartphone market declined QoQ due to seasonality, in terms of absolute shipments, China saw a quarterly decline of over 12%.
HONOR has emerged as the biggest smartphone player in China, chipping into vivo and OPPO*’s shares and stepping into the position previously held by Huawei from which it recently separated. Although vivo did not succeed in regaining the top position due to HONOR’s rise at a time when it is itself facing component shortages, it did recover somewhat thanks to its newly launched mid-end S12 series that is popular with younger customers and the affordable the Y series which showed strong performance in the quarter.
Q4 2021 Highlights
Published Date: February 16, 2022
• Global smartphone market growth saw an increase of 4% YoY to reach 1.39 billion units in 2021. Q4 2021 shipments declined 6% YoY to reach 371 million units. •三星在2021年领导了全球智能手机市场with annual shipments of 272 million units. • Apple, Xiaomi, OPPO^ and vivo recorded their highest-ever annual shipments. • The top five brands gained share due to a significant decline by Huawei, and LG’s exit from the market. • Apple surpassed Samsung to take the number one spot in Q4 2021 with smartphone shipments increasing by 70% QoQ to 81.5 million units in Q4 2021, despite remaining flat YoY. • Apple recorded their highest-ever annual shipments of 237.9 million units in 2021 driven by successful launch of iPhone 13 series and consistent performance of iPhone 12 series.
Global Smartphone Shipments Market Share (%)
Brands
Q1 2020
Q2 2020
Q3 2020
Q4 2020
Q1 2021
Q2 2021
Q3 2021
Q4 2021
Apple
14%
14%
11%
21%
17%
15%
14%
22%
三星
20%
20%
22%
16%
22%
18%
20%
19%
Xiaomi
10%
10%
13%
11%
14%
16%
13%
12%
OPPO*
8%
9%
8%
9%
11%
10%
11%
9%
vivo
7%
8%
8%
8%
10%
10%
10%
8%
Others
41%
39%
38%
35%
26%
31%
32%
30%
全球智能手机出货量(百万)
Brands
Q1 2020
Q2 2020
Q3 2020
Q4 2020
Q1 2021
Q2 2021
Q3 2021
Q4 2021
Apple
40.0
37.5
41.7
81.9
59.5
48.9
48.0
81.5
三星
58.6
54.2
80.4
62.5
76.6
57.6
69.3
69.0
Xiaomi
29.7
26.5
46.5
43.0
48.5
52.5
44.4
45.0
OPPO*
22.3
24.5
31.0
34.0
38.0
33.6
38.1
33.9
vivo
21.6
22.5
31.0
33.4
35.5
32.5
33.7
29.3
Others
122.8
110.9
135.0
139.8
96.8
98.0
108.5
112.7
Total Market
295.0
276.1
365.6
394.6
354.9
323.1
342.0
371.4
*OPPO includes OnePlus since Q3 2021 **Ranking is according to the latest quarter.
Apple Market Share: Q4 2021
Apple Market Share (iPhone Shipments in Millions)
Quarter
Q1 2020
Q2 2020
Q3 2020
Q4 2020
Q1 2021
Q2 2021
Q3 2021
Q4 2021
Ship-ments (in Mn)
40.0
37.5
41.7
81.9
59.5
48.9
48.0
81.5
Q3 2021 Highlights
Published Date: November 16, 2021
• The global smartphone market growth saw an increase of 6% QoQ but declined by 6% YoY in Q3 2021, clocking global shipments of 342 million units, down from 365.6 million in Q3 2020. • Samsung retained the number one spot in Q3 2021 with smartphone shipments increasing by 20% QoQ to 69.3 million units in Q3 2021. •小米shipped 44.4 million units in Q3 2021, down 5% YoY and 15% QoQ as it was severely hit by the ongoing component shortages. • vivo grew 8% YoY and 3% QoQ to reach 33.7 million units. vivo continued to lead China’s smartphone market with 17.3 million units in Q3 2021. • realme achieved its highest-ever shipment performance with 16.2 million units in Q3 2021. The record quarter came at a time when component shortages were at their peak. • Global handset market wholesale revenue grew 10% YoY and 6% QoQ in Q3 2021 to reach over $103 billion.
Global Smartphone Shipments Market Share (%)
Brands
Q4 2019
Q1 2020
Q2 2020
Q3 2020
Q4 2020
Q1 2021
Q2 2021
Q3 2021
三星
18%
20%
20%
22%
16%
22%
18%
20%
Apple
18%
14%
14%
11%
21%
17%
15%
14%
Xiaomi
8%
10%
10%
13%
11%
14%
16%
13%
OPPO
8%
8%
9%
8%
9%
11%
10%
11%
vivo
8%
7%
8%
8%
8%
10%
10%
10%
Others
40%
41%
39%
38%
35%
26%
31%
32%
Global Smartphone Shipments
Brands
Q4 2019
Q1 2020
Q2 2020
Q3 2020
Q4 2020
Q1 2021
Q2 2021
Q3 2021
三星
70.4
58.6
54.2
80.4
62.5
76.6
57.6
69.3
Apple
72.3
40.0
37.5
41.7
81.9
59.5
48.9
48.0
Xiaomi
32.9
29.7
26.5
46.5
43.0
48.5
52.5
44.4
OPPO
30.7
22.3
24.5
31.0
34.0
38.0
33.6
38.1
vivo
31.5
21.6
22.5
31.0
33.4
35.5
32.5
33.7
Others
163.4
122.8
110.9
135.0
139.8
96.8
98.0
108.5
Total Market
401.1
295.0
276.1
365.6
394.6
354.9
323.1
342.0
*Ranking is according to the latest quarter.
Q2 2021 Highlights
Published Date: August 16, 2021
• Global smartphone market grew 19% YoY but declined by 7% QoQ as 323 million units were shipped, led by Samsung. •小米eclipses 52 million smartphones, becoming the world’s second-largest smartphone brand for the first time ever. • Samsung retained the number one spot with shipments reaching 58 million units in Q2 2021, however, its market share declined to 18% as compared to 22% in Q1 2021 as its shipments declined by 24% QoQ. • realme grew by 135% YoY and 17% QoQ, crossing cumulative shipments of 100 million smartphones since its entry into the smartphone market. • Global smartphone shipment revenues grew by 25% YoY to $96 billion in Q2 2021 setting a second-quarter record.
Global Smartphone Shipments Market Share (%)
Brands
Q3 2019
Q4 2019
Q1 2020
Q2 2020
Q3 2020
Q4 2020
Q1 2021
Q2 2021
三星
21%
18%
20%
20%
22%
16%
22%
18%
Xiaomi
8%
8%
10%
10%
13%
11%
14%
16%
Apple
12%
18%
14%
14%
11%
21%
17%
15%
OPPO
9%
8%
8%
9%
8%
9%
11%
10%
vivo
8%
8%
7%
8%
8%
8%
10%
10%
Others
42%
40%
41%
39%
38%
35%
26%
31%
Global Smartphone Shipments
Brands
Q3 2019
Q4 2019
Q1 2020
Q2 2020
Q3 2020
Q4 2020
Q1 2021
Q2 2021
三星
78.2
70.4
58.6
54.2
80.4
62.5
76.6
57.9
Xiaomi
31.7
32.9
29.7
26.5
46.2
43.0
48.5
52.5
Apple
44.8
72.3
40.0
37.5
41.7
81.9
59.5
48.9
OPPO
32.3
31.4
22.3
24.5
31.0
34.0
38.0
33.6
vivo
31.3
31.5
21.6
22.5
31.0
33.4
35.5
32.5
Others
161.7
162.6
122.8
110.9
135.3
139.8
96.8
97.7
Total
Market
380.0
401.1
295.0
276.1
365.6
394.6
354.9
323.1
*Ranking is according to the latest quarter.
Q1 2021 Highlights
Published Date: May 16, 2021
• Global smartphone shipment revenue crossed the $100 billion mark for the first time for a March-ending quarter to reach $113 billion. • Global shipments grew 20% YoY, reaching 354 million units, led by OPPO, vivo, Xiaomi and Apple. • Samsung regained its top spot as the world’s biggest OEM, with shipments reaching 76.8 million units in Q1 2021. • Apple iPhone active installed base reached a new high this quarter.
Global Smartphone Shipments Market Share (%)
Brands
Q2 2019
Q3 2019
Q4 2019
Q1 2020
Q2 2020
Q3 2020
Q4 2020
Q1 2021
三星
21%
21%
18%
20%
20%
22%
16%
22%
Apple
10%
12%
18%
14%
14%
11%
21%
17%
Xiaomi
9%
8%
8%
10%
10%
13%
11%
14%
OPPO
9%
9%
8%
8%
9%
8%
9%
11%
vivo
8%
8%
8%
7%
8%
8%
8%
10%
Huawei#
16%
18%
14%
17%
20%
14%
8%
4%
realme
1%
3%
2%
2%
2%
4%
4%
4%
Others
24%
21%
23%
22%
16%
20%
23%
18%
Global Smartphone Shipments
Brands
Q2 2019
Q3 2019
Q4 2019
Q1 2020
Q2 2020
Q3 2020
Q4 2020
Q1 2021
三星
76.3
78.2
70.4
58.6
54.2
80.4
62.5
76.6
Apple
36.5
44.8
72.3
40.0
37.5
41.7
81.9
59.5
Xiaomi
32.3
31.7
32.9
29.7
26.5
46.2
43.0
48.5
OPPO
30.6
32.3
31.4
22.3
24.5
31.0
34.0
38.0
vivo
27.0
31.3
31.5
21.6
22.5
31.0
33.4
35.5
Huawei#
56.6
66.8
56.2
49.0
54.8
50.9
33.0
15.0
realme
5.0
10.2
7.8
7.2
6.4
14.8
14.0
12.8
Others
92.8
84.7
98.6
66.6
49.7
69.6
92.8
69.0
Total
Market
357.1
380.0
401.1
295.0
276.1
365.6
394.6
354.9
*Ranking is according to the latest quarter.
#Huawei includes HONOR in all quarters except Q1 2021 reflecting the separation of the two brands.
Q4 2020 Highlights
Published Date: February 16, 2021
• The global smartphone market continued to recover in Q4 2020, rebounding 8% QoQ to 395.9 million units. • Apple’s 8% YoY and 96% QoQ growth helped it lead the market in Q4 2020. • Samsung slipped to the second spot with 62.5 million units in Q4 2020, However, it led the overall market in CY 2020. • For the first time, OPPO and vivo surpassed Huawei to capture the fourth and fifth spots respectively, Huawei slipped to the sixth spot. • realme emerged as the fastest growing brand in CY 2020 with 65% YoY growth.
Global Smartphone Shipments Market Share (%)
Brands
Q1 2019
Q2 2019
Q3 2019
Q4 2019
Q1 2020
Q2 2020
Q3 2020
Q4 2020
Apple
12%
10%
12%
18%
14%
14%
11%
21%
三星
21%
21%
21%
18%
20%
20%
22%
16%
Xiaomi
8%
9%
8%
8%
10%
10%
13%
11%
OPPO
8%
9%
9%
8%
8%
9%
8%
9%
vivo
7%
8%
8%
8%
7%
8%
8%
8%
Huawei#
17%
16%
18%
14%
17%
20%
14%
8%
realme
1%
1%
3%
2%
2%
2%
4%
4%
Others
24%
24%
21%
23%
22%
16%
20%
23%
Global Smartphone Shipments
Brands
Q1 2019
Q2 2019
Q3 2019
Q4 2019
Q1 2020
Q2 2020
Q3 2020
Q4 2020
Apple
42.0
36.5
44.8
72.3
40.0
37.5
41.7
81.9
三星
72.0
76.3
78.2
70.4
58.6
54.2
80.4
62.5
Xiaomi
27.8
32.3
31.7
32.9
29.7
26.5
46.2
43.0
OPPO
25.7
30.6
32.3
31.4
22.3
24.5
31.0
34.0
vivo
23.9
27.0
31.3
31.5
21.6
22.5
31.0
33.4
Huawei#
59.1
56.6
66.8
56.2
49.0
54.8
50.9
33.0
realme
2.8
5.0
10.2
7.8
7.2
6.4
14.8
14.0
Others
87.7
92.8
84.7
98.6
66.6
49.7
69.6
92.8
*Ranking is according to the latest quarter. #Huawei includes HONOR.
Q3 2020 Highlights
三星regained the top spot, shipping 80.4 million units with 48% QoQ and 3% YoY growth with the highest ever shipment in the last three years.
Realme shipment grew 132% QoQ, becoming the world’s fastest brand to hit 50 million shipments since inception.
小米在总smar不可小觑贡献13%增长了75%tphone shipment. Notably, this was also the first time when Xiaomi surpassed Apple to capture the third spot.
The market share for BBK Group (OPPO, Vivo, Realme, and OnePlus) has increased from 20% in Q2 to 22% in Q3 2020. The group is close to becoming the largest smartphone manufacturer group globally with three of its brands in the top 10.
Global Smartphone Shipments Market Share (%)
Brands
Q4 2018
Q1 2019
Q2 2019
Q3 2019
Q4 2019
Q1 2020
Q2 2020
Q3 2020
三星
18%
21%
21%
21%
18%
20%
20%
22%
Huawei#
15%
17%
16%
18%
14%
17%
20%
14%
Xiaomi
6%
8%
9%
8%
8%
10%
10%
13%
Apple
17%
12%
10%
12%
18%
14%
14%
11%
OPPO
8%
8%
9%
9%
8%
8%
9%
8%
vivo
7%
7%
8%
8%
8%
7%
8%
8%
realme
–
1%
1%
3%
2%
2%
2%
4%
Others
26%
24%
24%
21%
23%
22%
16%
20%
Global Smartphone Shipments
Brands
Q4 2018
Q1 2019
Q2 2019
Q3 2019
Q4 2019
Q1 2020
Q2 2020
Q3 2020
三星
69.8
72.0
76.3
78.2
70.4
58.6
54.2
80.4
Huawei#
59.7
59.1
56.6
66.8
56.2
49.0
54.8
50.9
Xiaomi
25.6
27.8
32.3
31.7
32.9
29.7
26.5
46.2
Apple
65.9
42.0
36.5
44.8
72.3
40.0
37.5
41.7
OPPO
31.3
25.7
30.6
32.3
31.4
22.3
24.5
31.0
vivo
26.5
23.9
27.0
31.3
31.5
21.6
22.5
31.0
realme
–
2.8
5.0
10.2
7.8
7.2
6.4
14.8
Others
115.8
87.7
92.8
84.7
98.6
66.6
48.6
69.6
*Ranking is according to the latest quarter.
#Huawei includes HONOR.
Q2 2020 Highlights
The share of the top 10 brands reached 88% compared to 80% last year. Brands outside of the top 10 declined 55% YoY. The impact of COVID-19 was more severe on smaller brands that tend to have lower online presence and that tend to cater more to the entry-level segments.
Huawei continued its push in China and surpassed Samsung to lead the global smartphone market. Huawei’s shipments declined only 3% YoY globally as it grew 11% YoY in China.
三星declined 29% YoY as its core markets including LATAM, India, the USA and Europe were struggling from the effects of the pandemic and lockdowns.
realmewas the only major brand achieving double-digit annual growth. realme grew 11% YoY in the quarter as several markets in Europe and India recovered in June. realme was also the fastest-growing brand in the quarter and was number 7th in terms of sales.
Apple iPhone shipments grew 3% YoY and revenues grew 2% YoY. The company saw sustained momentum of the iPhone 11 and a great sales start of the iPhone SE. All regions saw revenue growth.
Global Smartphone Shipments Market Share (%)
Brands
Q3 2018
Q4 2018
Q1 2019
Q2 2019
Q3 2019
Q4 2019
Q1 2020
Q2 2020
Huawei#
14%
15%
17%
16%
18%
14%
17%
20%
三星
19%
18%
21%
21%
21%
18%
20%
20%
Apple
12%
17%
12%
10%
12%
18%
14%
14%
Xiaomi
9%
6%
8%
9%
8%
8%
10%
10%
OPPO
9%
8%
8%
9%
9%
8%
8%
9%
vivo
8%
7%
7%
8%
8%
8%
7%
8%
Lenovo##
3%
3%
3%
3%
3%
3%
2%
3%
Others
26%
26%
24%
24%
21%
23%
22%
16%
Global Smartphone Shipments
Brands
Q3 2018
Q4 2018
Q1 2019
Q2 2019
Q3 2019
Q4 2019
Q1 2020
Q2 2020
Huawei#
52.0
59.7
59.1
56.6
66.8
56.2
49.0
54.8
三星
72.3
69.8
72.0
76.3
78.2
70.4
58.6
54.2
Apple
46.9
65.9
42.0
36.5
44.8
72.3
40.0
37.5
Xiaomi
33.3
25.6
27.8
32.3
31.7
32.9
29.7
26.5
OPPO
33.9
31.3
25.7
30.6
32.3
31.4
22.3
24.5
vivo
30.5
26.5
23.9
27.0
31.3
31.5
21.6
22.5
Lenovo##
11.0
10.1
9.5
9.5
10.0
11.7
5.9
7.5
Others
110.9
115.8
87.7
92.8
84.7
98.6
66.6
48.6
*Ranking is according to the latest quarter. #Huawei includes HONOR. ##Lenovo includes Motorola.
Q1 2020 Highlights
The global smartphone market declined its fastest ever, down 13% YoY in Q1 2020.
这s is the first time since Q1 2014, that the smartphone market has fallen below 300Mn units in a quarter.
The COVID-19 pandemic has disrupted the signs of any recovery that the market started showing in Q4 2019.
三星led the smartphone market during the quarter capturing one-fifth of the global smartphone shipments. The OEM declined 18% YoY during the quarter and is expected to see a steeper decline in Q2 2020.
Huawei continued its push in China and surpassed Apple again during the quarter. The OEM declined 17% YoY during the quarter. Over half of the smartphone shipments for Huawei are now in China.
Apple remained resilient even during the COVID-19 as iPhone shipments declined only 5% YoY during the quarter. The iPhone revenues were down 7% YoY for the same period. The impact on some European and Asian countries was mild.
Xiaomi grew 7% YoY during the quarter. The OEM continued to lead theIndiasmartphone market reaching its highest ever market share (30%) since Q1 2018.
Compared to other major OEMs, Vivo declined less (10% YoY) during the quarter. A strong performance in the Indian Smartphone Market partially offset declines in other markets.
Global smartphone shipments reached 401 million units in Q4 2019 showing a 2% YoY growth as compared to Q4 2018.
The top three brands,三星, Huawei and Apple, captured more than 50% of the smartphone market, with the rest of the market left for hundreds of other brands to compete fiercely.
三星remained flat during 2019 Q4 while grew 2% YoY for CY 2019.三星has been one的leading players in 5G in 2019, shipping over 6.5 Million 5G capable devices in 2019.
Apple iPhone shipments grew 10% YoY during the Q4 2019 even without a 5G variant.The iPhone 11 seriesreceived an excellent consumer response in all regions. The dual-camera and lower pricing of iPhone 11 helped propel sales.
realme continued its growth streak and remained the fastest growing brand during the quarter (163% YoY) as well as the year (453% YoY). The brand entered the top five in the Indian market for the full year, which contributed to its strong growth.
The top three brands, Samsung, Huawei and Apple, together cornered almost half of the smartphone market, with the rest of the market left for hundreds of other brands to compete fiercely.
三星continued its growth at 8.4%YoY, capturing over one-fifth of the global smartphone market. This is due to strong Note 10 and Galaxy A series sales.
Huaweigrew a very healthy 28.5% YoY globally. It captured a record 40% market share in the Chinese smartphone market.
Apple iPhone shipments were down 4%,and as a result revenues fell 11% YoY.
BBK Group (OPPO, Vivo, Realme, and OnePlus) is close to becoming the largest smartphone manufacturer groupglobally, accounting for over 20% of the global smartphone market and three of its brands in the top 10.
For Q4 2018,Huawei, OPPO and vivocontinue to dominate with strong performances in China, India, Asia and parts of Europe. The trio have multiple regions to enter and grow moving forward into 2019.
三星andApplesaw a tough quarter and tough 2018 as demand for their flagship phones have waned due to competition from affordable premium and more cutting-edge phones from Chinese brands such as Huawei and OnePlus.
Xiaomireached a record fourth position for the full year after two years of setbacks thanks to immense growth in India. It has surpassed OPPO globally to take back the fourth position.
Smartphone shipments declined 2% annually to 360 million units in Q2 2018.
The top 10 brands accounted for 79% of the smartphone volumes in Q2 2018.
三星led the smartphone market by volume with a market share of 20% in Q2 2018 even though it registered an annual decline of 11% due to weak sales of its flagship Galaxy S9 series smartphones.
Huawei shipments grew 41% annually in Q2 2018. The company managed to be the fastest growing (21%) smartphone brand amid a declining China smartphone market and grew fully 71% overseas.
Apple shipped 41.3 million iPhones during Q2 2018, up 1% compared to the same quarter last year. iPhone X remains the top seller for Apple during the quarter.
Smartphone shipments declined 3% annually reaching 360 million units in Q1 2018.
The China market decline in Q1 2018, affected the overall growth of some of the key Chinese brands including OPPO and vivo. Both saw a decline in the quarter as a result of the China market slowdown.
智能手机普及率的所有手机域名下降到76%le phones shipped in the quarter. This was partly due to an increase in feature phone shipments by some key brands such as Nokia HMD and Reliance Jio who both saw YoY growth.
Top 10 brands accounted for 76% of the smartphone volumes in Q1 2018.
5G RedCap promises a mix of capabilities including improved throughput, extended battery life and less complexity to power diverse use cases cost-effectively.
5G RedCap (including eRedCap) modules are expected to contribute to one-fourth of total cellular IoT module shipments by 2030.
5G RedCap will serve use cases such as wearables, medical devices, video surveillance, industrial sensors and smart grid applications.
We have come a long way from the first generation (1G) to the fifth generation (5G) of cellular connectivity. Despite being in the initial stages of its rollout, 5G is poised for adoption at a speed not seen by previous cellular standards.
However, from the IoT perspective, 5G is being considered only for high-end applications due to the higher cost and existence of many use cases which need low power and low bandwidth, currently served by LPWAN. We can see the potential that 5G brings to IoT applications in terms of faster connectivity, low latency, reliability and large capacity compared to LTE networks. These benefits make 5G valuable for certain IoT use cases, creating a need for low-end 5G for the LPWAN application.
What are 5G RedCap and 5G eRedCap?
5G RedCap(Reduced Capacity), aka NR-Lite (New Radio-Lite), is a lighter version of the 5G standard that will cater to those use cases where ultra-low latency is not essential, but there is a need for reasonable throughput to support data flows in applications likerouter/CPE, mass-marketautomotive,POSandtelematicsdevices, which are currently addressed by LTE Cat 4. In the upcoming 3GPP Release-18, there will be another version of 5G RedCap, calledeRedCap(enhanced-RedCap), which will serve the use cases currently being served by LTE Cat 1 and LTE Cat 1 bis.
Market opportunity for 5G RedCap
5G RedCap addresses new use cases that cannot be served byadvanced 5Gstandards like eMBB/URLLC and LPWAN. 5G RedCap chipset is already available in the market but we can expect commercial rollout by the first half of 2024. According to Counterpoint Research’sGlobal Cellular IoT Module Forecast, 5G RedCap modules will constitute18%of total cellular IoT module shipments by 2030, indicating a significant market potential, particularly in developing nations where the cost is key to wide technology adoption fordigital transformation.
The subsequent 5G eRedCap is planned for a 2024 introduction, with commercial availability likely by 2026. Expected to bring further innovations to theIoTsegment, 5G eRedCap modules are projected to contribute8%to the total cellular IoT module shipments by 2030.
During the transition phase, network operators will maintain IoT device support through the existing 4G network while focusing on 5G high-end applications like routers/CPE,XR/VRdevices and automotive.
By the end of the decade, cellular IoT will generally migrate to 5G, driven by new use cases offered by the 5G network, with 4G serving as a fallback. The industry is already preparing for this shift, moving away from legacy technology towards newer standards.
5G RedCap ecosystem and applications
We can see a flurry of new announcements from ecosystem players to adopt the 5G RedCap standard. Module and chipset players are forging partnerships to capture the opportunity which will be created by 5G RedCap.Qualcommalways has been at the forefront when it comes to adopting new technologies with big potential. We can see that with its launch of the industry’s firstSDX355G RedCap modem. Qualcomm’s early entry and partnerships with major module vendors will help it to grab more market share in 5G when the mass adoption of 5G RedCap will take place.
5G RedCap will serve the use cases in industrial, enterprise and consumer applications, like smart wearables, medical devices, XR glasses, health monitors, videosurveillance cameras, wireless industrial sensors,utility/smartgrid applications and even Fixed Wireless Access (FWA) and customer premises equipment (CPEs).
5G eRedCap is likely to be preferred for the applications served by4G Cat 1, such as tracking devices, charging stations, micro-mobility and battery-powered sensors.
Conclusion
5G RedCap promises to broaden the 5G ecosystem, facilitating more connections. It fills the gap betweenLPWAandURLLC, simplifying 5G integration in IoT applications. 5G RedCap and eRedCap modules will be cost-effective, enabling OEMs to manufacture less complex, low-cost devices with lower power consumption, something that standard 5G cannot offer.
Though 5G at the IoT level is a few years out, vendors can create devices operable over LTE, with an easy switch to RedCap by changing the communication module. This allows immediate product deployment, with an easy future transition to 5G RedCap as the standard evolves.
5G RedCap’sflexibilityand network advantages, includinglowerlatencyandhigherspeedscompared to previous LTE generations, position it as a superior choice for future mass IoT deployment. Numerous potential connections across consumer, industrial and enterprise verticals such as FWA, CPE and vehicle connectivity will greatly benefit, accelerating IoT adoption on a massive scale.
India’s premium smartphone segment now contributes a record 17% to its overall shipments.
With an 18% share, Samsung led India’s smartphone market for the third consecutive quarter.
三星also surpassed Apple to become the top premium segment (>INR 30,000 or ~ $366) brand.
Apple continued to lead the ultra-premium segment (>INR 45,000 or ~$549) with a 59% share.
vivo maintained its second position. It was the only brand among the top five to experience YoY growth.
OnePlus was the fastest-growing brand in India’s smartphone market in Q2 with 68% YoY growth.
New Delhi, Hong Kong, Seoul, London, Beijing, San Diego, Buenos Aires – July 28, 2023
India’s smartphone shipmentsdeclined 3% YoYin Q2 2023 (April-June), according to the latest research from Counterpoint’sMonthly India Smartphone Tracker. Though this decline was the fourth consecutive quarterly decline, its magnitude reduced significantly, from19% in Q1to 3% in Q2. Base effect, pent-up demand and improving macroeconomic conditions helped the market close at less than the expected decline. However, the premium smartphone segment presented a different picture, growing 112% YoY in Q2 to contribute a record 17% to the overall shipments.
Commenting on the market dynamics,Senior Research AnalystShilpi Jainsaid, “In Q2 2023, OEMs saw improvement in the inventory and demand situation ahead of the coming festive season. Aggressive measures were implemented by OEMs as well as channels during the quarter to clear existing inventory through multiple sales and promotions. At the consumers’ end, falling inflation and better growth prospects facilitated demand recovery.5Gupgrades also played a major role as OEMs kept launching 5G devices in the INR 10,000-INR 15,000 (~$122-$244) segment for a wider reach. We believe brands will be coming up with interesting launches and offers to lure consumers during the festive season and 5G will be a big growth driver here.”
Source: Counterpoint Research Market Monitor
Notes: Xiaomi includes POCO; OPPO excludes OnePlus; vivo includes iQOO; Figures not exact due to rounding
Commenting on the competitive landscape and brand-level analysis,Research Analyst Shubham Singhsaid, “三星remained at the top position for the third consecutive quarter with an 18% market share. The brand also surpassed Apple to regain its top position in the premium smartphone segment (>INR 30,000, ~$366) after one year with a 34% share. Aggressive offers on theZ Flip3and S21 FE, Samsung Finance+ and high demand for the latest premium A-series and F-series devices drove this growth. However,Applecontinued to lead the ultra-premium segment (>INR 45,000 or ~$549) with a 59% share. India is now among Apple’s top-five markets.”
“vivo maintained its second spot in the overall market and was the only brand among the top five to experience YoY growth. Strong offline presence, growth of sub-brand iQOO in online, and multiple launches across price tiers facilitated this growth. OPPOhas been consistently expanding its shipments in the higher-tier segments, with a particular focus on the upper mid-tier range (INR 20,000-INR 30,000 or ~$244-$366), showcasing its strategy to cater to diverse consumer needs. OPPO emerged as the top brand in this segment with a 21% market share.OnePluswas the fastest growing brand in India’s smartphone market in Q2 with 68% YoY growth.”
Other key insights
5G smartphone growth: In Q2 2023, 5G smartphone shipments in India crossed the 100-million cumulative mark as 5G upgrades picked up pace driven by the expansion of 5G networks and availability of affordable devices. 5G smartphone shipments grew 59% YoY during the quarter.
Premiumization trend: The premiumization trend gained momentum as the segment grew at a faster rate of 112% YoY. Rise of a value-based incentive system for retailers, aggressive promotions, availability of credit through various financing schemes, and OEMs’ focussed approach are driving premiumization in India.
Channel dynamics: Offline channel share has been growing and is expected to rise to 54% in 2023. Online-heavy brands like Xiaomi, realme and OnePlus are now emphasizing offline expansion to enhance customer engagement and ecosystem development. Samsung and Apple are also increasing their offline presence to cater to diverse consumer preferences. This shift reflects a more comprehensive approach, leveraging both online and offline channels to create a seamless and personalized customer experience.
4G feature phone growth: 4G feature phone share in the overall feature phone shipments increased to 10% in Q2 2023 driven by the JioBharat and itel Guru series’ launch. We believe this share will increase to 18% by the end of 2023. Growing demand for UPI, multiple launches from OEMs and Reliance push will help the segment grow further.
Inventory levels: The market was able to exit Q2 2023 with eight weeks of inventory as Xiaomi and realme managed to clear most of their inventory through multiple sales and promotions.
Other notable brandswhich grew during Q2 2023 were Apple (56% YoY), Transsion (34%), Lava (53% YoY) and Nokia (6% YoY).
The comprehensive and in-depth ‘Q2 2023 Market Monitor’is available for subscribing clients.
Feel free to contact us atpress@www.arena-ruc.comfor questions regarding our latest research and insights.
The Market Monitor research relies on sell-in (shipments) estimates based on vendors’ IR results and vendor polling, triangulated with sell-through (sales), supply chain checks and secondary research.
Counterpoint Technology Market Research is a global research firm specializing in products in the TMT (technology, media and telecom) industry. It services major technology and financial firms with a mix of monthly reports, customized projects and detailed analyses of the mobile and technology markets. Its key analysts are seasoned experts in the high-tech industry.
The rising adoption of advanced multimode cellular (5G, 4G) and wireless (Wi-Fi 6/6E/7) delivers powerful benefits while also driving significant RF complexity in smart connected devices. 5G and Wi-Fi 7 integration has multiple challenges that need cutting-edge RF design, components and end-to-end optimization. There are multiple players in the RF Front-End (RFFE) ecosystem, but most are specialists in only one or a few areas.
这s paper highlights the technology potential of these powerful wireless technologies, complexity it brings and how product designers and manufacturers can solve these complexities with an advanced, end-to-end optimized and integrated RFFE solution.
Table of Contents:
Executive Summary
Proliferating 5G+Wi-Fi 7 A Massive Opportunity
5G+Wi-Fi 7 Takes Wireless Performance to the Next Level
5G+Wi-Fi 7 Coexistence Brings RF Complexity
5G+Wi-Fi 7 Solutions for Potential Challenges to Performance Enhancement
Colombian telecom operators and government are positive about the outcome of the 5G spectrum auction in December.
The government, telecom operators and regulatory bodies want to increase broadband penetration and provide training to Colombians to bridge the digital divide.
Telecom operators ETB and Claro shared their plans to leverage 5G to enhance verticals like education, mobility, and B2B services.
Even asColombialooks forward to holding its first 5G auction in December this year, it has much more basic and long-pending telecom sector-related issues that need the attention of all stakeholders, whether the operators or government departments. It is with this in mind that representatives from the Colombian government, regulatory bodies, telecom operators and manufacturers gathered in the nation’s capital, Bogota, at the end of June for the Conecta Colombia summit. The event, which is a part of the series that Conecta Latam organizes in the region, saw discussions on regulation, technology and, of course, business. A team of analysts from Counterpoint was also present at the event. Here are their key takeaways:5G and connectivity expansionThe potential of 5G technology and its impact on various sectors were essential discussion topics at the event. Telecom operators ETB and Claro shared their plans to leverage 5G to enhance verticals like education, mobility, and B2B services. Investments in broadband and 4G were also emphasized as ongoing priorities alongside the imminent 5G auction. The discussions also recognized the need to focus on network coverage and connectivity expansion, ensuring that before the widespread adoption of 5G.
Main 5G verticals to be developed in Colombia, including a $166 billion opportunity until 2035 as per Hugo Chang at Nokia.
Security and digital transformation
Bridging the digital divideAccording to the regulators, by the end of Q1 2023, Colombia had 9 million fixed broadband connections, which means that only approx. 61% of households in Colombia have access to fixed broadband. Highlighting Colombia’s digital divide, speakers at the summit emphasized the need to address challenges Colombians have such as lack of technical skills and connectivity. The government, telecom operators and regulatory bodies discussed strategies to increase broadband penetration, provide training to Colombians, involve regional stakeholders in the sector decision-making, and improve job formalization. The focus was on leveraging technology to narrow the digital divide and ensure equal access to digital opportunities.
“Centros Digitales” at the core of the solution to bridge the digital divide. MinTic aims to reach 85% broadband penetration by 2031 compared to 61% in Q1 2023.5G and connectivity expansionThe potential of 5G technology and its impact on various sectors were essential discussion topics at the event. Telecom operators ETB and Claro shared their plans to leverage 5G to enhance verticals like education, mobility, and B2B services. Investments in broadband and 4G were also emphasized as ongoing priorities alongside the imminent 5G auction. The discussions also recognized the need to focus on network coverage and connectivity expansion, ensuring that before the widespread adoption of 5G.
Main 5G verticals to be developed in Colombia, including a $166 billion opportunity until 2035 as per Hugo Chang at Nokia.Security and digital transformation
During 2022 there were 20 billion failed cyberattacks in Colombia as disclosed by a Fortinet study, based on that government officials and telecom operators highlighted the importance of cybersecurity for the industry. Panel discussions emphasized the need for a national entity to coordinate carrier efforts and use artificial intelligence (AI) as a defensive tool. Besides, the event explored the concept of digital transformation withintelecomcompanies, with discussions revolving around employee training, customer experience and the transformation of big data into “mega data” facilitated by 5G. The role of alternative revenue drivers such as VoLTE and MVNO products were also highlighted as options before the 5G benefits come to play.
Saul Kattan, technical consultant of the Colombian presidency leads the panel discussion on the role of a national cybersecurity entity sponsored by the government.What is next?On August 1, the regulator will publish the first draft of the auction process, covering the mechanism to be followed and the required technical conditions for the applicants. The second draft will be released one month later and the final in October. In November and December, all the interested parties will submit their applications for the auction, which will start on December 20. 2024 can become the year of the 5G availability in the country.
5G auction and 4G spectrum renovations chronogram.Bridging the digital divideAccording to the regulators, by the end of Q1 2023, Colombia had 9 million fixed broadband connections, which means that only approx. 61% of households in Colombia have access to fixed broadband. Highlighting Colombia’s digital divide, speakers at the summit emphasized the need to address challenges Colombians have such as lack of technical skills and connectivity. The government, telecom operators and regulatory bodies discussed strategies to increase broadband penetration, provide training to Colombians, involve regional stakeholders in the sector decision-making, and improve job formalization. The focus was on leveraging technology to narrow the digital divide and ensure equal access to digital opportunities.
“Centros Digitales” at the core of the solution to bridge the digital divide. MinTic aims to reach 85% broadband penetration by 2031 compared to 61% in Q1 2023.5G and connectivity expansionThe potential of 5G technology and its impact on various sectors were essential discussion topics at the event. Telecom operators ETB and Claro shared their plans to leverage 5G to enhance verticals like education, mobility, and B2B services. Investments in broadband and 4G were also emphasized as ongoing priorities alongside the imminent 5G auction. The discussions also recognized the need to focus on network coverage and connectivity expansion, ensuring that before the widespread adoption of 5G.
Main 5G verticals to be developed in Colombia, including a $166 billion opportunity until 2035 as per Hugo Chang at Nokia.Security and digital transformation
During 2022 there were 20 billion failed cyberattacks in Colombia as disclosed by a Fortinet study, based on that government officials and telecom operators highlighted the importance of cybersecurity for the industry. Panel discussions emphasized the need for a national entity to coordinate carrier efforts and use artificial intelligence (AI) as a defensive tool. Besides, the event explored the concept of digital transformation withintelecomcompanies, with discussions revolving around employee training, customer experience and the transformation of big data into “mega data” facilitated by 5G. The role of alternative revenue drivers such as VoLTE and MVNO products were also highlighted as options before the 5G benefits come to play.
Saul Kattan, technical consultant of the Colombian presidency leads the panel discussion on the role of a national cybersecurity entity sponsored by the government.What is next?On August 1, the regulator will publish the first draft of the auction process, covering the mechanism to be followed and the required technical conditions for the applicants. The second draft will be released one month later and the final in October. In November and December, all the interested parties will submit their applications for the auction, which will start on December 20. 2024 can become the year of the 5G availability in the country.
5G auction and 4G spectrum renovations chronogram.
Our Senior AnalystAnkit Malhotrais joining the third edition of India Gaming Conclave. He will be moderating a panel discussion on the 12th July 2023. More details below:
Title:5G Ready India – The Future of Entertainment and Gaming Industry with Innovations in Smartphone’s & Devices 达te:Wednesday, July 12, 2023 Time:11:00 AM IST Speakers:
The gaming and esports industry in India is undergoing a massive transformation due to the mobile revolution – There has been over 20% growth in casual gaming because of Smartphone’s, Growth in Digital Infrastructure, Increased Adoption of Digital Payments, Incentive to Win Money in Transaction Based Games & a Young Population. In India about 5.6 billion mobile game applications were downloaded in 2019 which is globally the highest. According to latest reports by KPMG the total Indian Gaming Market is expected to grow 113% from INR 136 billion in 2022 to INR 290 billion in 2025. The online casual gaming segment is poised to see the fastest growth with revenues growing 182% from INR 60 billion in 2022 to INR 169 billion in 2025. Moreover, the number of online gaming users in India is poised to grow from 481 Mn in 2022 to over 657 Mn by 2025
Industry estimates indicate 3.5 billion users are available thru social channels and 2.5 billion are gamers. About 74% of the social universe is at gaming but the ad spends in India is less than 5% – India is on the growth trajectory on the supply side with Indian studios growing to produce better games, investor interest and better localization of gaming content.
The Saudi Arabia smartphone market was among the few to record YoY growth in Q1 2023.
Even as many economies struggled in 2022 amid macroeconomic and geopolitical pressures, Saudi Arabia was bolstered by its highest oil revenues in decades, all-time-low unemployment rates, all-time-high non-oil economic activity and strong private consumption.
Among OEMs, Samsung and Apple continued to take over half of the total smartphone shipments in Q1 2023, with Samsung taking the #1 spot.
We expect the Saudi Arabia smartphone market to continue its growth momentum in 2023, with annual shipments likely to grow in low single digits.
The Saudi Arabia smartphone market was among the few to record YoY growth in Q1 2023, with shipments growing 26% YoY largely due to strong macroeconomic fundamentals, accelerating digitalization, and growing device financing options. In QoQ terms, the shipments grew 17% as OEMs filled channels for the Easter and Ramadan sales season, towards the end of the quarter.
Growth drivers
As manyglobal economies struggled in 2022amid macroeconomic and geopolitical pressures, Saudi Arabia was among the few to buck the trend. Bolstered by its highest oil revenues in decades as global oil prices soared, Saudi Arabia was the fastest-growing economy in 2022, with all-time-low unemployment rates, all-time-high non-oil economic activity and strong private consumption. PoS (Point of Sale) transactions, e-commerce activity and digital payments have also been on the rise in Saudi Arabia, all pointing to growing digitalization and private consumption. Some of the market momentum at the end of 2022 was carried into Q1 2023, especially after the economic boost provided by the FIFA World Cup in Qatar and the year-end and holiday season of Q4 2022.
Saudi Arabia Smartphone Shipments and 5G Share – Q1 2021 to Q1 2023
While the feature phone to smartphone migration has slowed down in Saudi Arabia, a growing digital economy and an aspirational customer have become key growth drivers. Commercial and private 5G use is also increasing in the country, pushing 5G smartphone sales. 5G technologies are a key part of Saudi Arabia’s digitalization and growth push under the Vision 2030 plan. The country has partnered with major 5G infrastructure players likeHuaweiandEricsson, and5G networksare now available in most major cities, covering around 80% of the country’s population. Saudi Arabia has also been hailed as a 5G pioneer in the region in terms of coverage, speed and consistency. 5G smartphone share remained above half of total smartphone shipments for the second consecutivequarterin Q1 2023 and is likely to grow further in 2023.
Competitive landscape
Saudi Arabia Smartphone Shipments by Top 5 OEMs for Q1 2021, Q1 2022, Q1 2023
Among OEMs, Samsung and Apple continued to take over half of the total smartphone shipments in Q1 2023, with Samsung taking the #1 spot. Xiaomi and Motorola were distant third, with HONOR rounding out the top five for Q1 2023.
三星grew YoY as its supply normalized in the region. The brand’s 5G models have been leading growth, especially the new affordable 5G M-series and A-series iterations. The Galaxy M53 was the best-selling Android device in the country in Q1. Samsung’s newest flagshipGalaxy S23series was shipped slightly earlier than theS22 series in 2022to meet the pre-order demand triggered by aggressive marketing and promotions in the country, with most channels and offline stores participating.
Apple’ssmartphone shipments nearly doubled YoY led by the popularity of itsiPhone 14 series, especially thePro versions, and as older models became affordable and available. Apple reached its highest-ever Q1 shipment share in Saudi Arabia in 2023. The brand has greatly benefitted from therise of financing options, like the ‘Buy Now, Pay Later’ model, in Saudi Arabia, making its devices accessible to a greater demographic. Besides, a rising mean wage and stable exchange rates increased the average Saudi Arabian consumer’s purchasing power in 2022. iPhones took four of the top five spots in the bestseller list for Q1 2023, with the iPhone 14 Pro coming out on top.
WhileXiaomi’sshipments grew YoY in Q1, it lost share marginally, as Motorola and HONOR gained share driven by new launches. Xiaomi has been able to maintain share largely due to its broad portfolio across price bands, innovative marketing strategies, and a strong presence across both offline and online channels.
Motorolahas been gaining share, led by its offerings in the $150-$249 price band, particularly its G series, which accounted for nearly three-quarters of its total sales in Q1. Motorola has benefitted from improved product availability, especially for new launches, and strong brand pull, especially for middle-income customers looking for upgrades to their lower-segment devices.
HONORwas among the fastest-growing brands in Q1, with its shipments more than doubling YoY. HONOR’s growth is largely due to focused expansion efforts, aggressive launch campaigns and an attractive mid-tier to high-end portfolio. HONOR has also benefitted from utilizing Huawei’s earlier distribution and channel relationships. The HONOR 70 and the X series were the top volume drivers for the OEM in Saudi Arabia for Q1 2023.
Smartphone sales grew YoY across all price bands in Q1 2023 but declined QoQ largely due to seasonality. All price bands except thepremiumband (≥$600) lost share YoY as consumers moved up the price bands. But thepremiumband was the fastest-growing band in Q1, led by Apple and Samsung. Apple captured around 85% of the total premium smartphone sales in Q1. The mid-tier ($100-$249) remained the largest price band in Saudi Arabia, capturing nearly half of the total smartphone sales in Q1, with Samsung and Xiaomi taking the top spots in the price band. Thelower (<$100) segmentgrew YoY but, like other non-premium segments, lost sales share during the same period, as customers continued to buy higher-ASP devices with improving affordability and rising aspirations.
Market outlook
We expect the ASP of smartphones sold in Saudi Arabia to continue to rise in 2023, as wage rates improve, financing options become more accessible, and customers move towards better devices. Currently, Apple and Samsung remain best equipped to capture more share of the aspirational Saudi Arabia smartphone market, but the quest for the #3 spot continues. While Xiaomi remains comfortably in the #3 spot, other Android OEMs have been mounting pressure with bolder promotions and marketing activities and aggressive launch strategies. Motorola, HONOR and Transsion Group brands Infinix and TECNO are likely candidates outside the top three to capture market growth.
Going forward, we expect the Saudi Arabia smartphone market to continue its growth momentum, with annual shipments likely to grow in low single digits in 2023. Increasing 5G use, ramping up of digitalization, greater access to financing options and growing aspirations of customers are expected to drive growth.
Note:
ASP & Priceband Analysis done using Wholesale Prices
Counterpoint attending theMWC Shanghaifrom June 28 – June 30
Our analysts will be attending MWC Shanghai Event, 2023. You can schedule a meeting with them to discuss the latest trends in the technology, media and telecommunications sector and understand how our leadingresearchandservicescan help your business.
Here is the list of team members attending the event:
When:June 28 – June 30 | 9:00 Am – 5:00 PM Where:Shanghai New International Expo Centre (SNIEC) | Kerry Hotel Pudong, Shanghai
Click here(or send us an email at contact@www.arena-ruc.com) to schedule a meeting with them.
About the event:
MWC Shanghai is the largest and most influential gathering of the connectivity ecosystem in Asia. It’s where world-leading companies and trailblazers share the latest thought leadership about the progression and future of connectivity. With China’s borders reopened, our in-person show return this June to Shanghai New International Expo Center!
At MWC Shanghai, we host the debates that will define society’s relationship with technology, cutting edge technology demos that will redraw the boundaries of possibility. We dedicate a hall to our 5GIn event where we introduce investors to startups to fuel innovation and grow ideas that will change the world.As the world is recovering at an unprecedented speed, the entire mobile ecosystem must seize this moment to be a force for change. Join us at the centre of it all – MWC Shanghai, where innovators, creators and leaders gather to get business done.
In order to access Counterpoint Technology Market Research Limited (Company or We hereafter) Web sites, you may be asked to complete a registration form. You are required to provide contact information which is used to enhance the user experience and determine whether you are a paid subscriber or not. Personal Information When you register on we ask you for personal information. We use this information to provide you with the best advice and highest-quality service as well as with offers that we think are relevant to you. We may also contact you regarding a Web site problem or other customer service-related issues. We do not sell, share or rent personal information about you collected on Company Web sites.
How to unsubscribe and Termination
You may request to terminate your account or unsubscribe to any email subscriptions or mailing lists at any time. In accessing and using this Website, User agrees to comply with all applicable laws and agrees not to take any action that would compromise the security or viability of this Website. The Company may terminate User’s access to this Website at any time for any reason. The terms hereunder regarding Accuracy of Information and Third Party Rights shall survive termination.
Website Content and Copyright
这s Website is the property of Counterpoint and is protected by international copyright law and conventions. We grant users the right to access and use the Website, so long as such use is for internal information purposes, and User does not alter, copy, disseminate, redistribute or republish any content or feature of this Website. User acknowledges that access to and use of this Website is subject to these TERMS OF USE and any expanded access or use must be approved in writing by the Company. – Passwords are for user’s individual use – Passwords may not be shared with others – Users may not store documents in shared folders. ——用户不得向非分配文件-users unless otherwise stated in their contract terms.
Changes or Updates to the Website
公司有权改变、更新or discontinue any aspect of this Website at any time without notice. Your continued use of the Website after any such change constitutes your agreement to these TERMS OF USE, as modified. Accuracy of Information: While the information contained on this Website has been obtained from sources believed to be reliable, We disclaims all warranties as to the accuracy, completeness or adequacy of such information. User assumes sole responsibility for the use it makes of this Website to achieve his/her intended results.
这rd Party Links: This Website may contain links to other third party websites, which are provided as additional resources for the convenience of Users. We do not endorse, sponsor or accept any responsibility for these third party websites, User agrees to direct any concerns relating to these third party websites to the relevant website administrator.
Cookies and Tracking
We may monitor how you use our Web sites. It is used solely for purposes of enabling us to provide you with a personalized Web site experience. 这s data may also be used in the aggregate, to identify appropriate product offerings and subscription plans. Cookies may be set in order to identify you and determine your access privileges. Cookies are simply identifiers. You have the ability to delete cookie files from your hard disk drive.
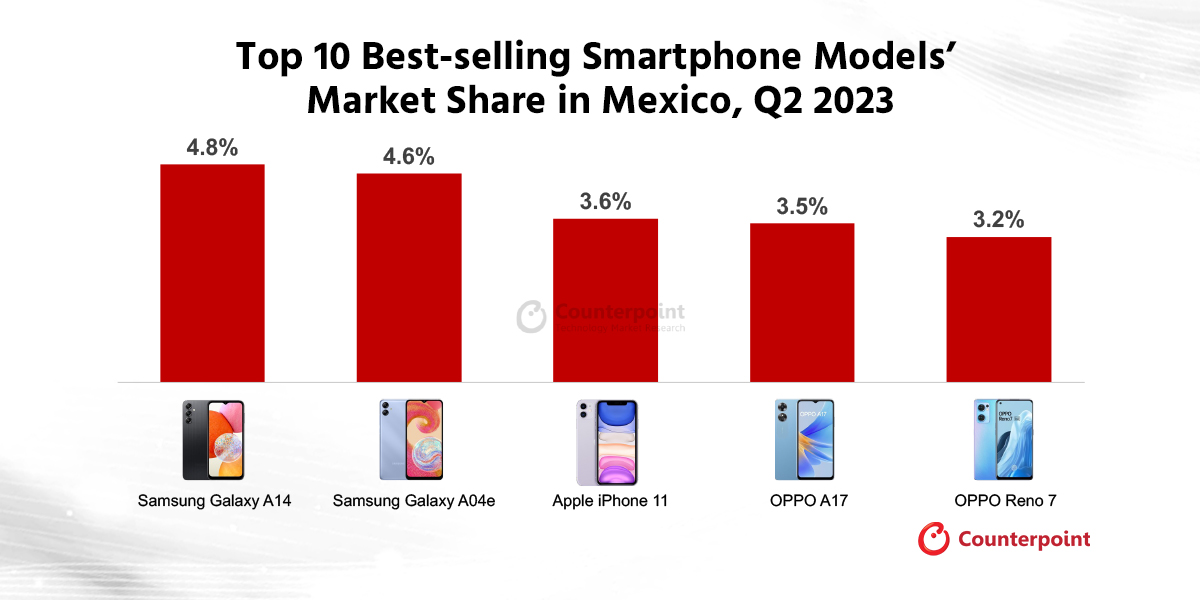
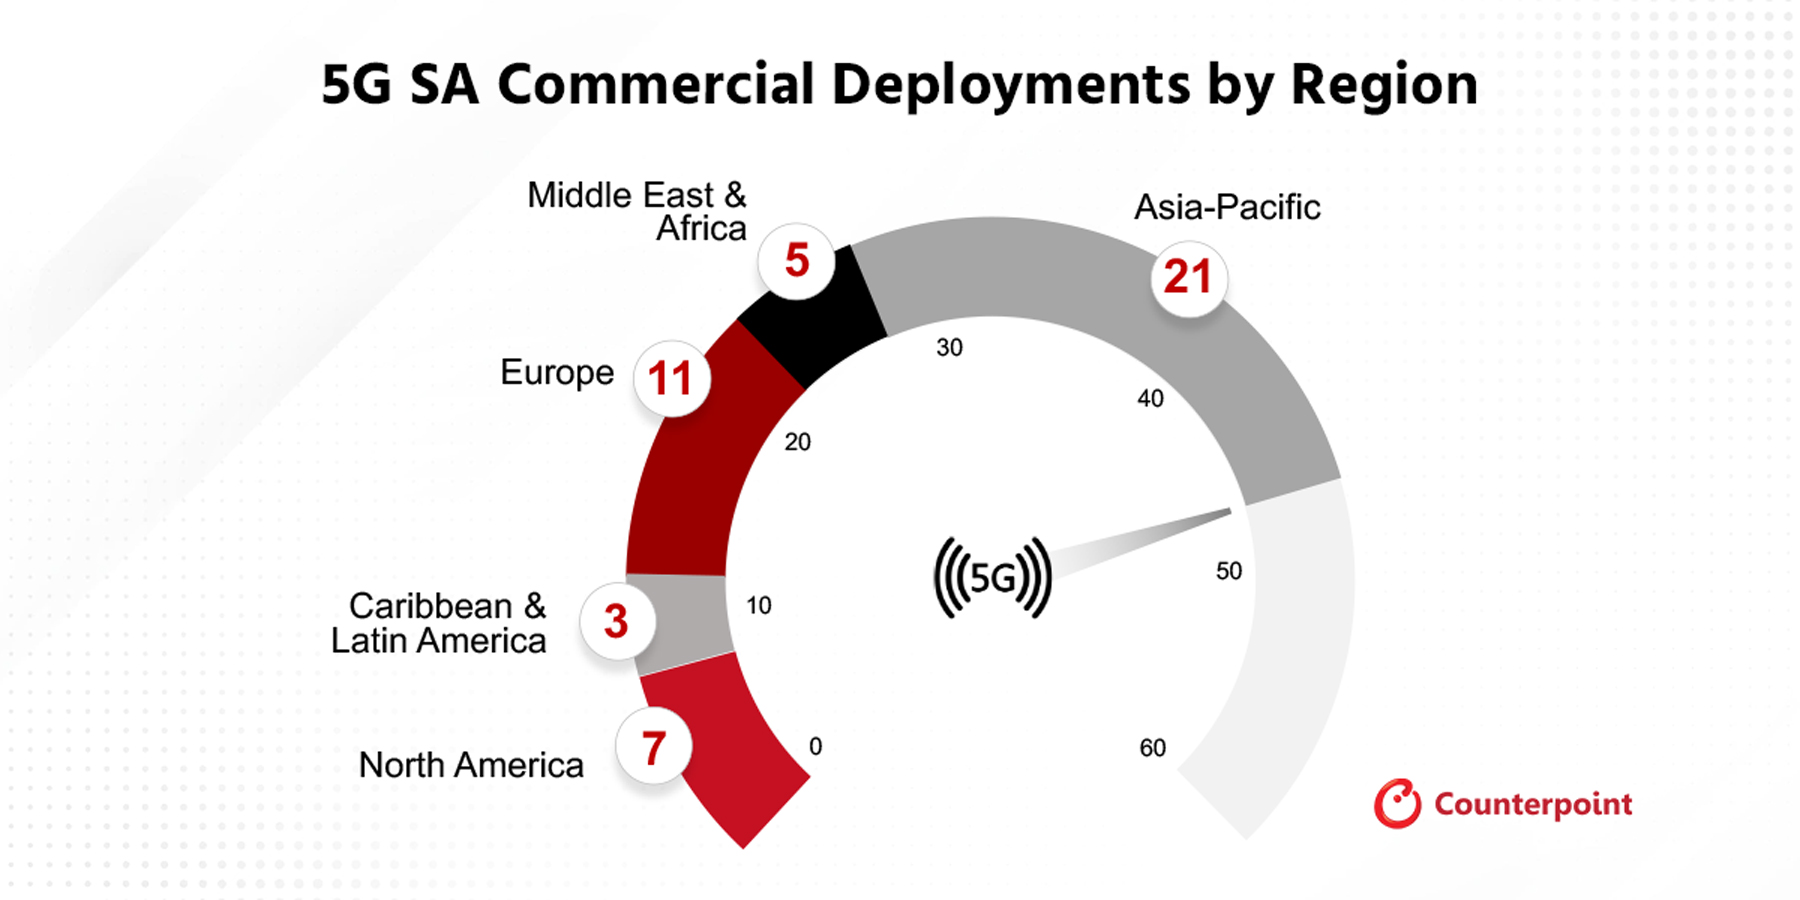


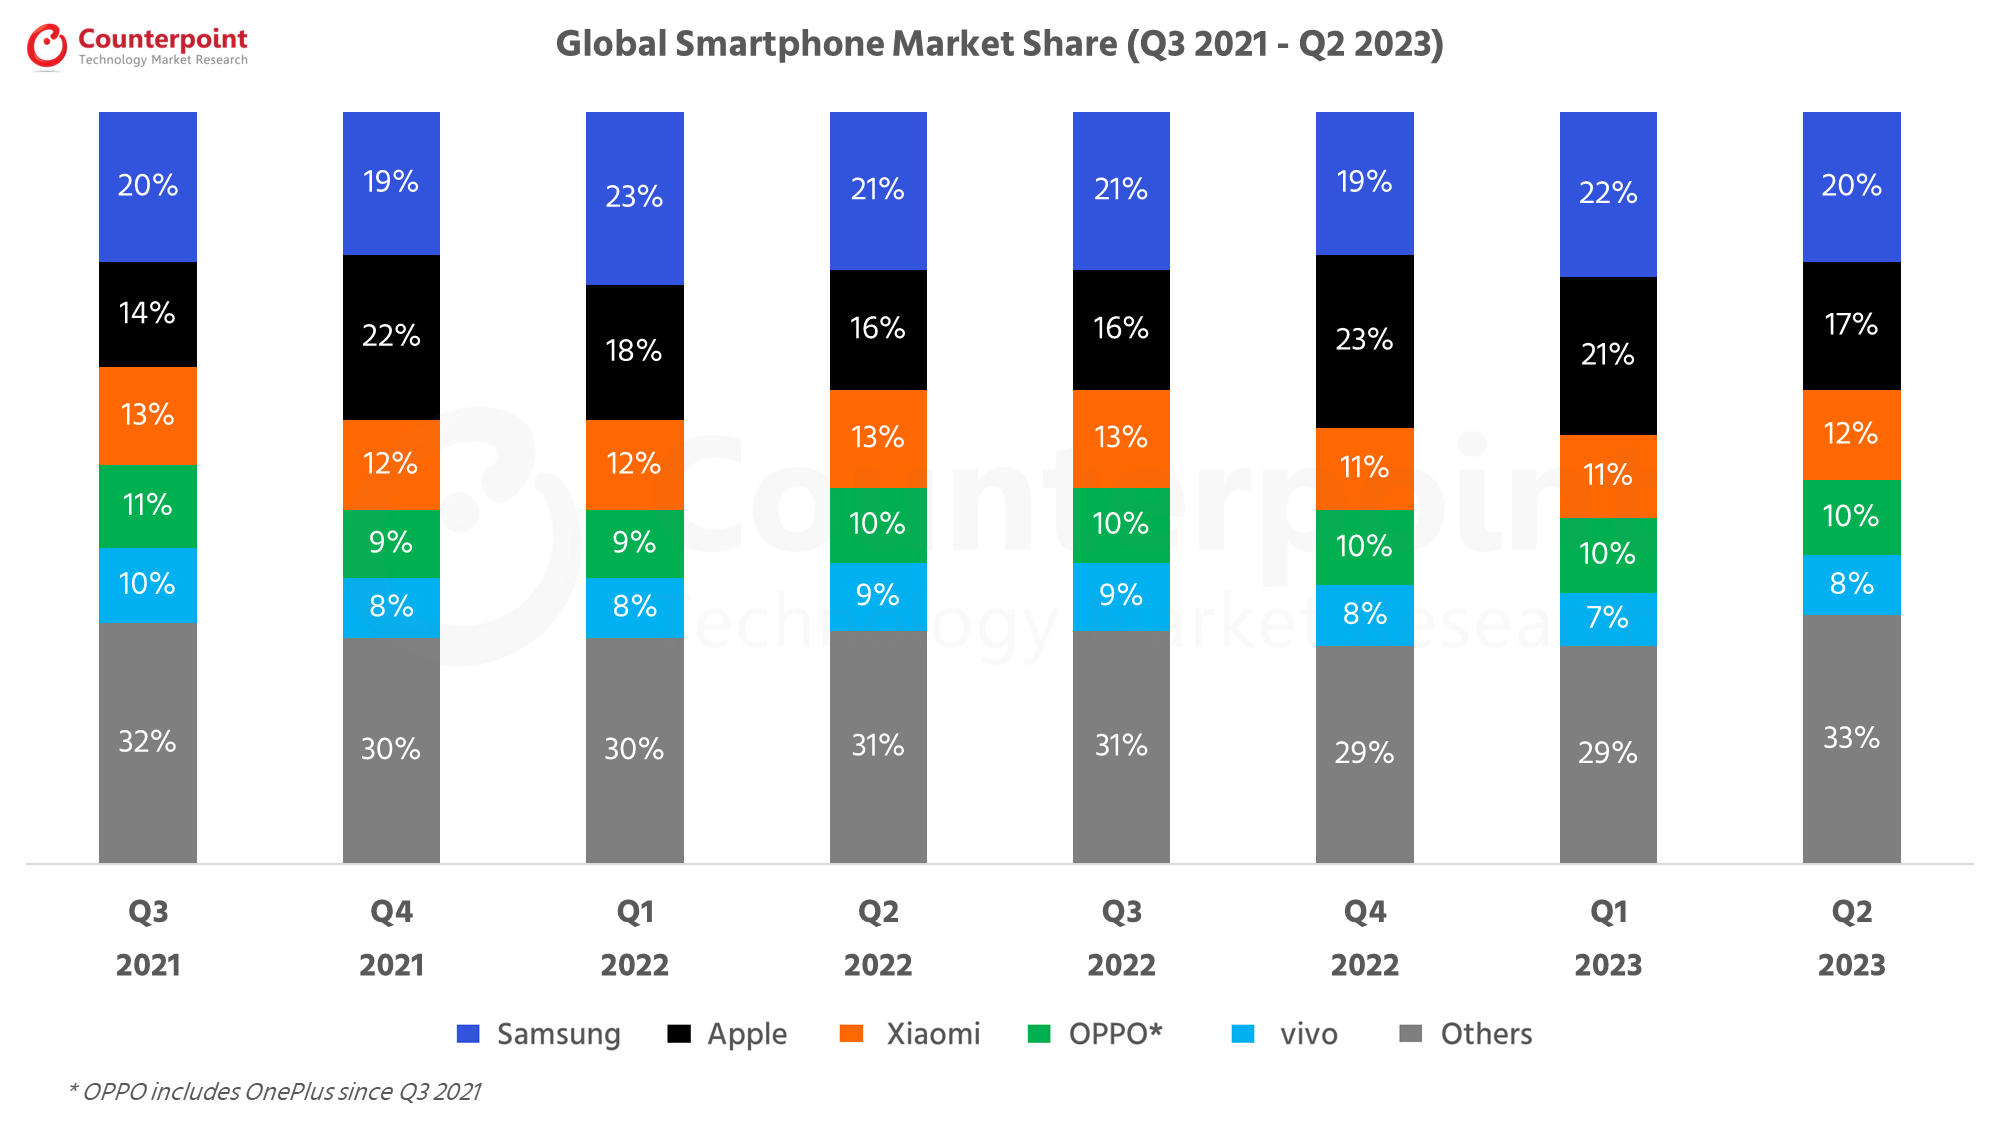 Source:


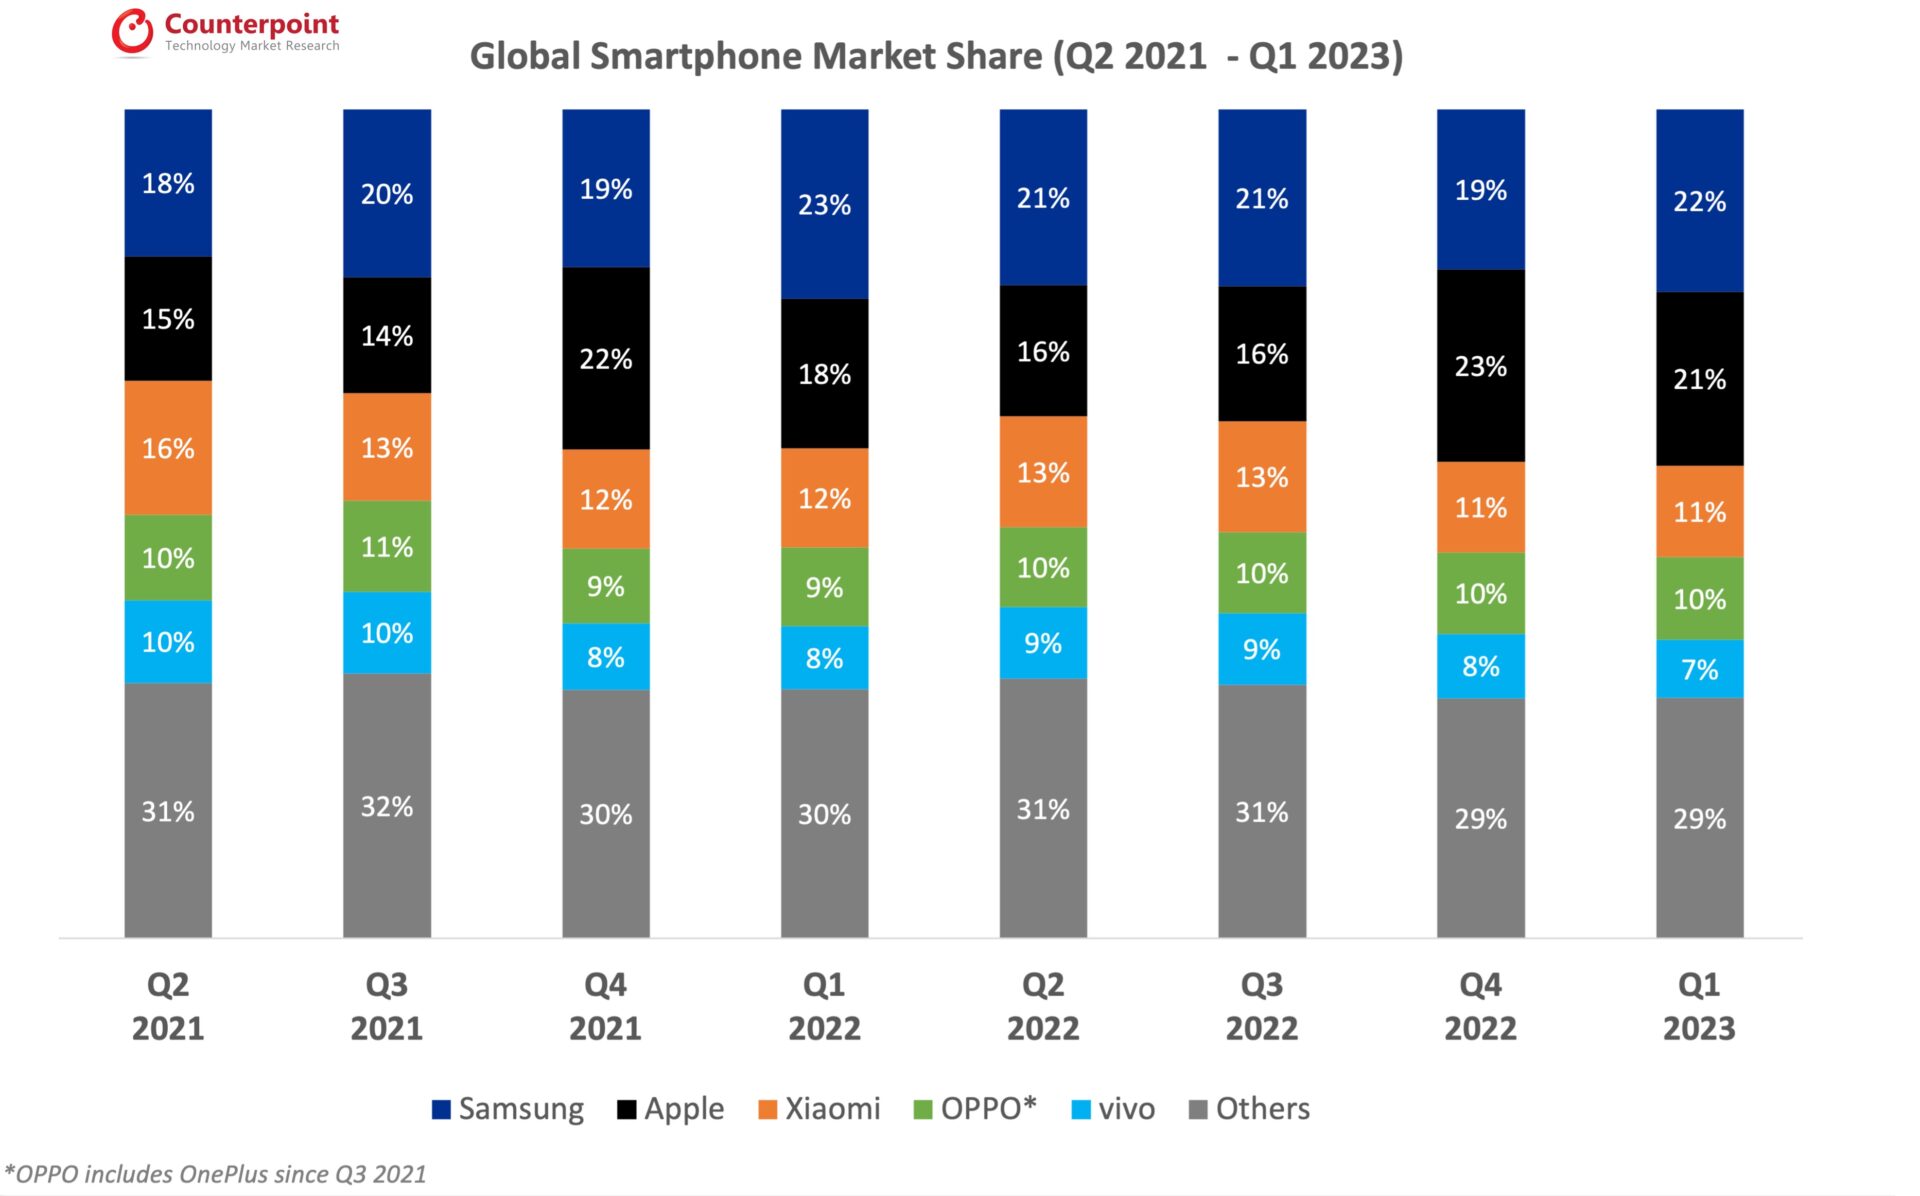
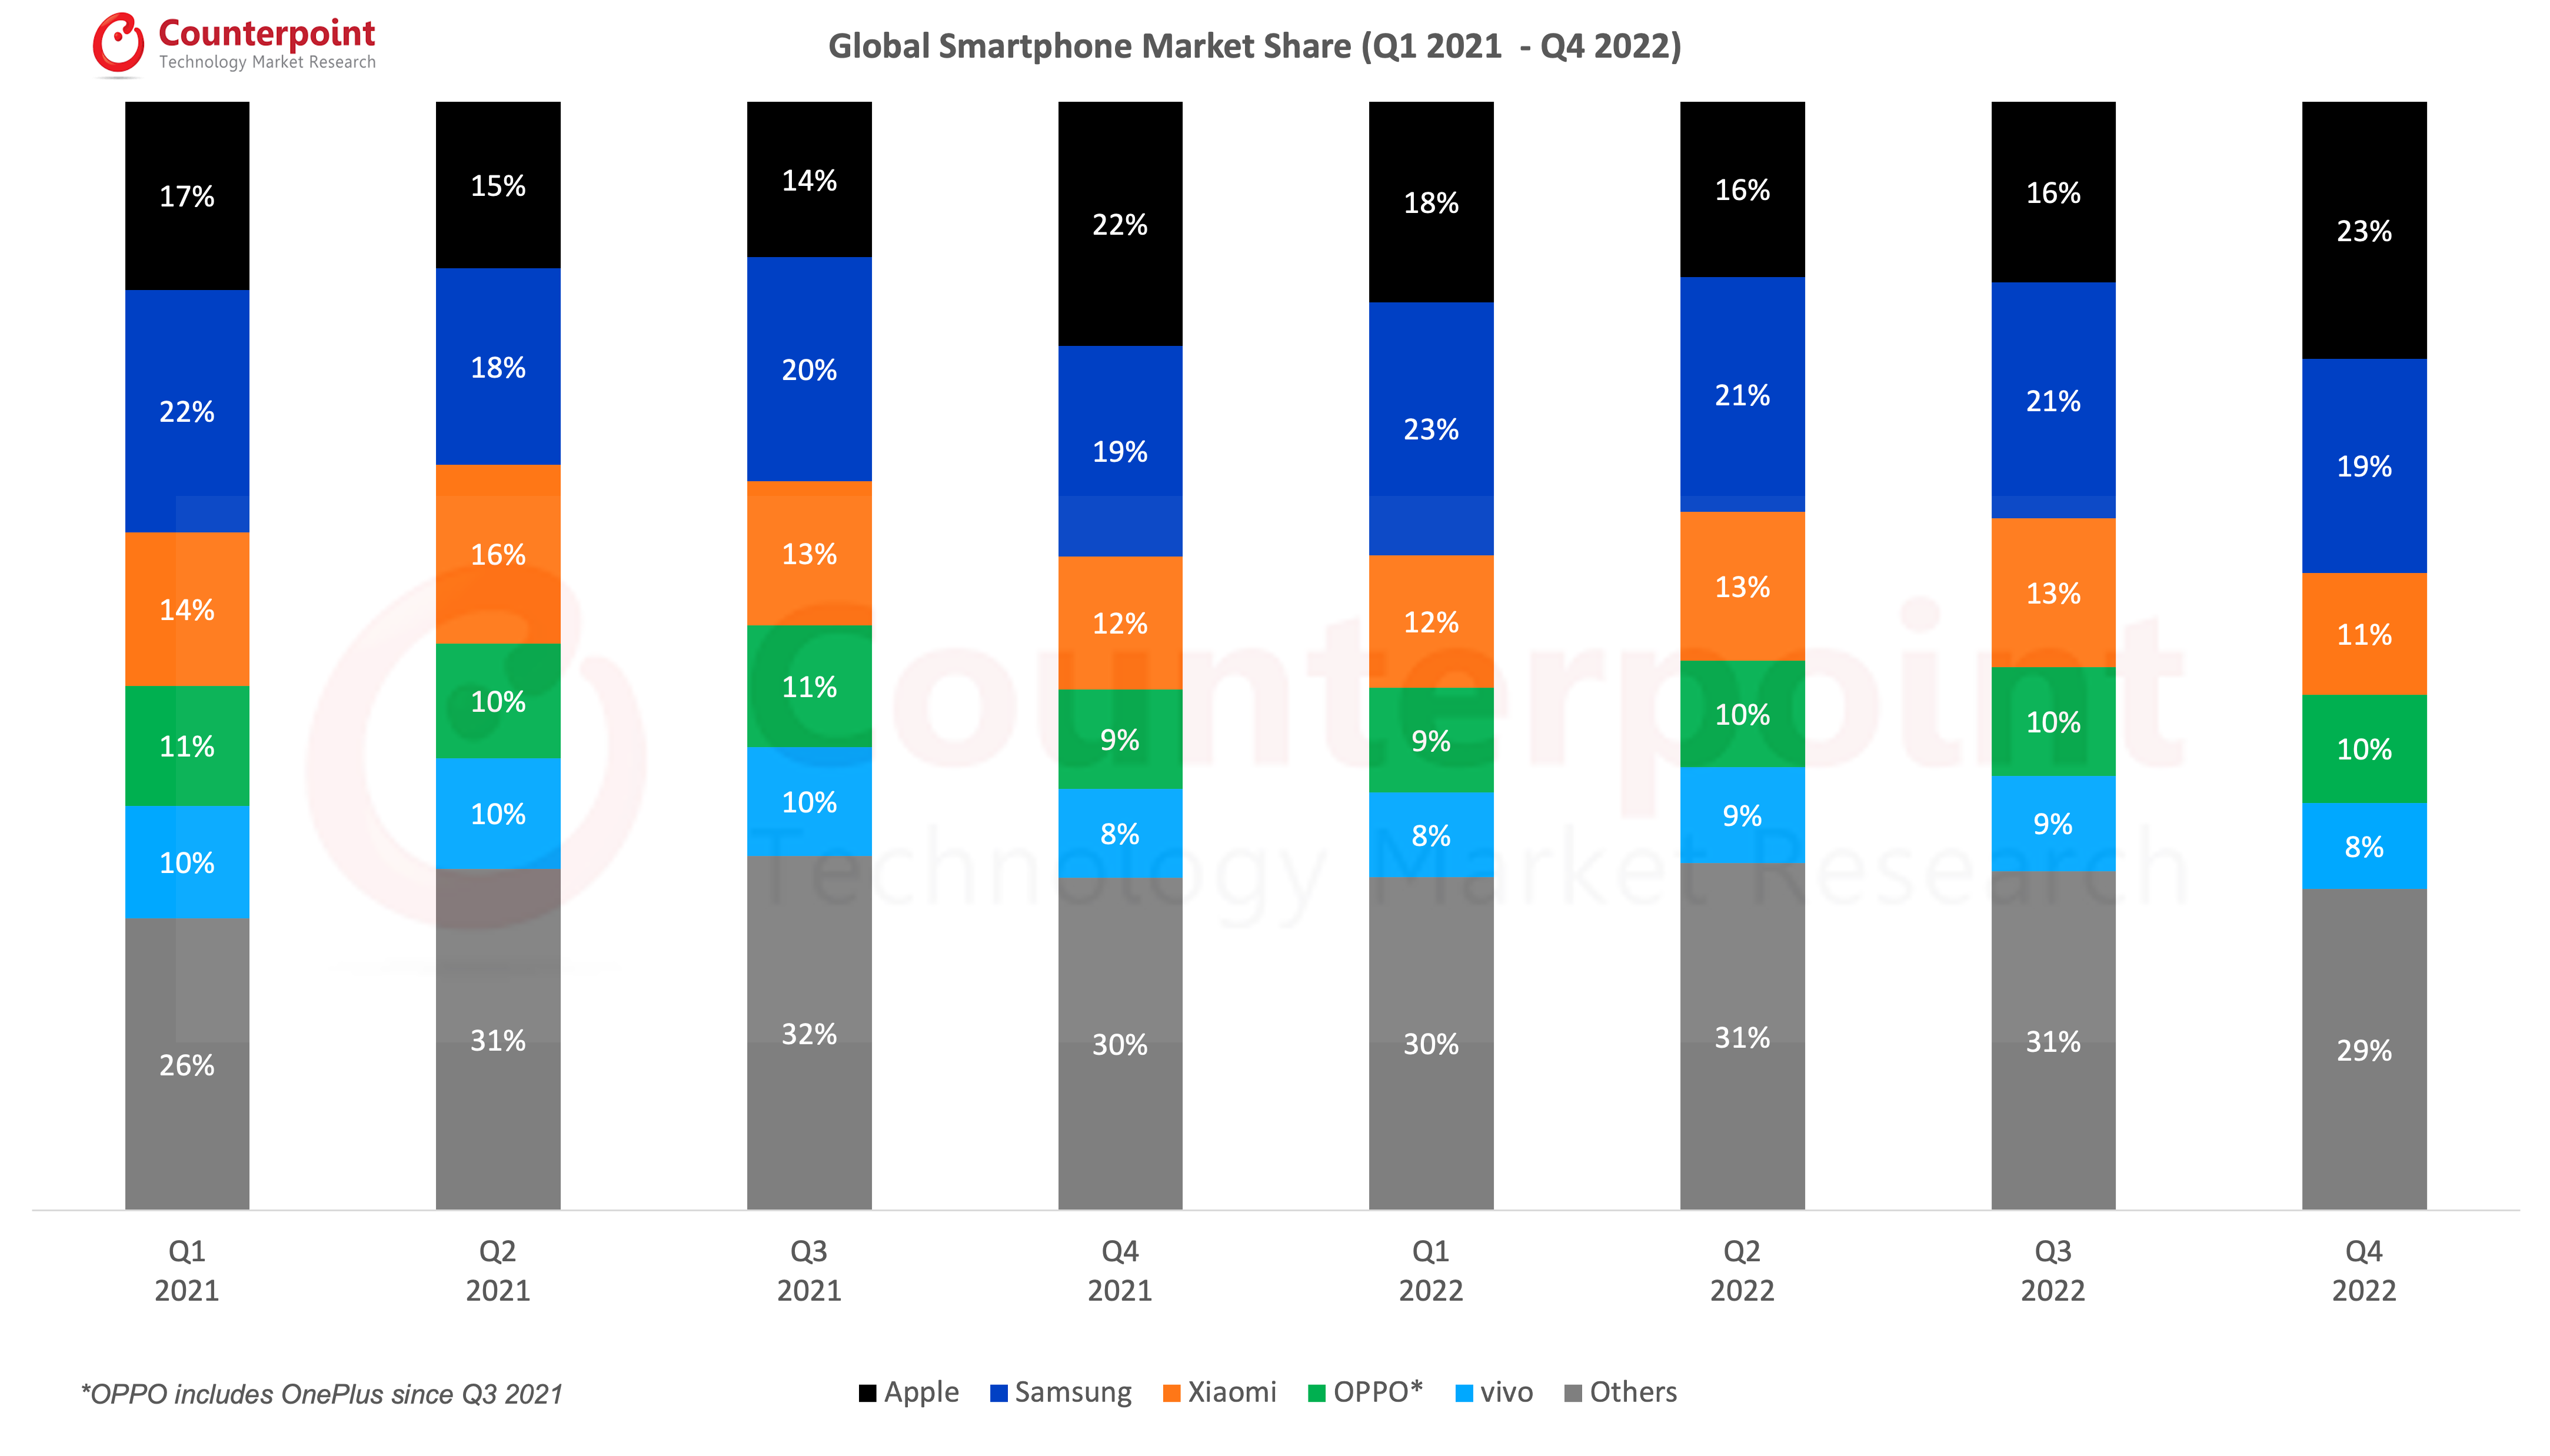
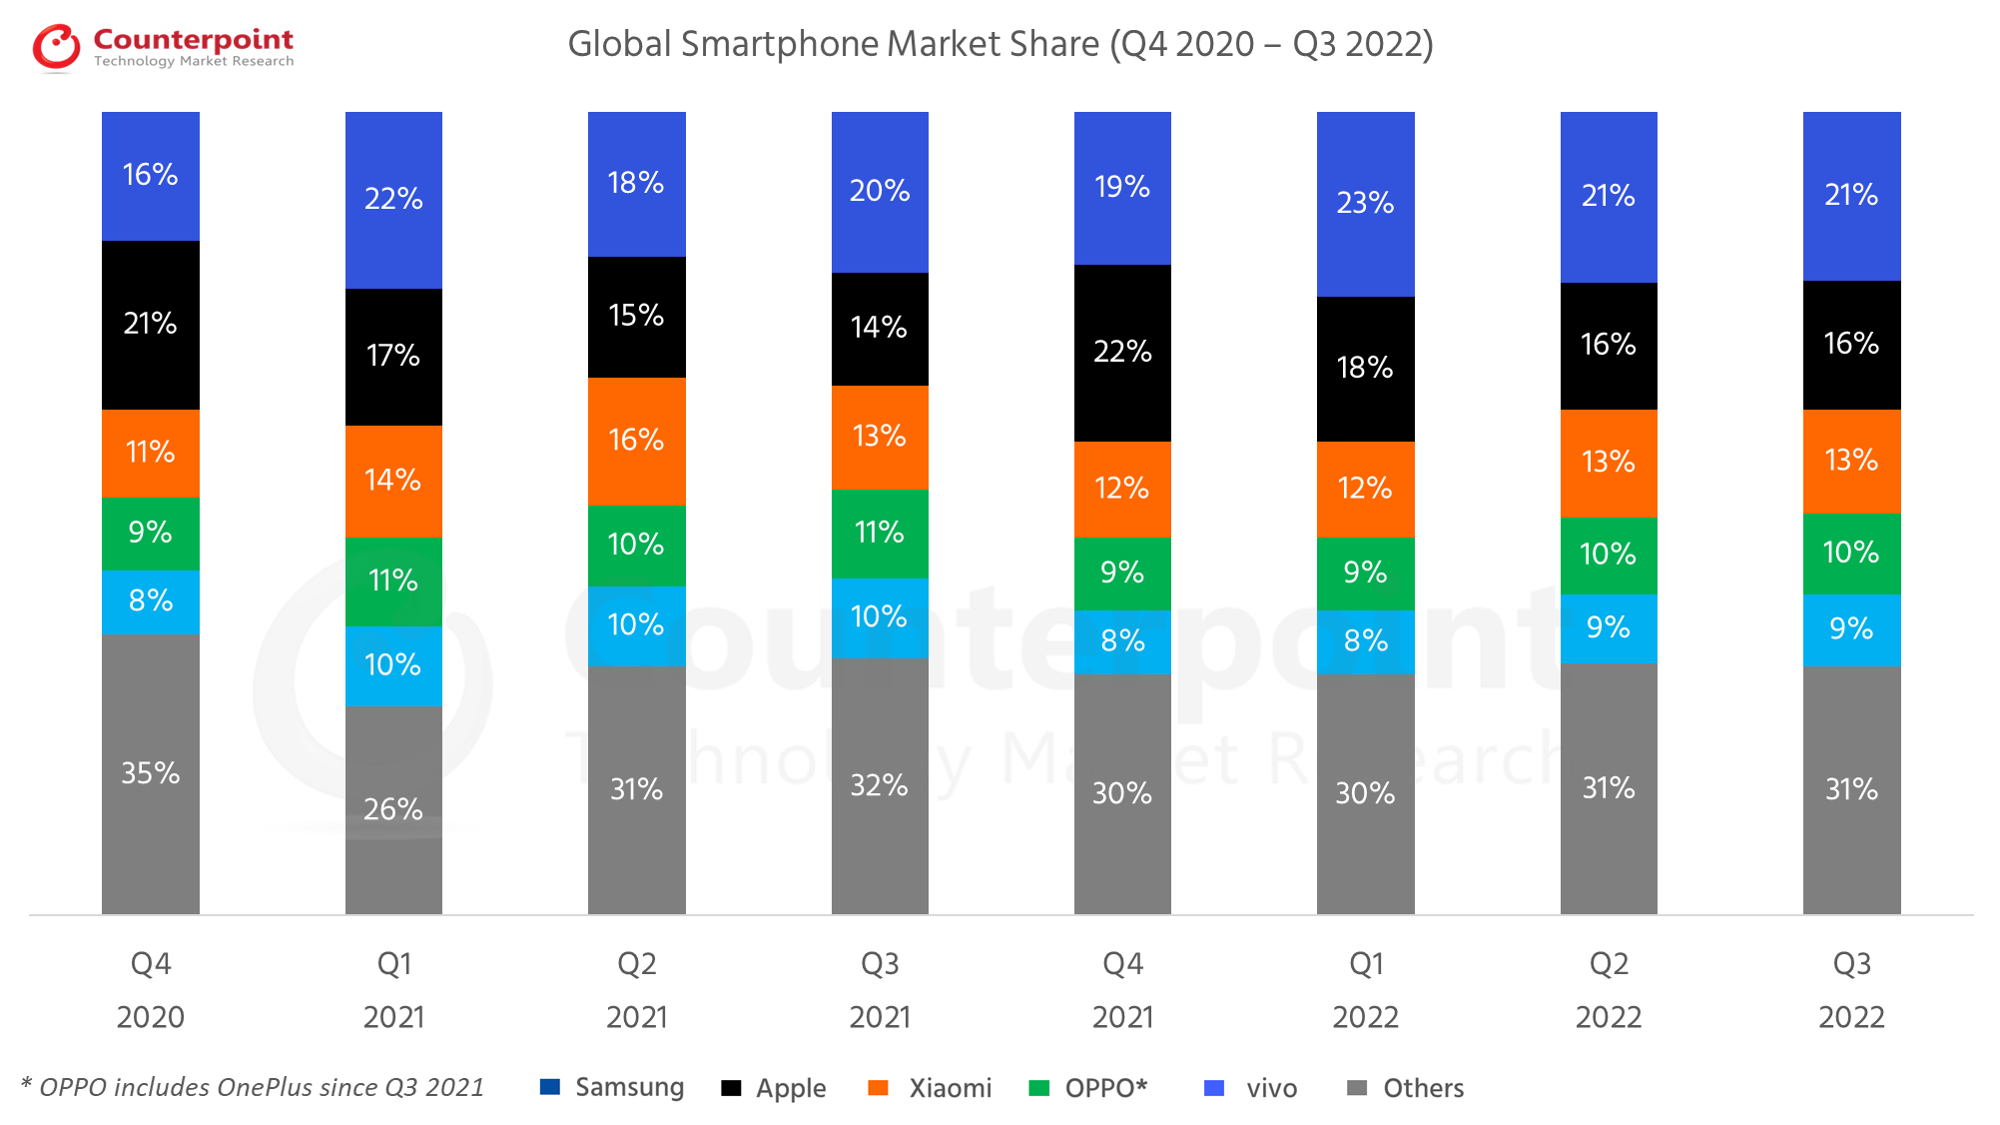
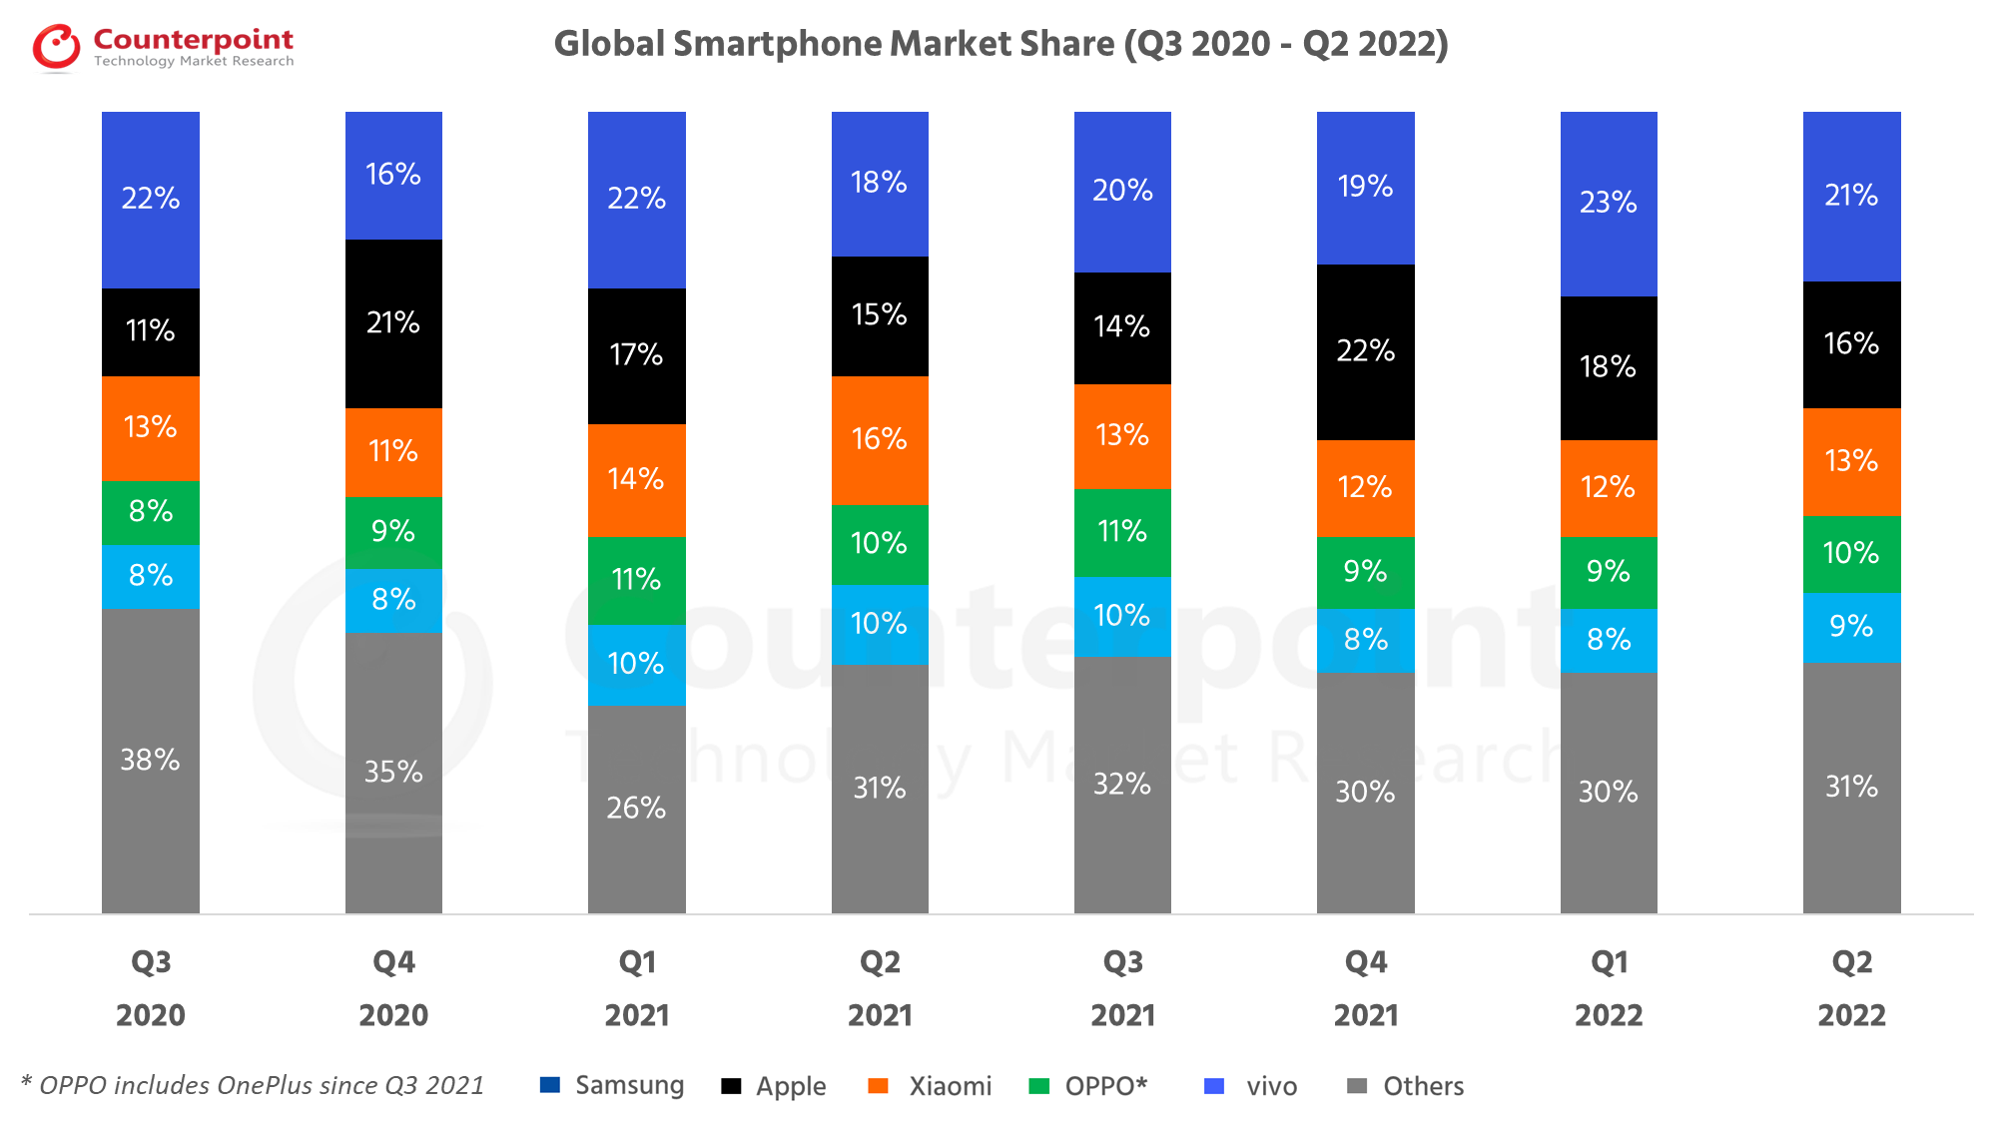
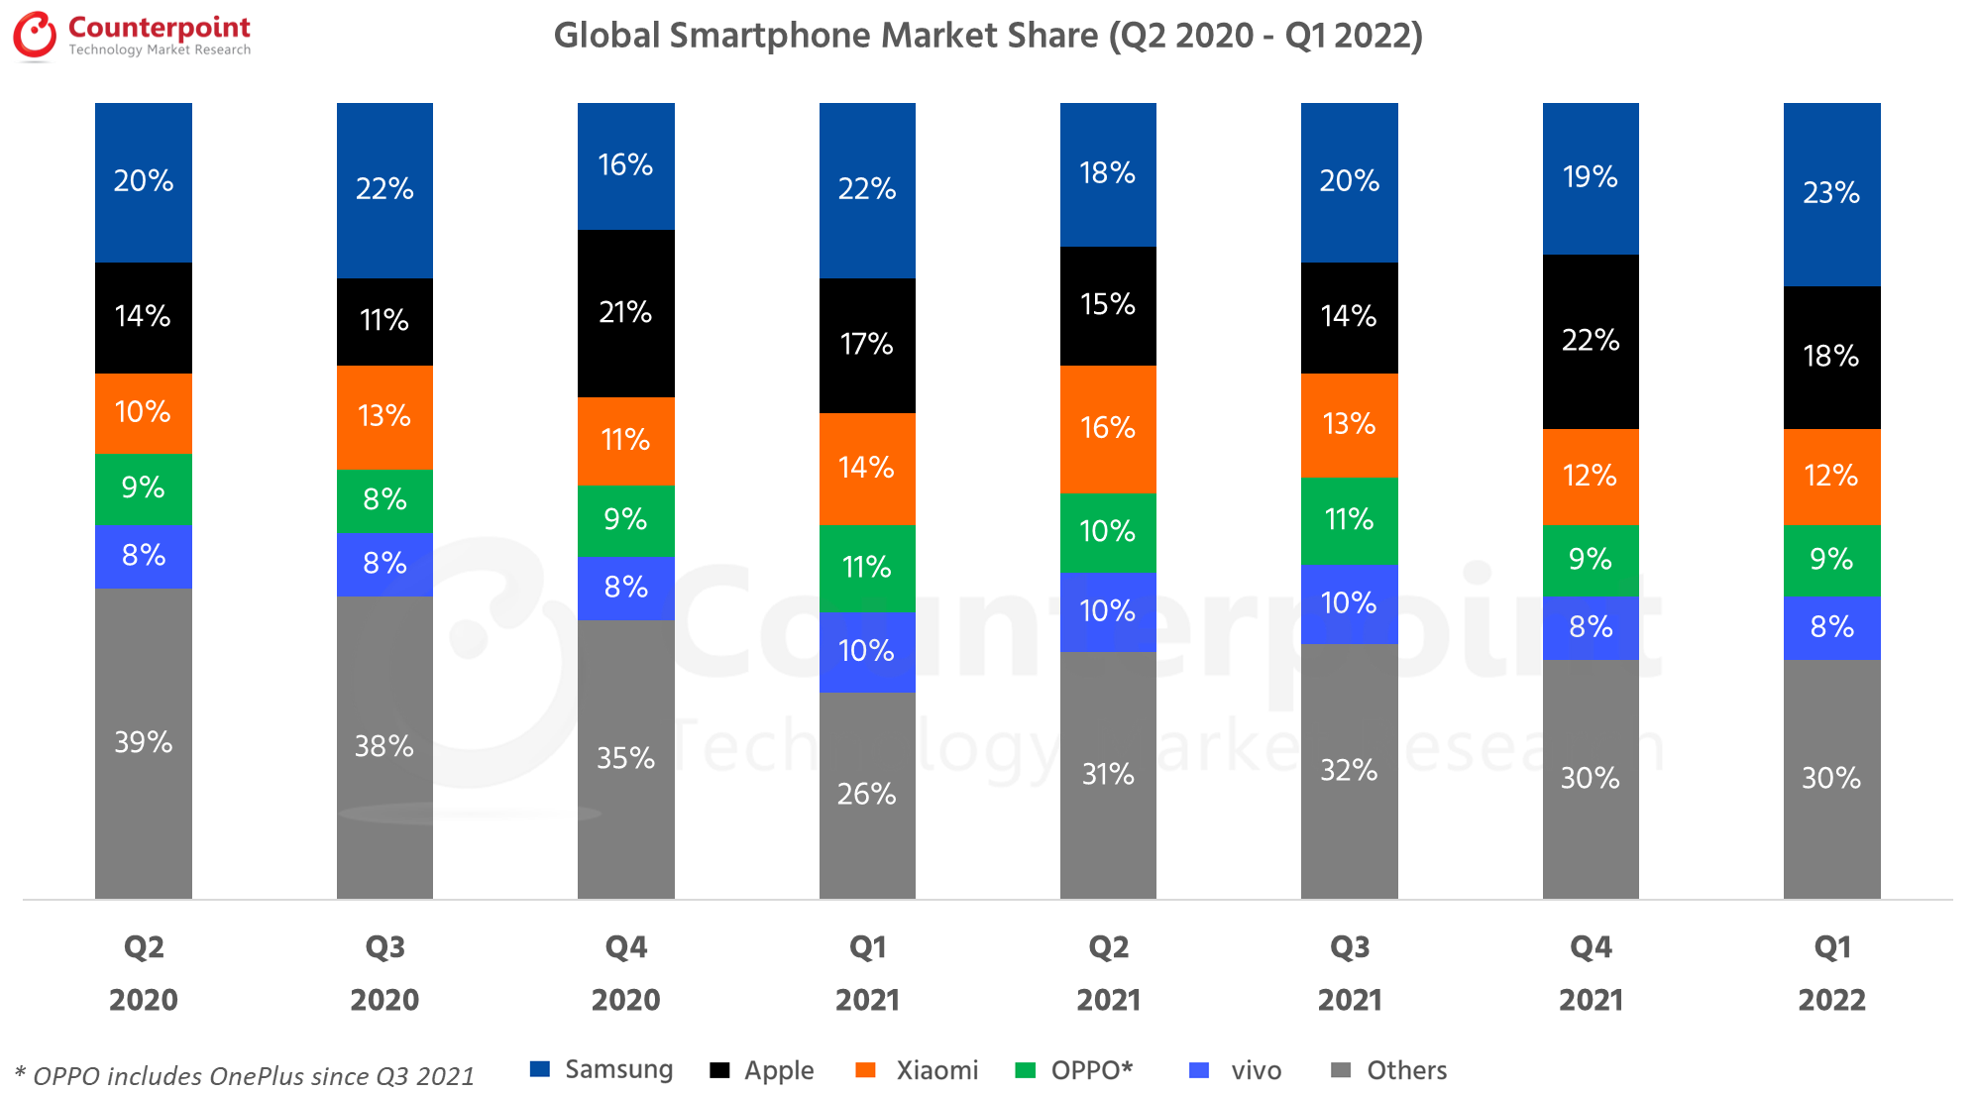
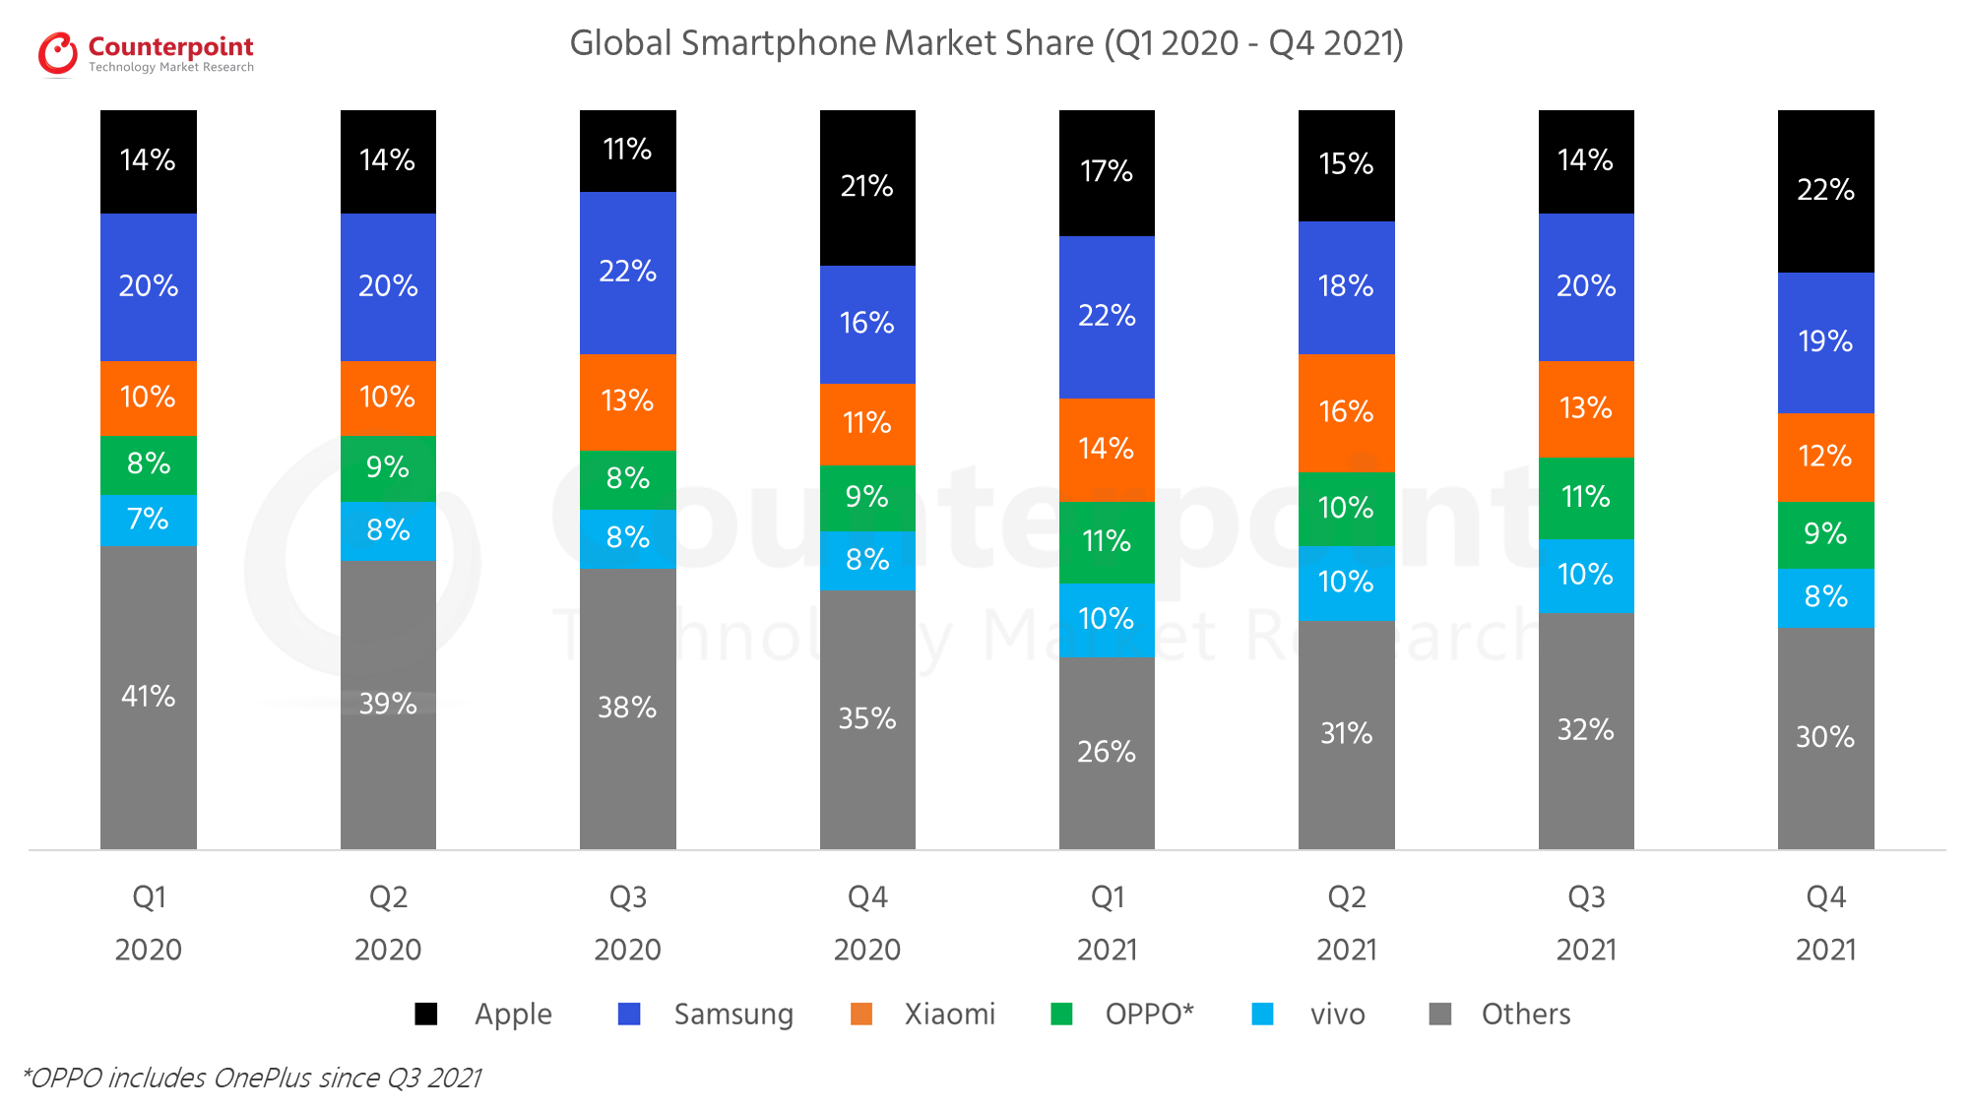
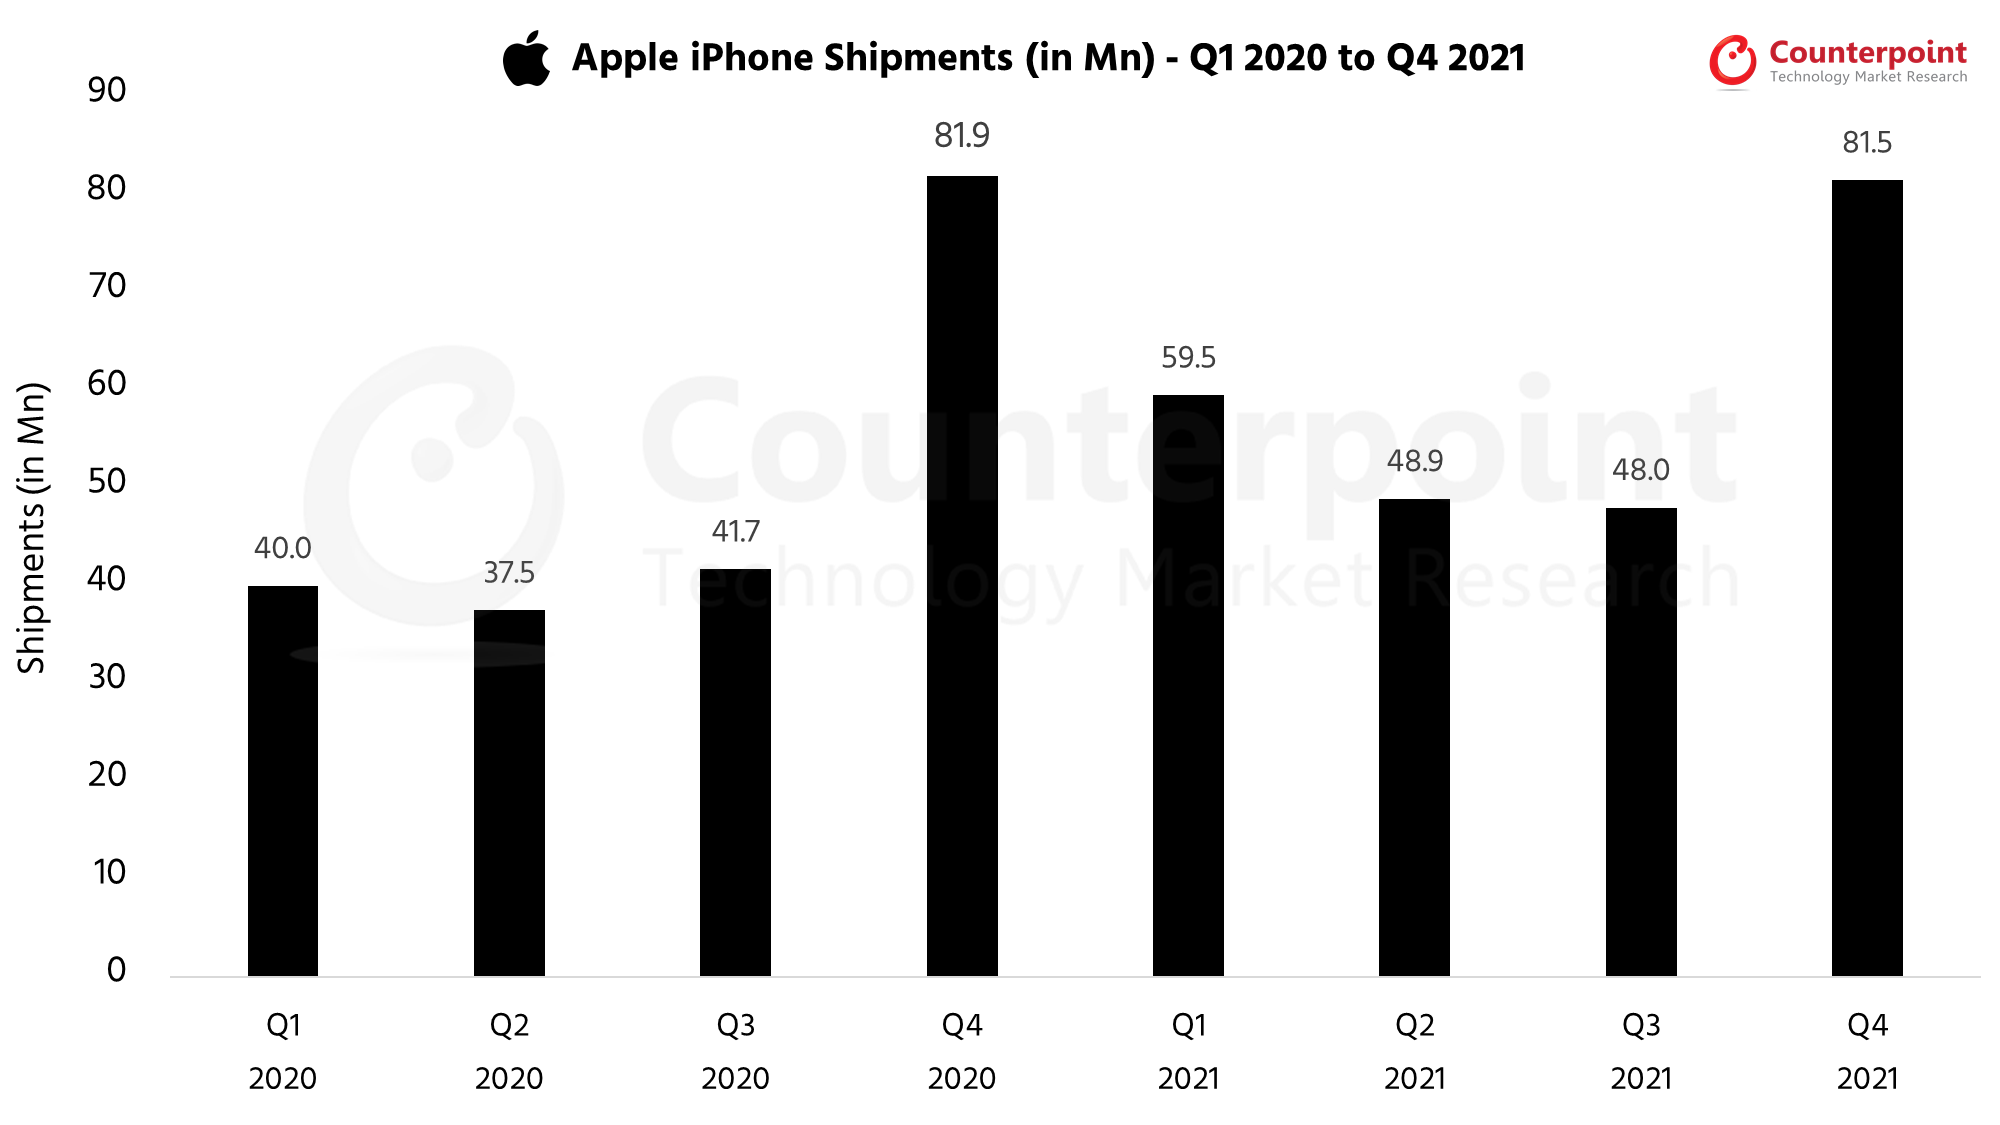
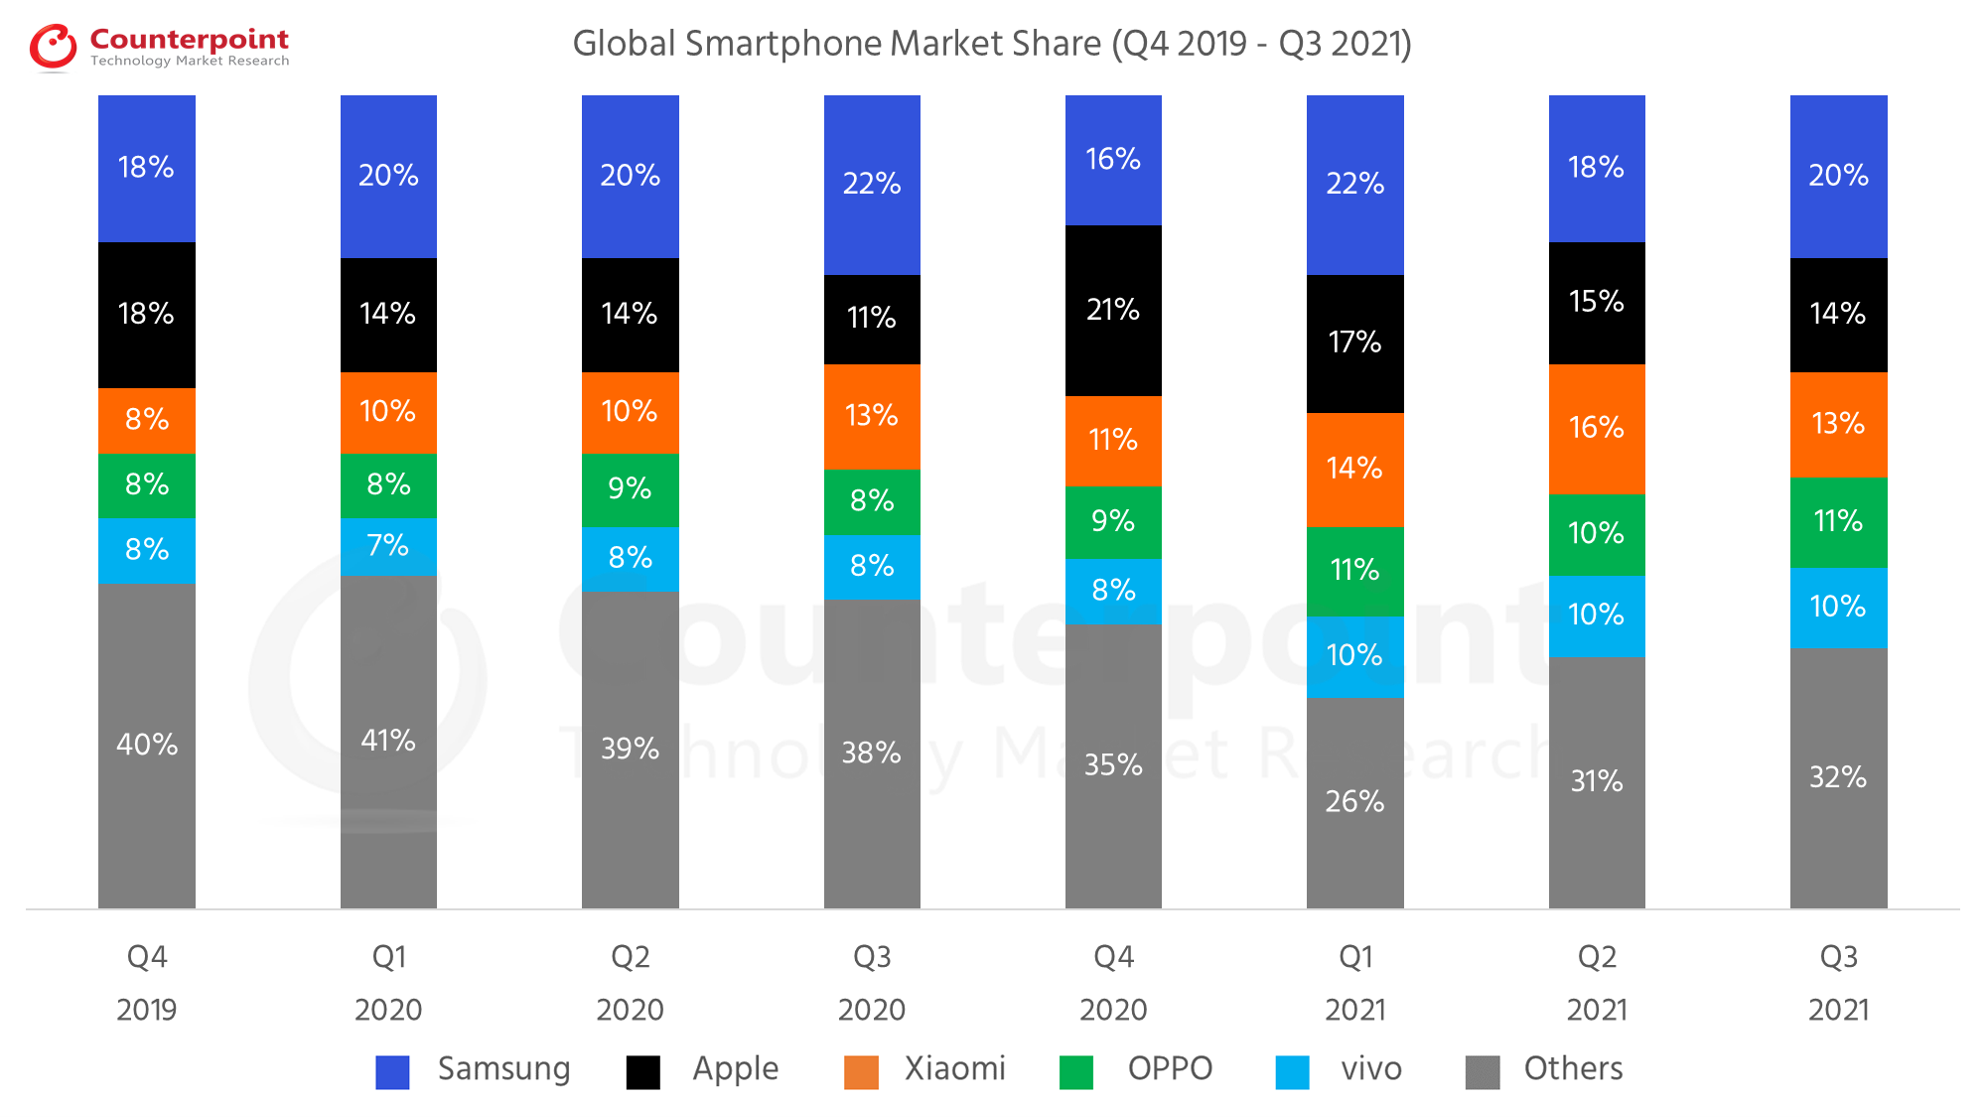
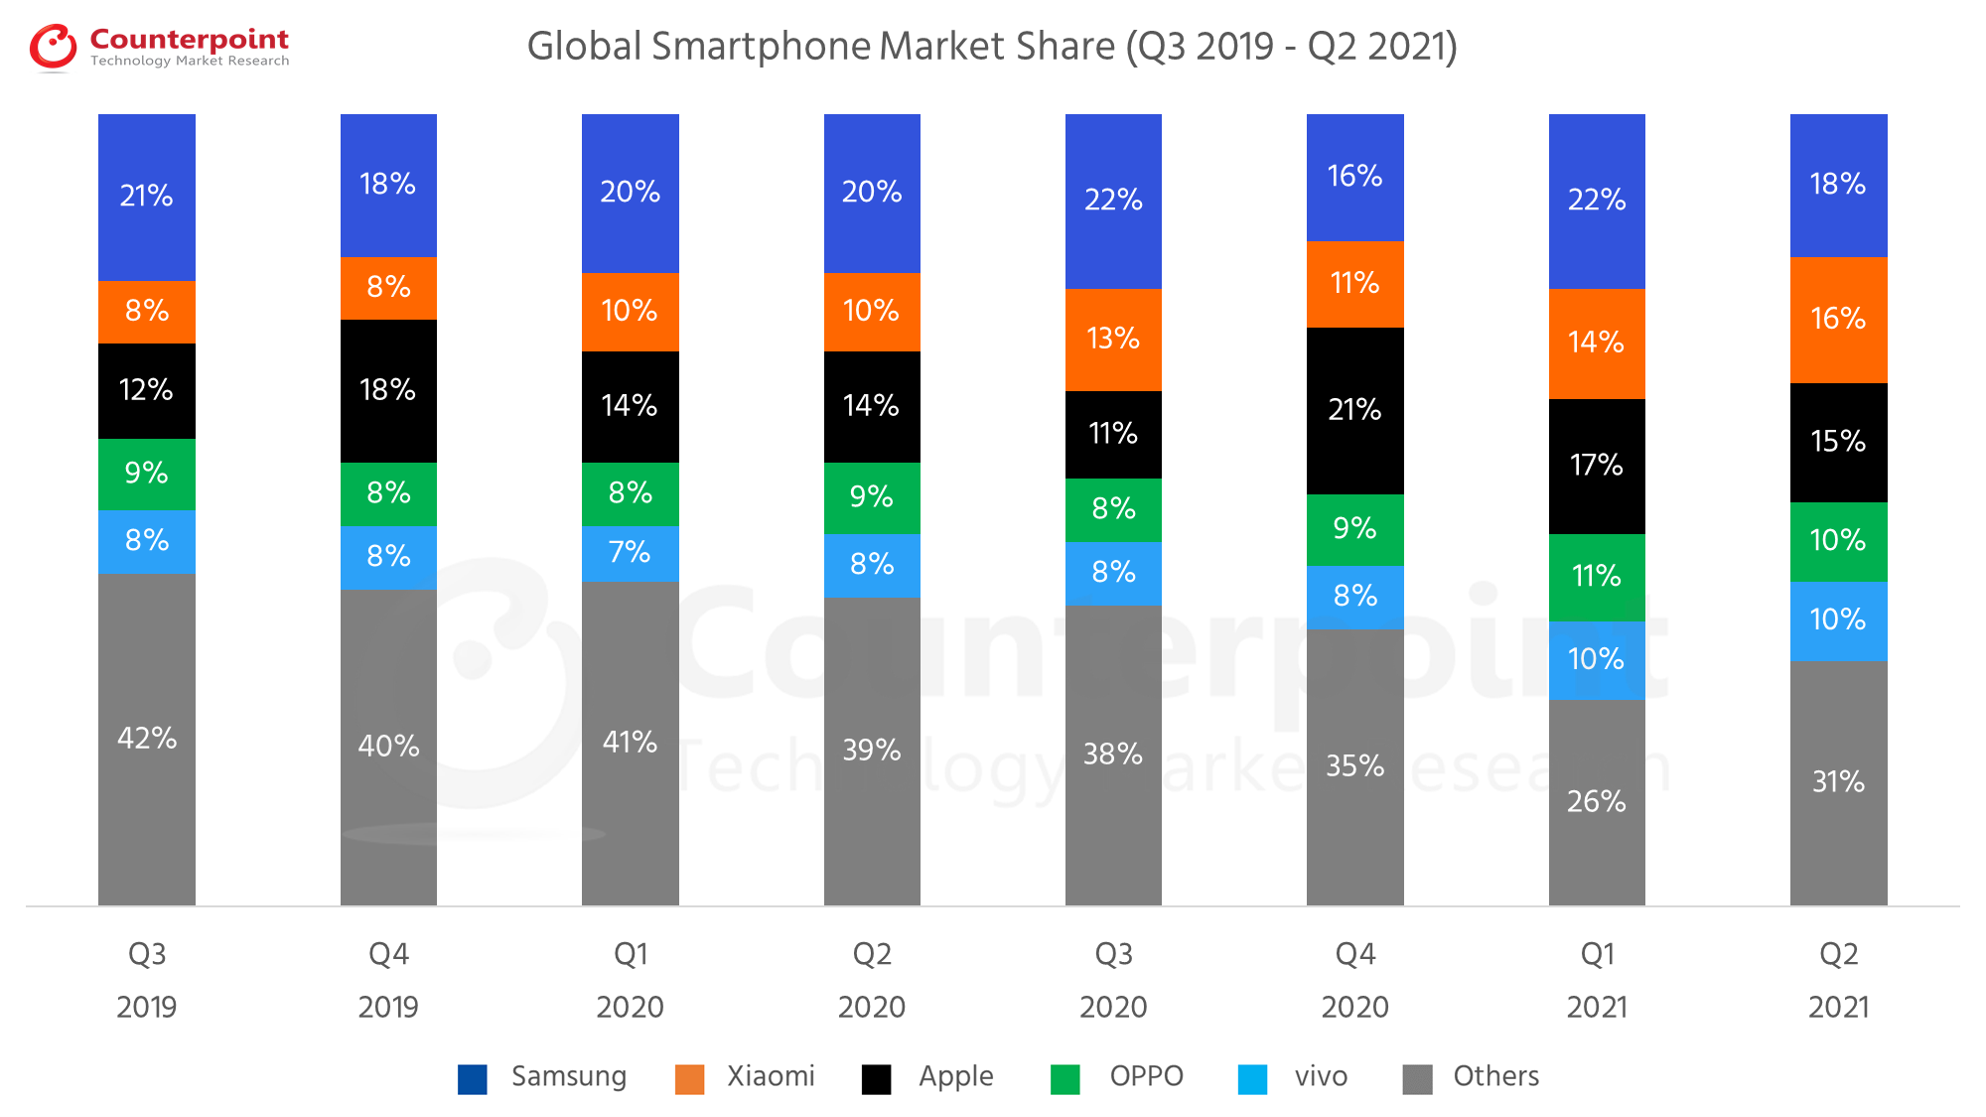
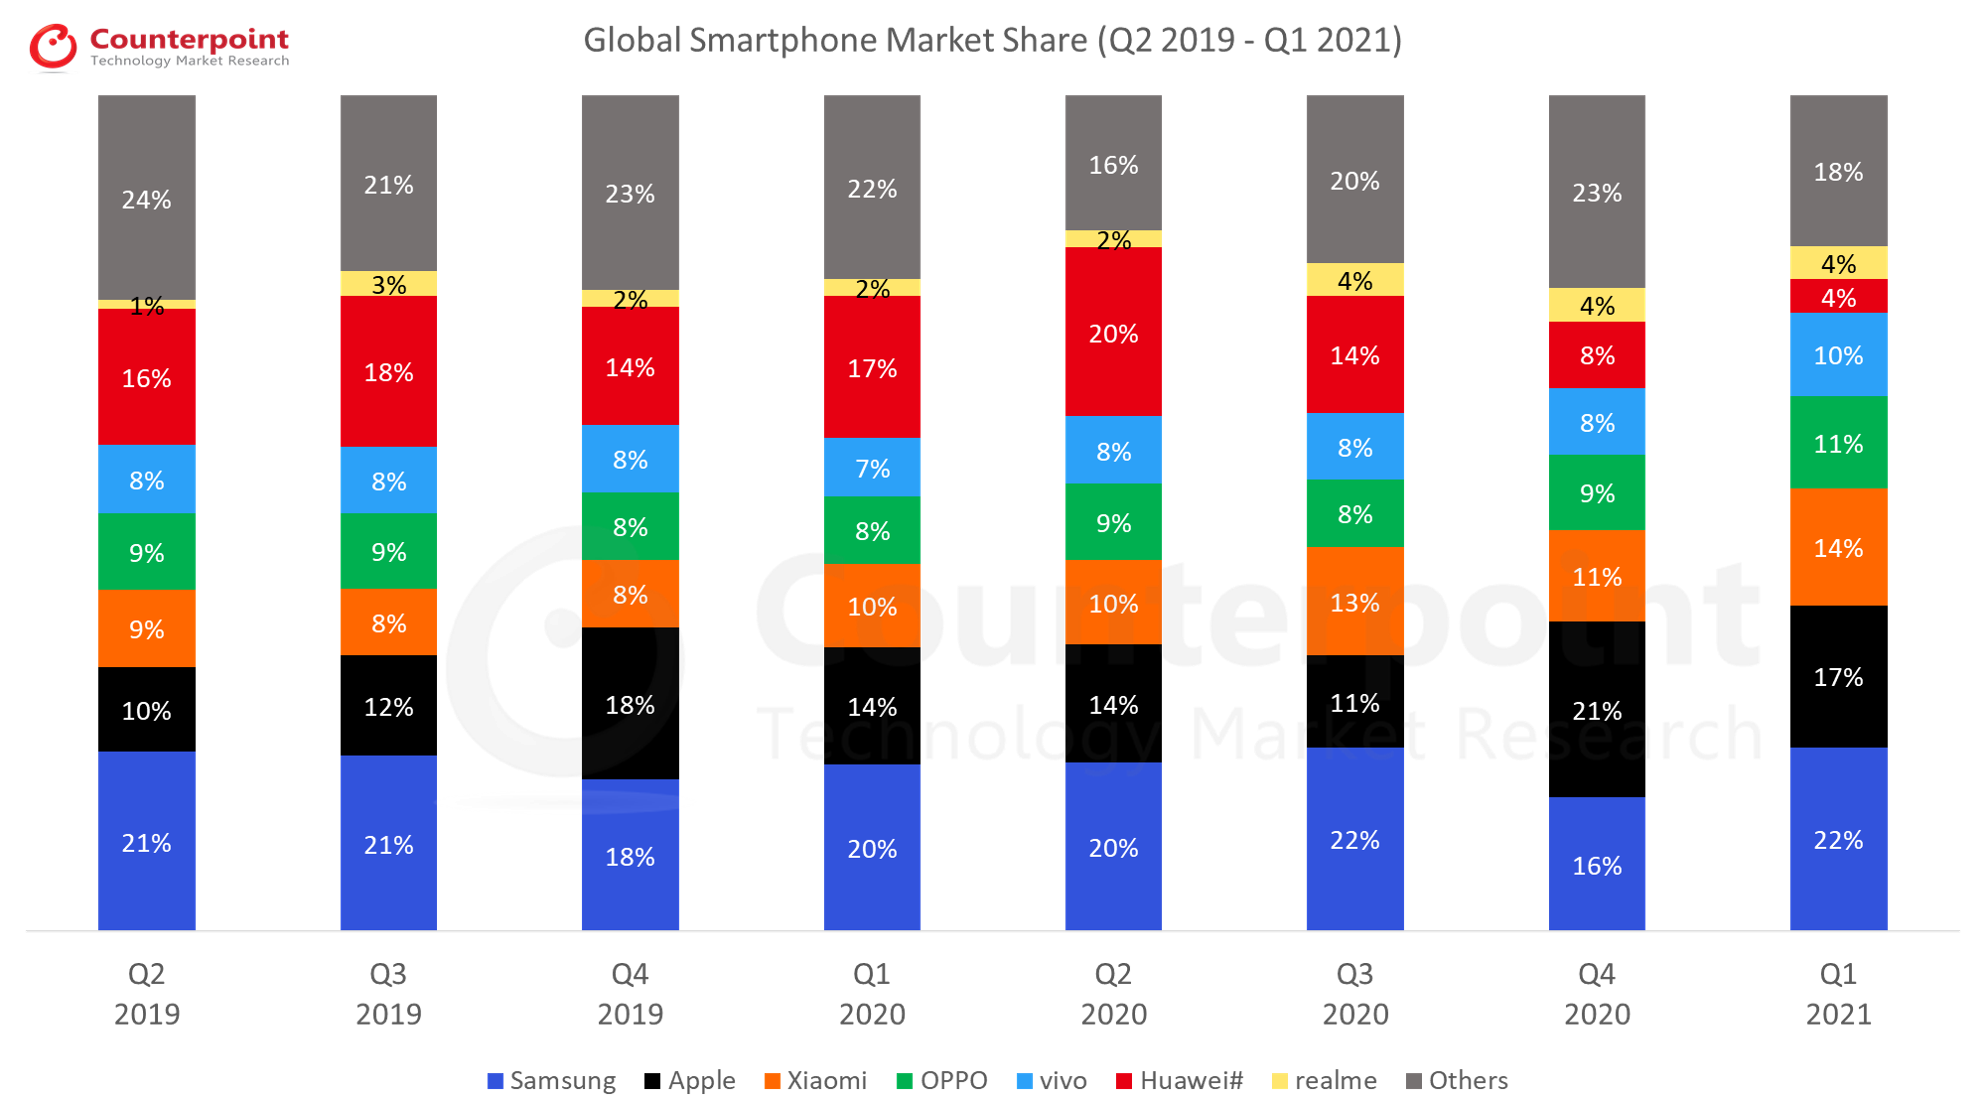
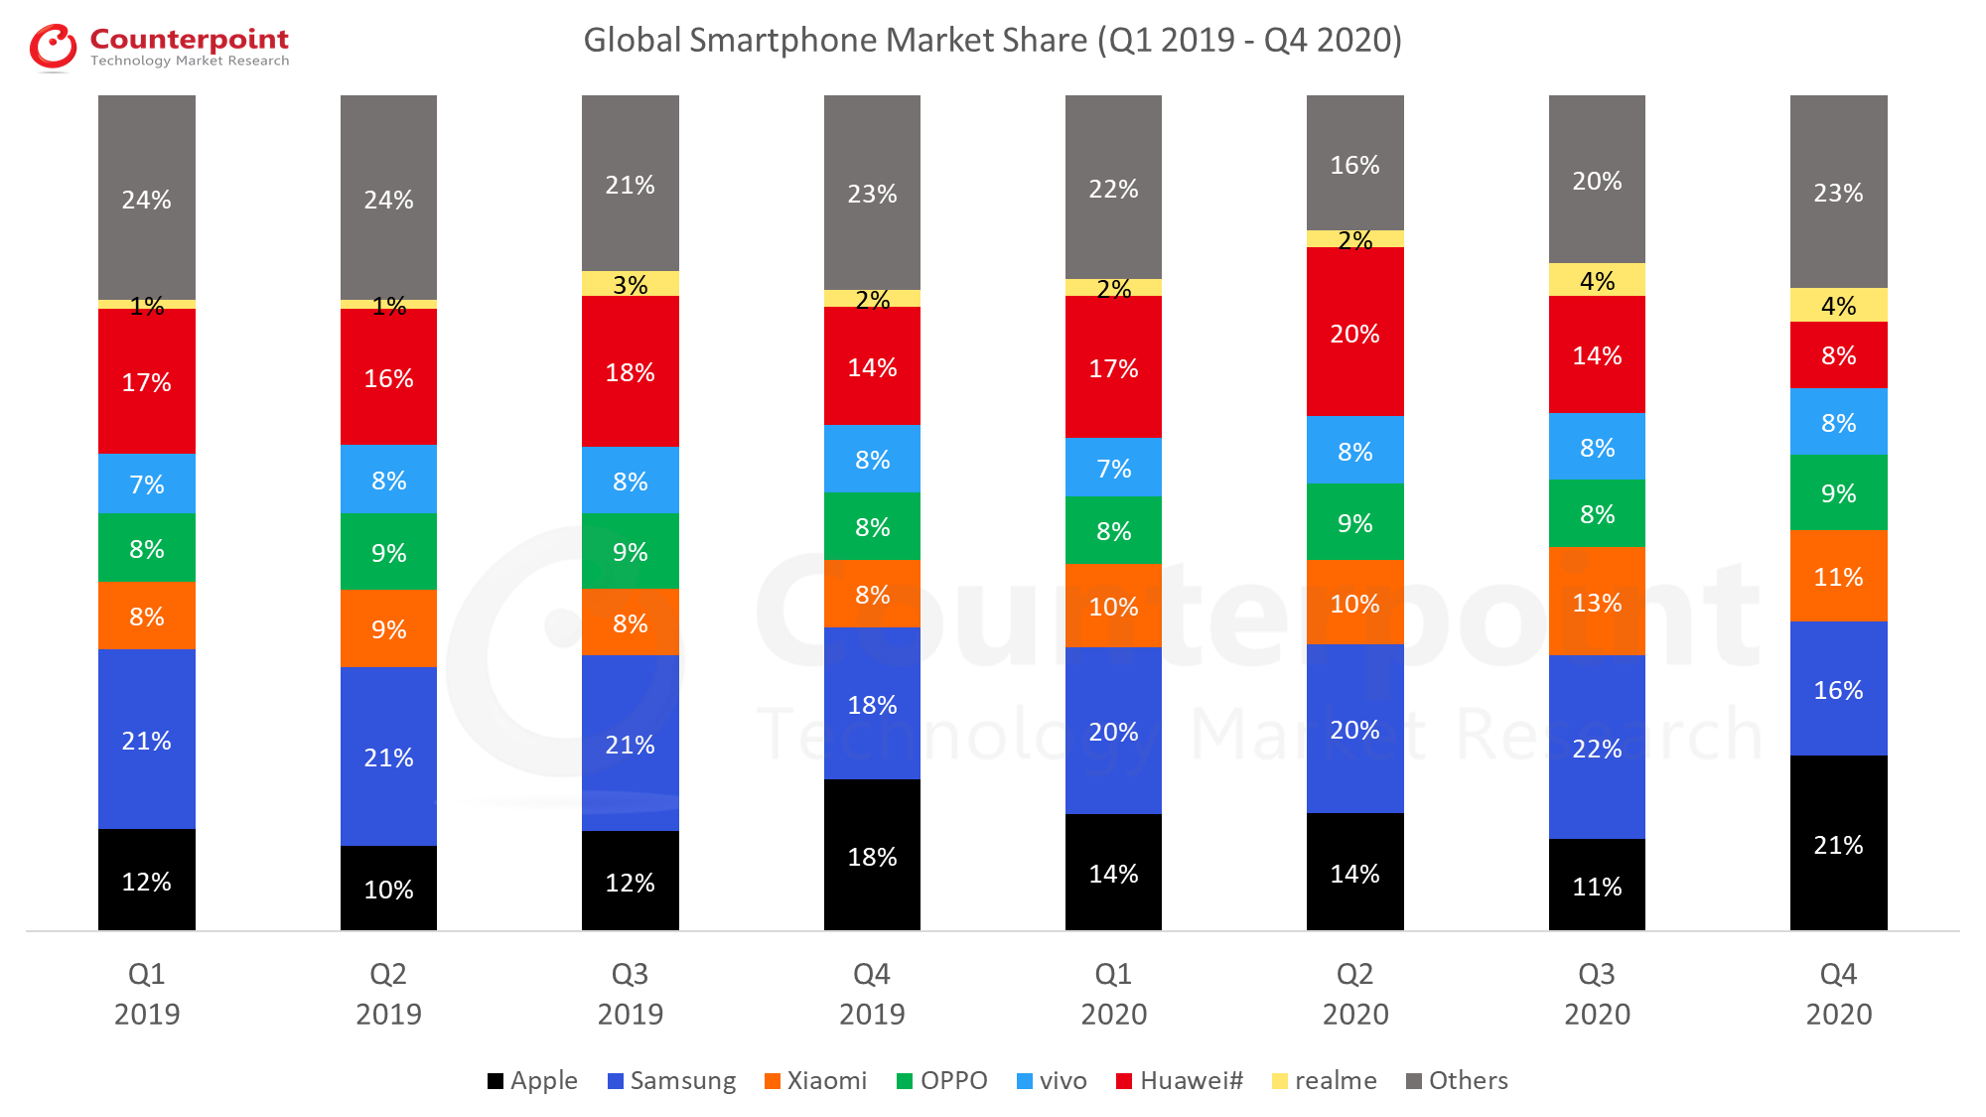
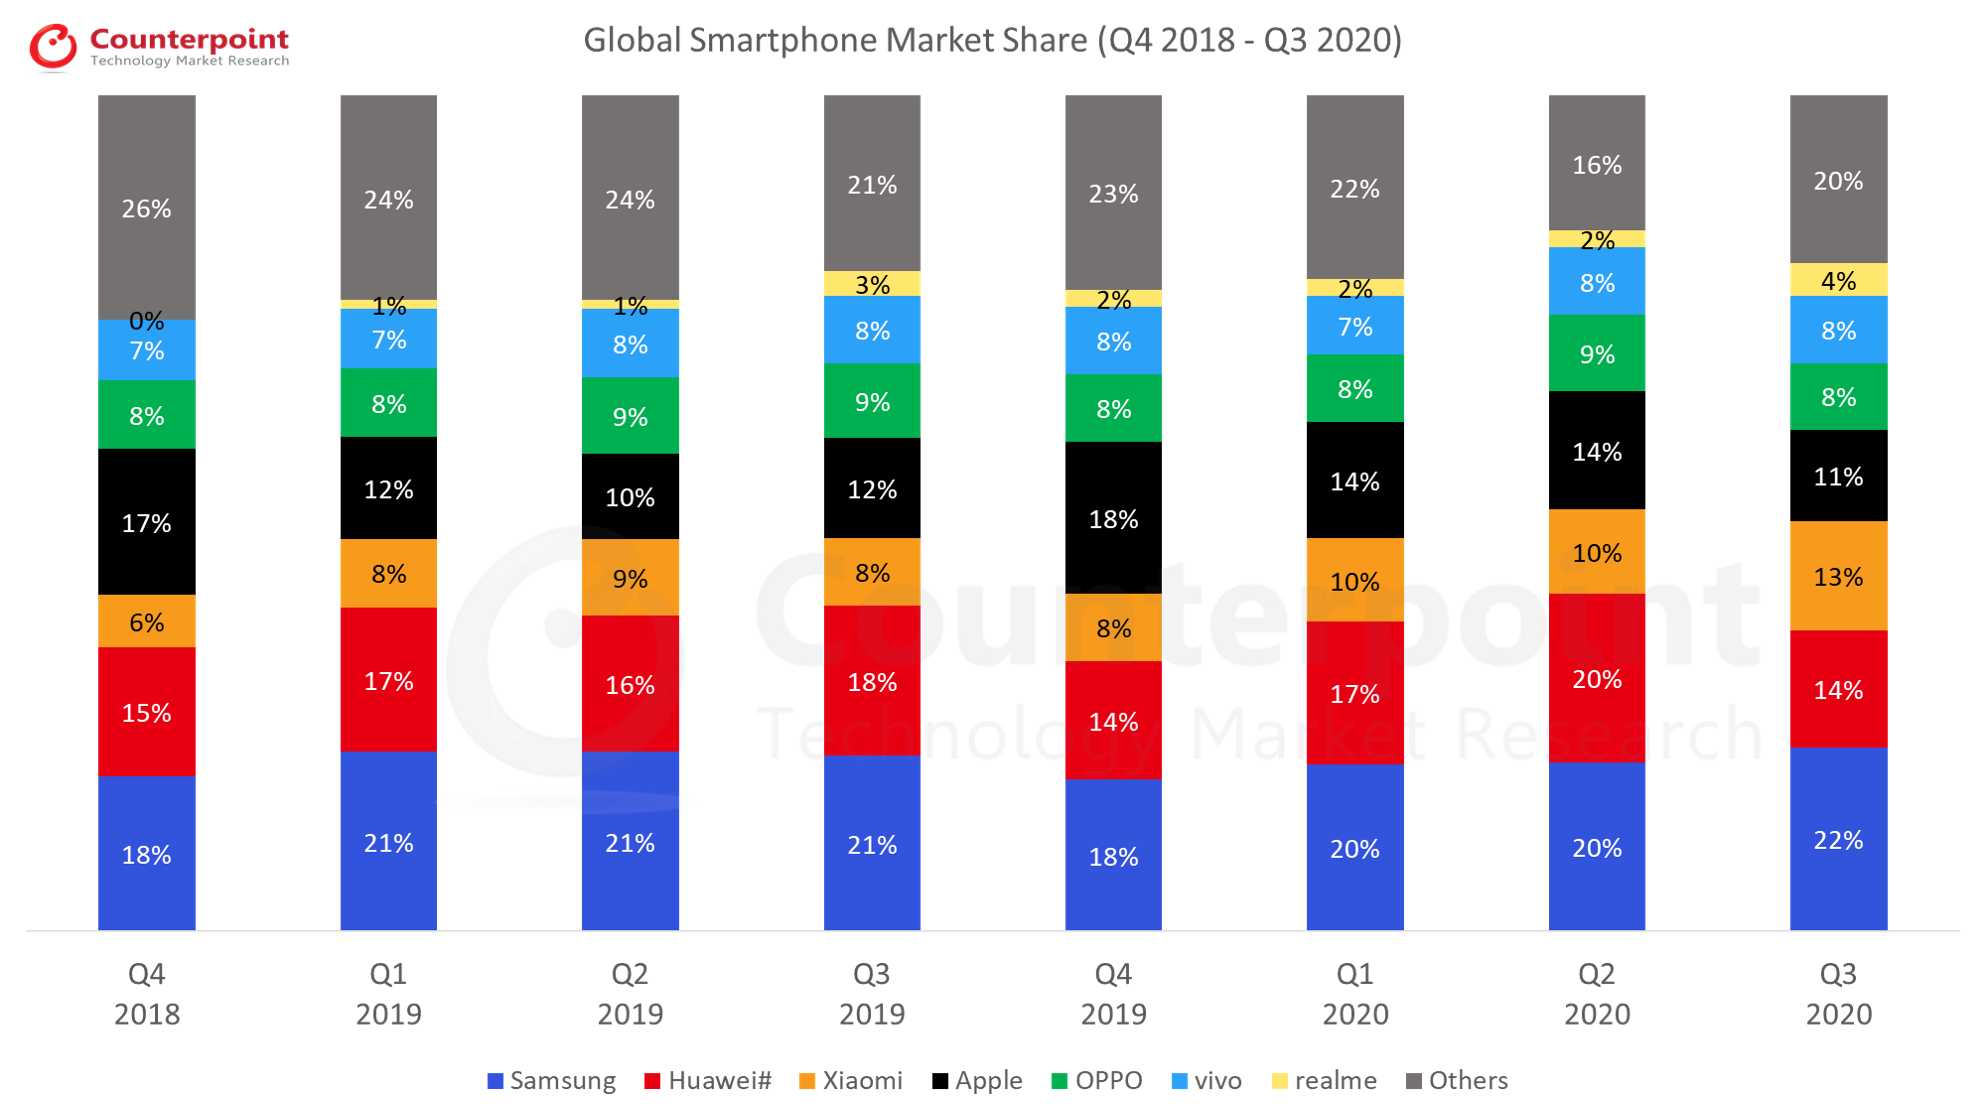
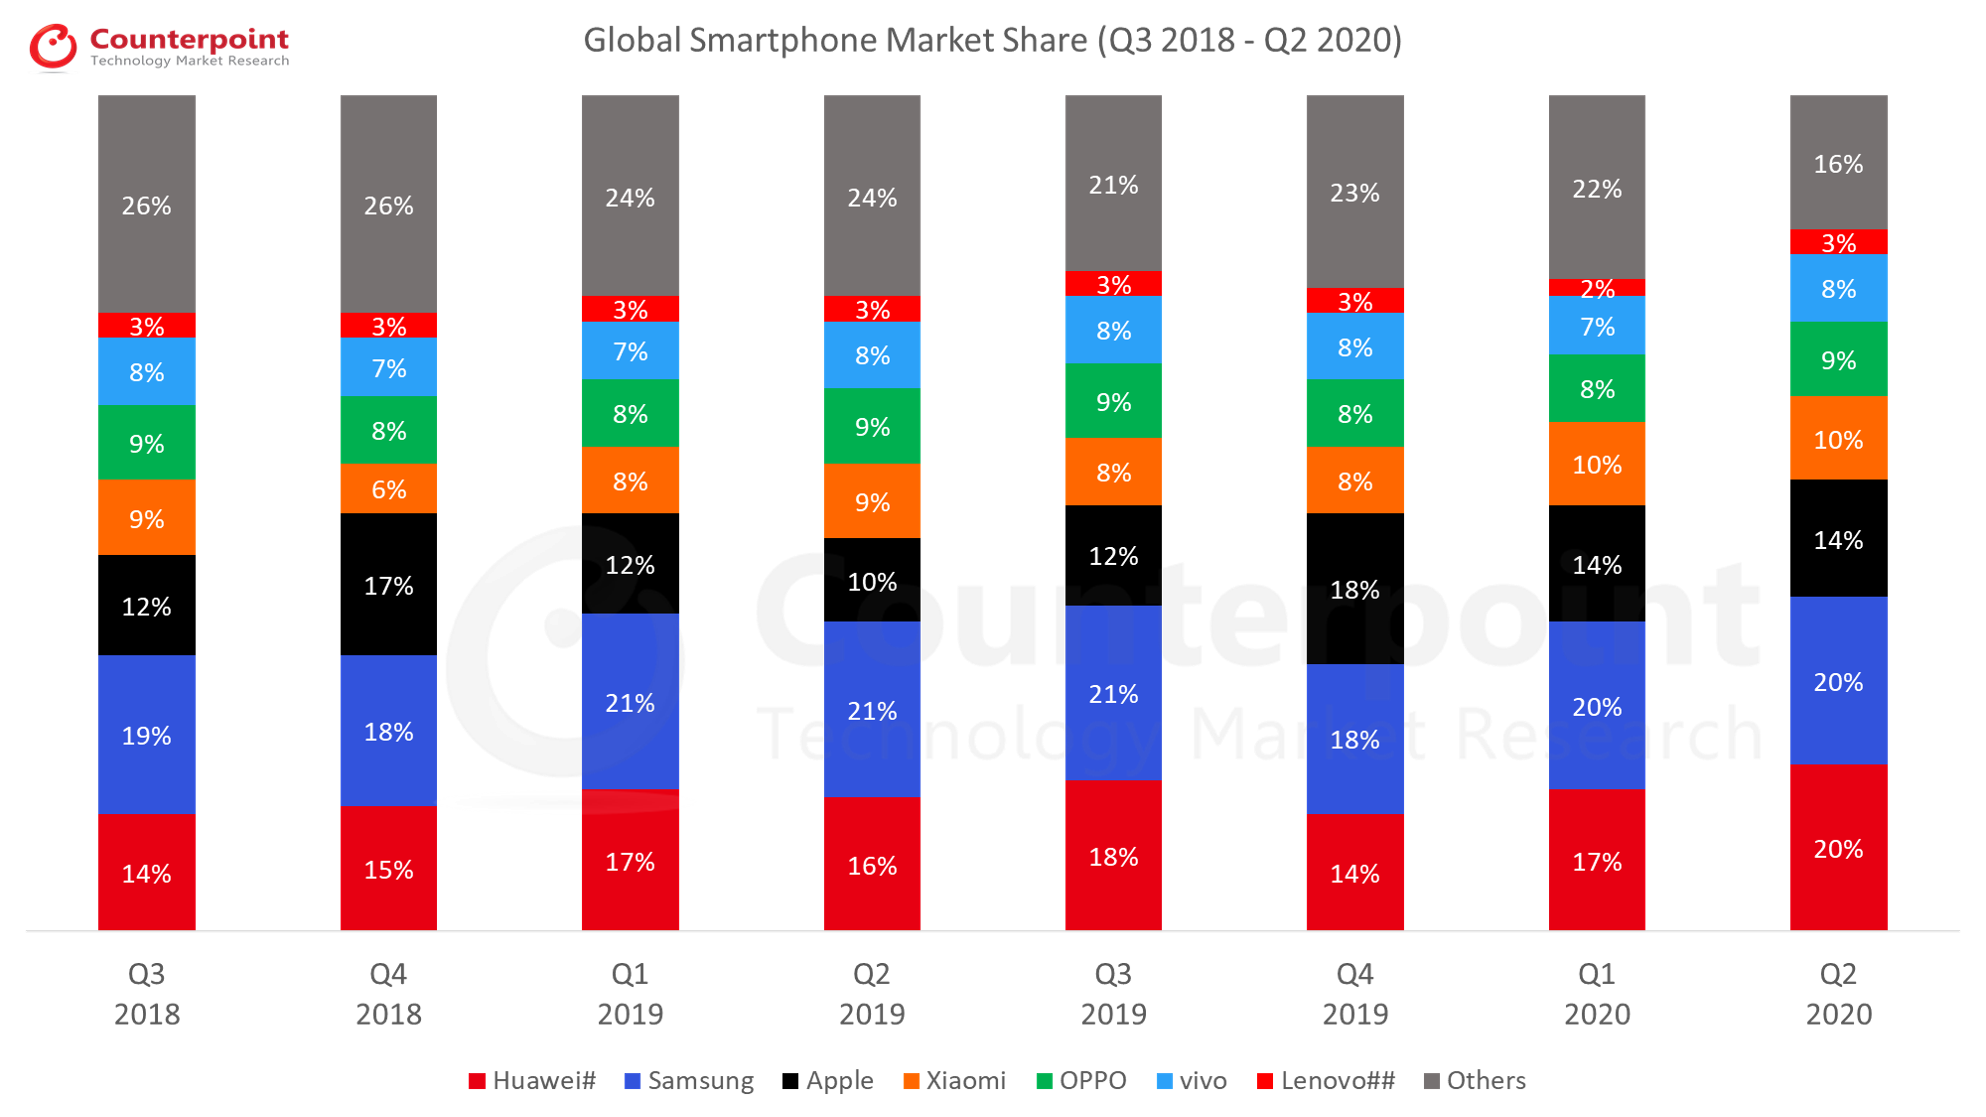

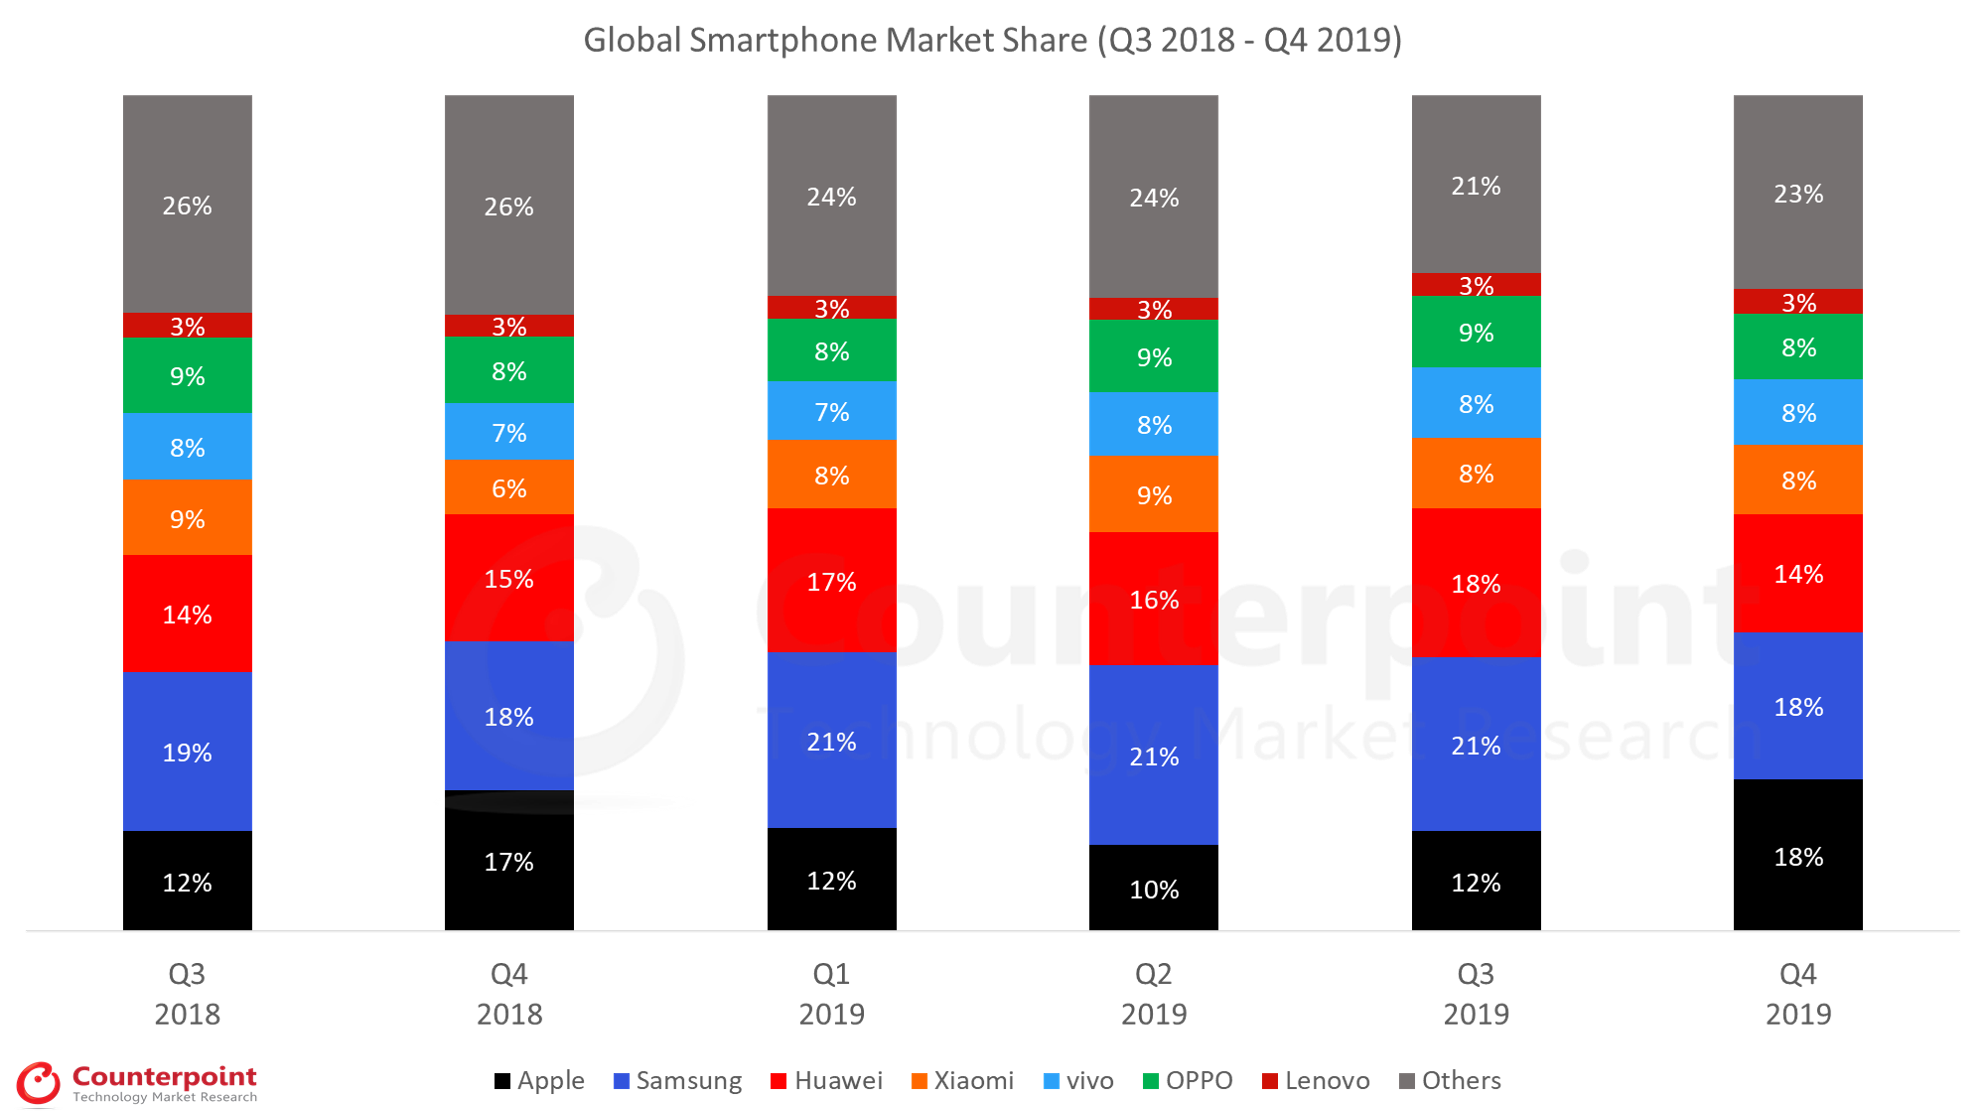 Source:
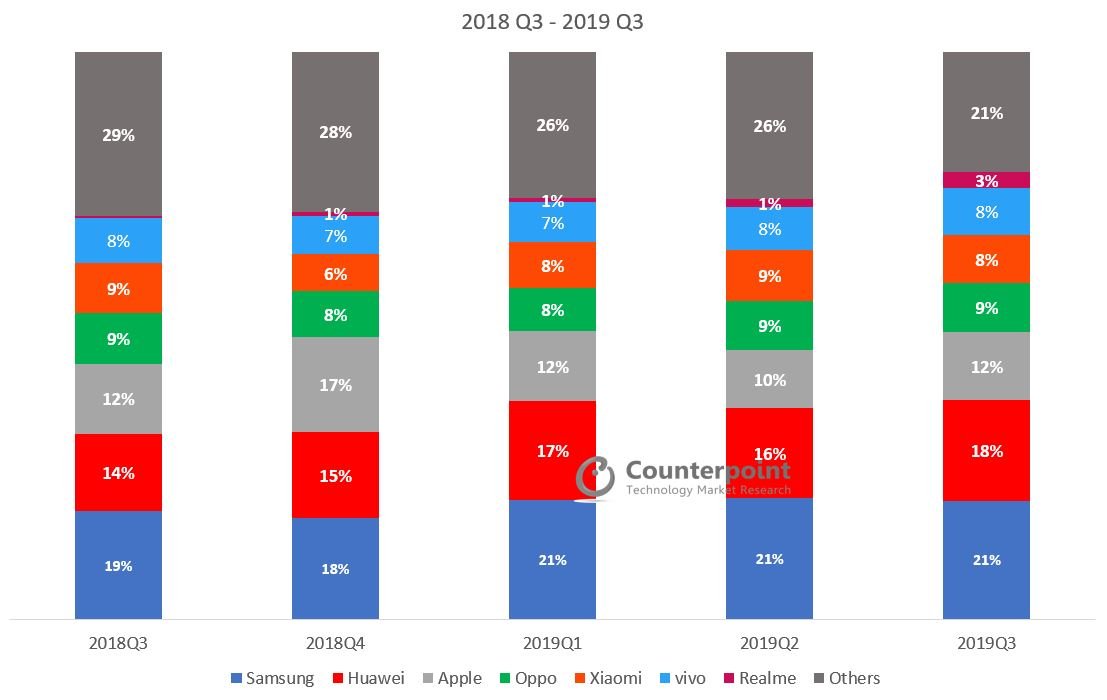
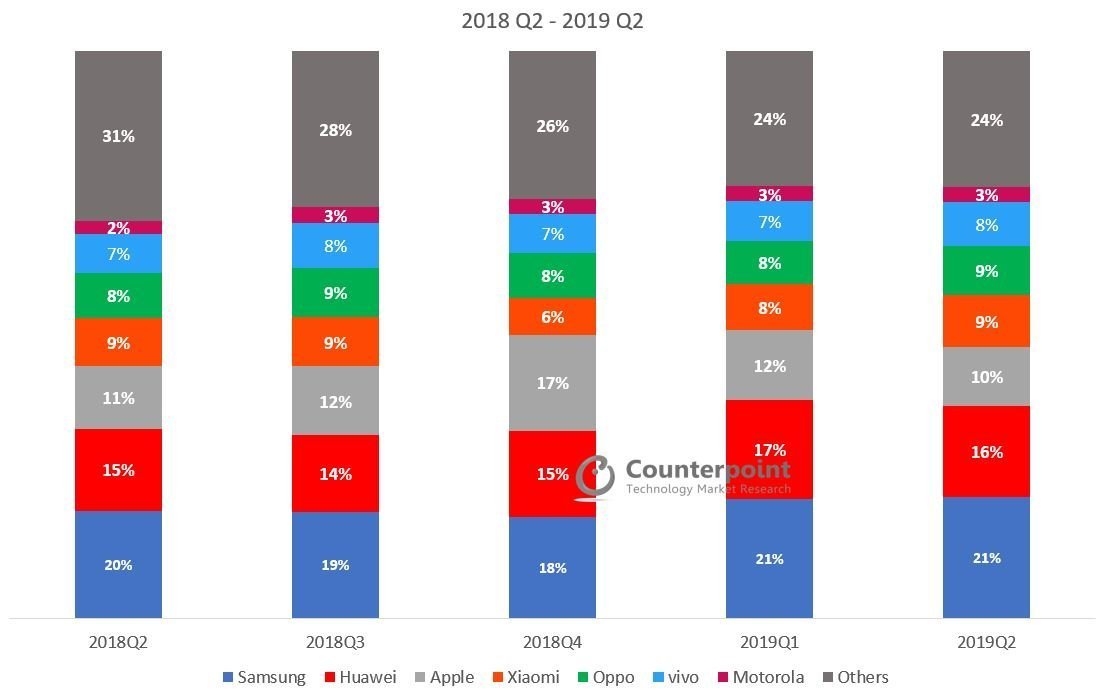
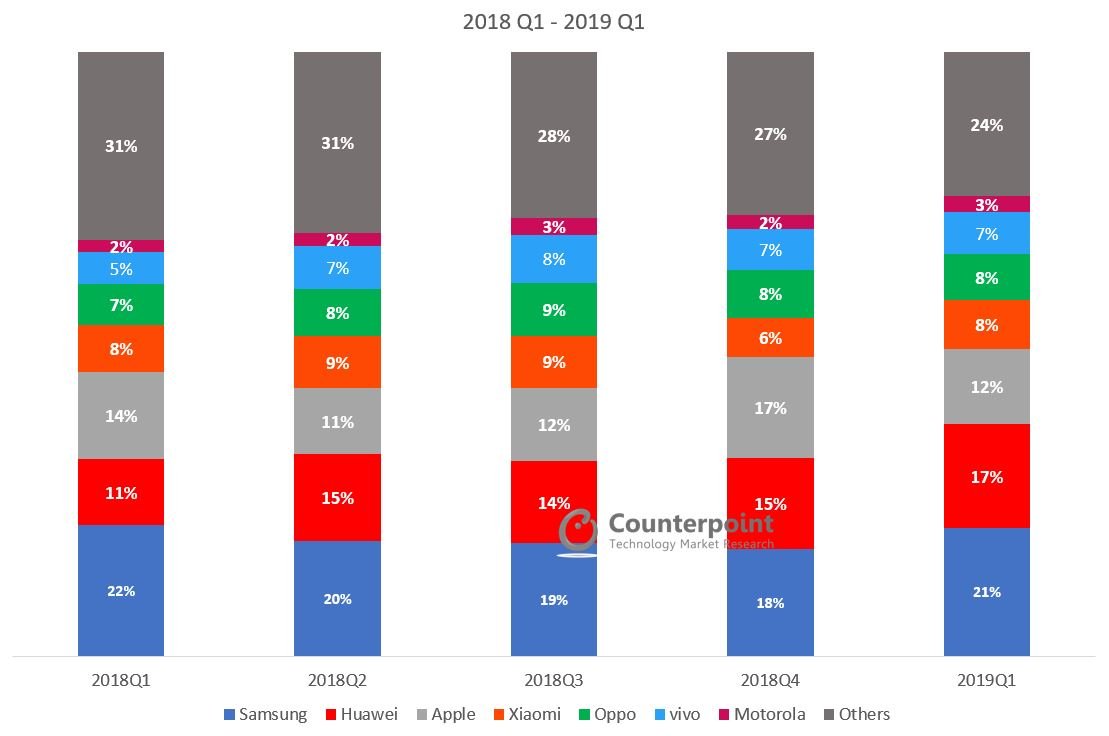
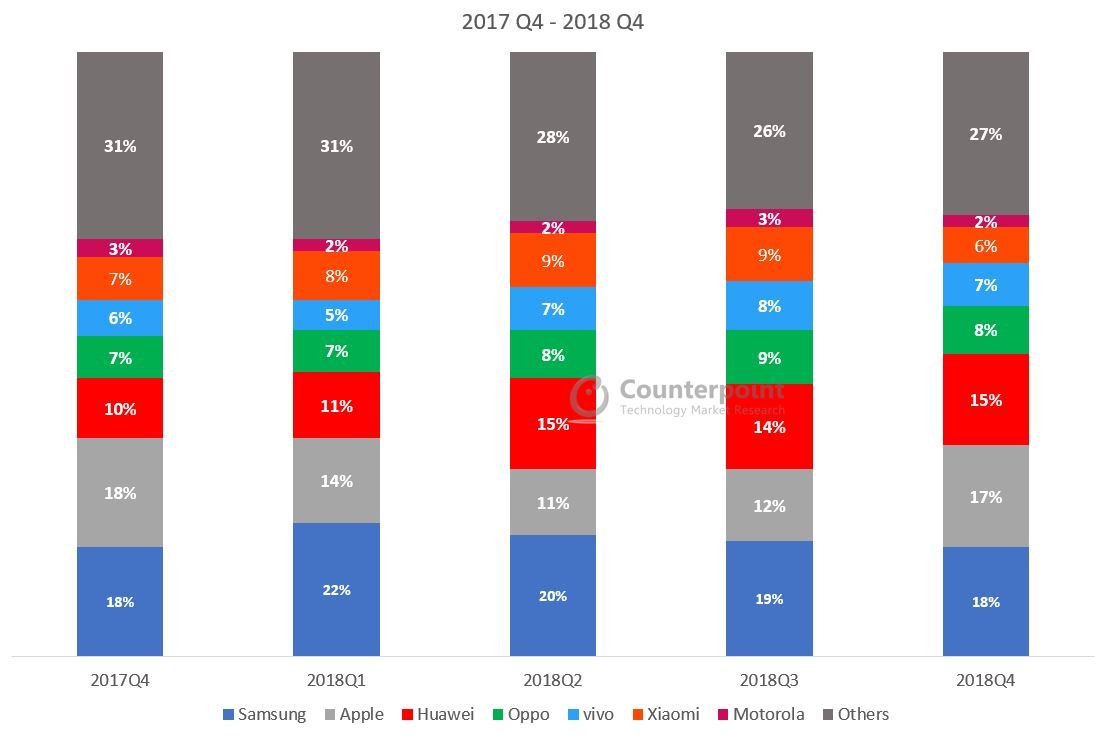 Source:
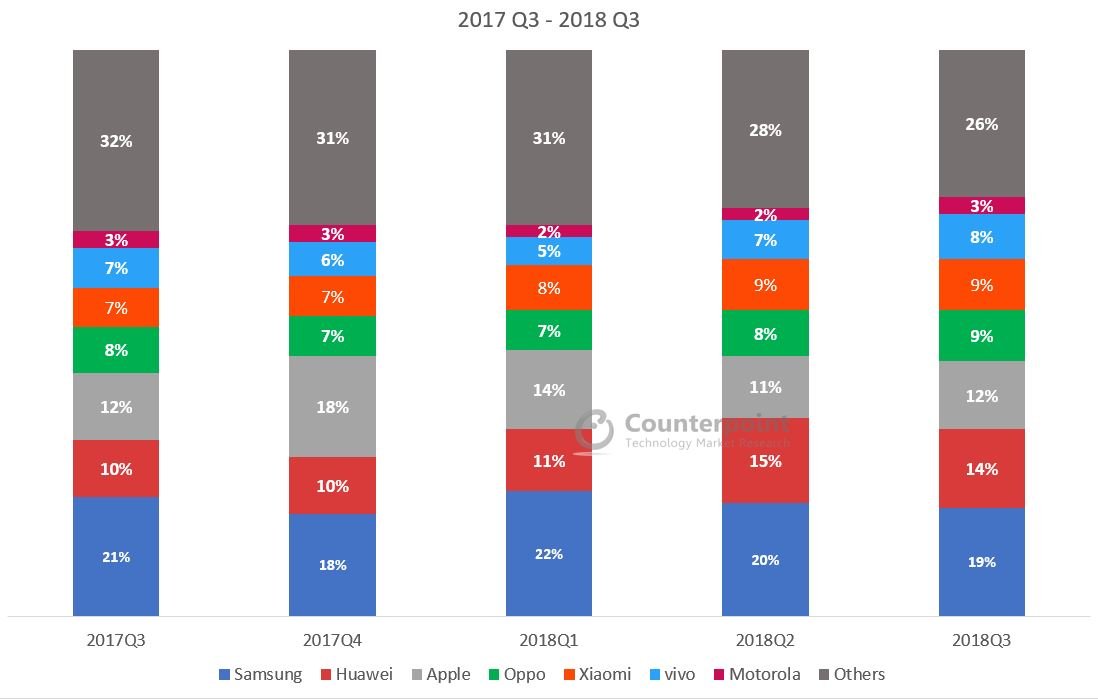
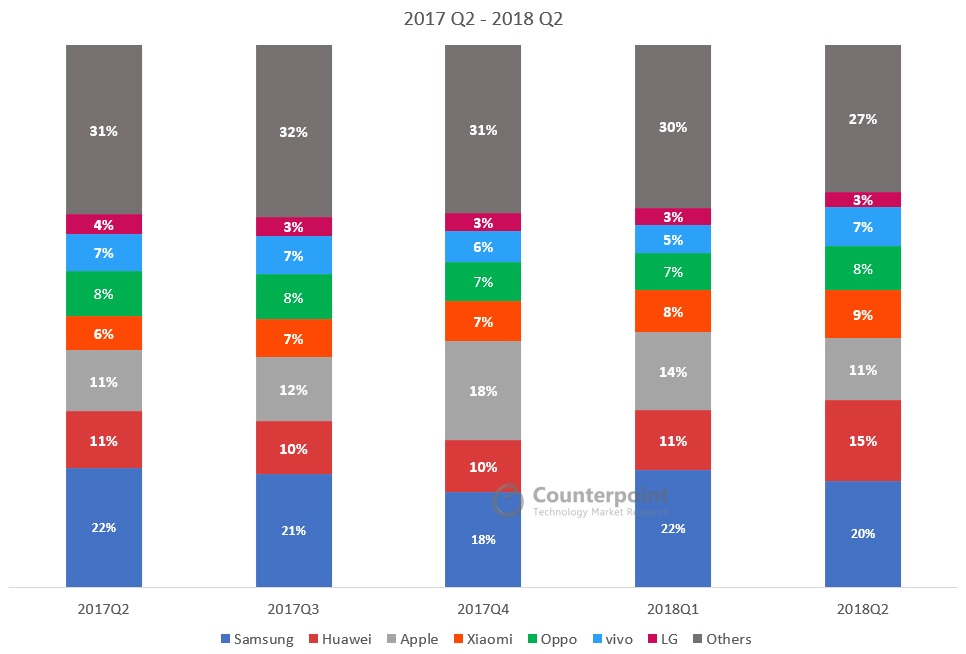 Source:
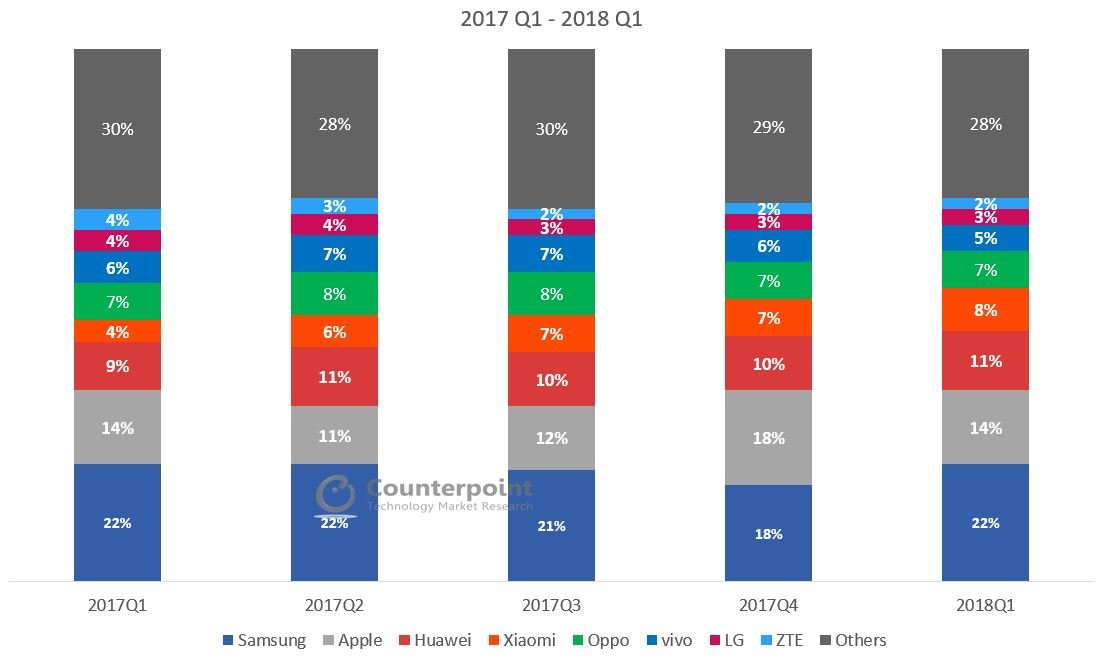 Source:
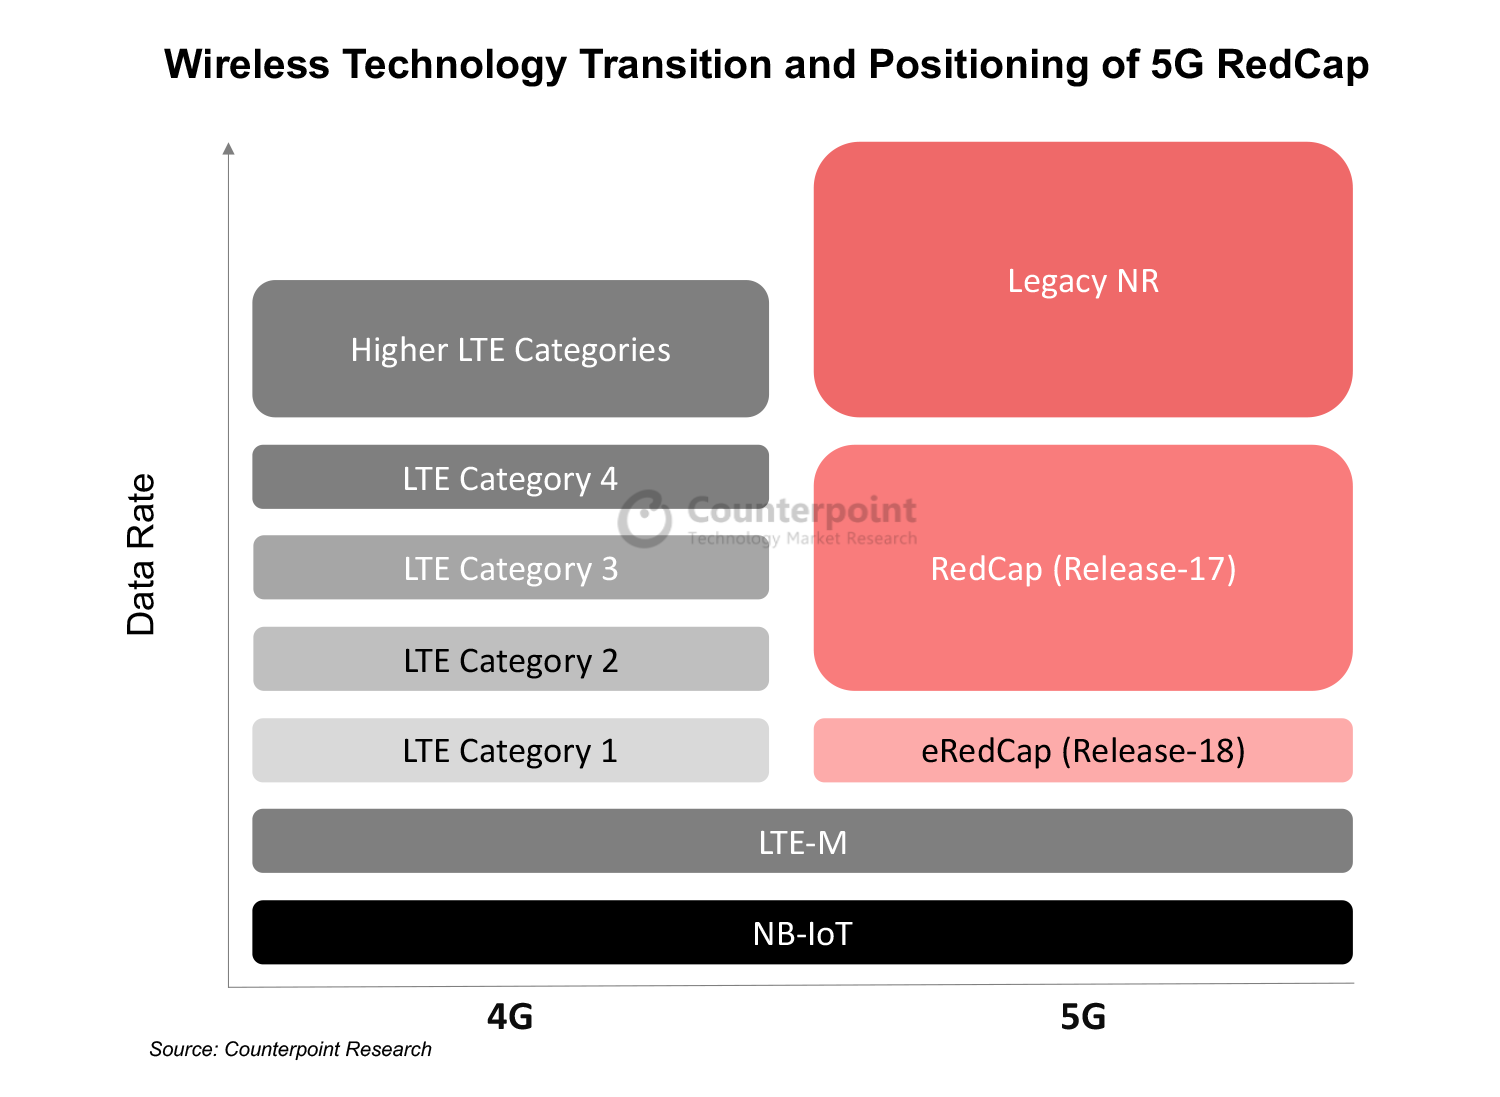
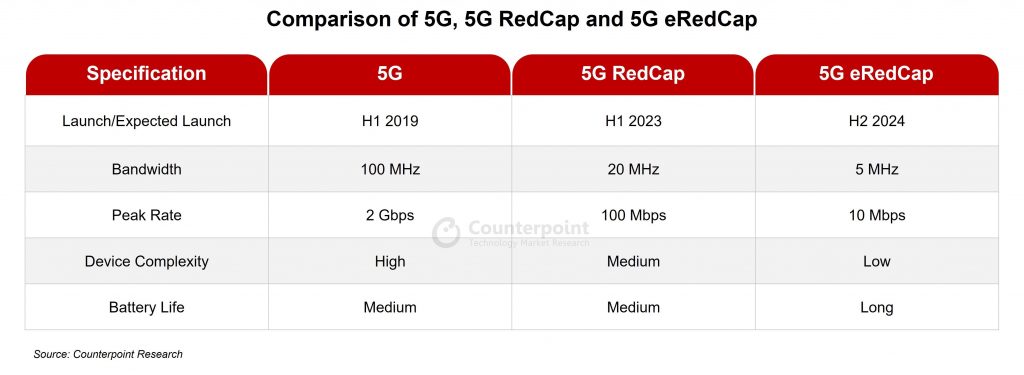
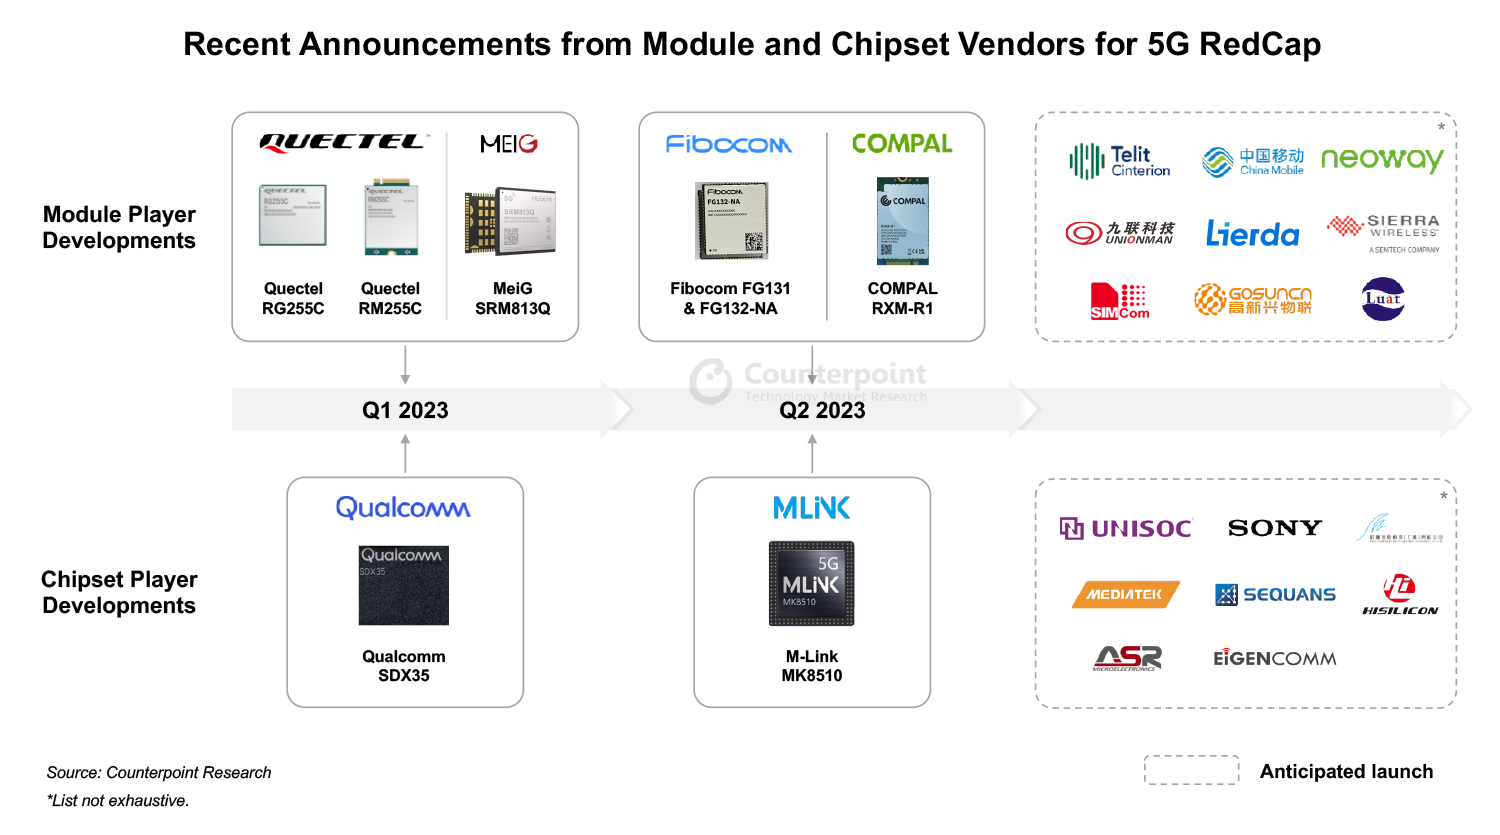


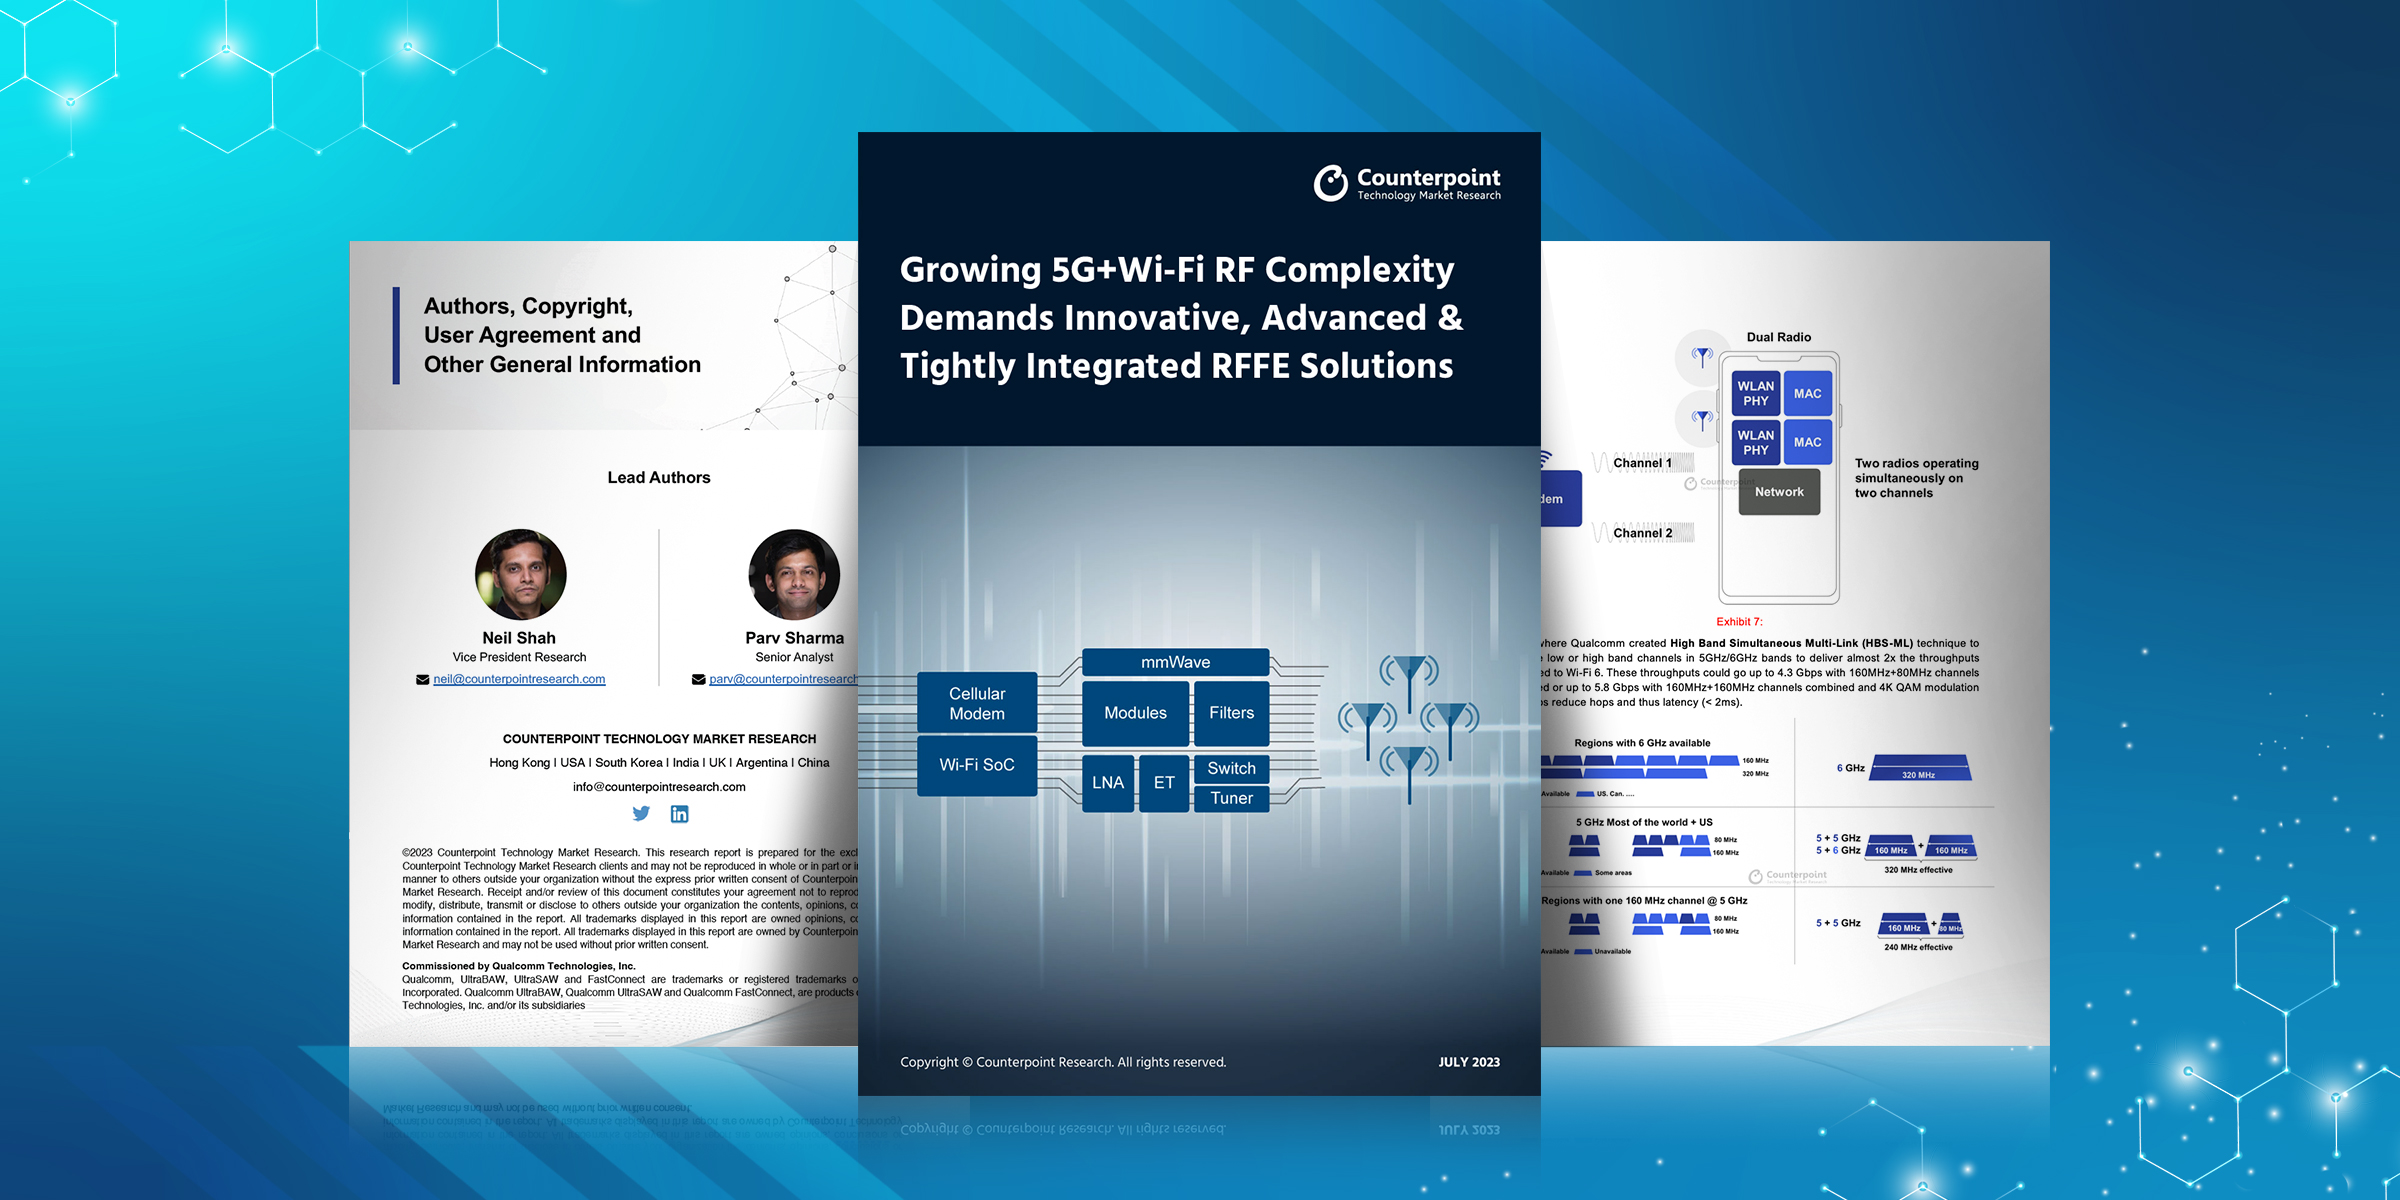


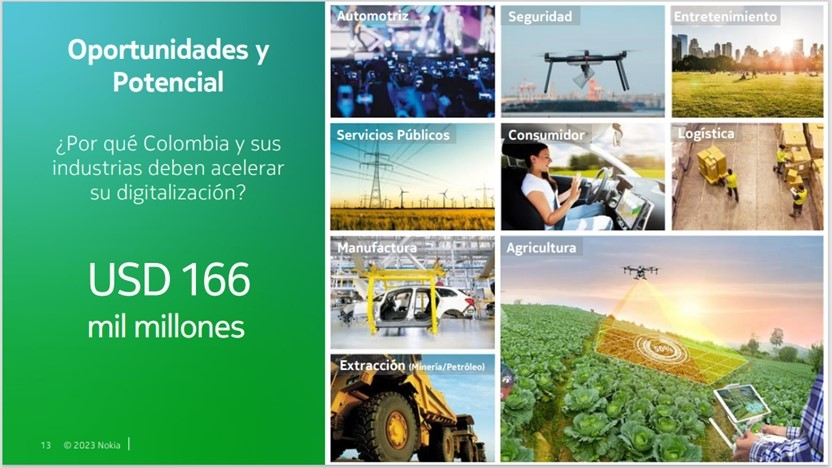

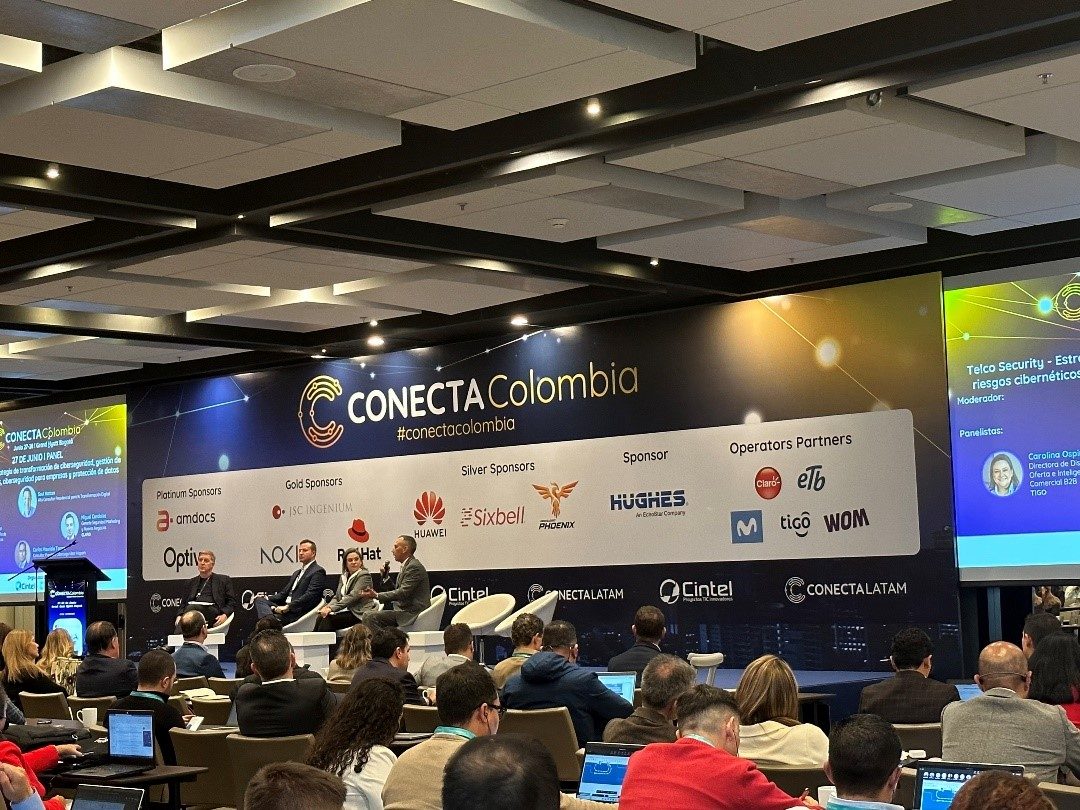
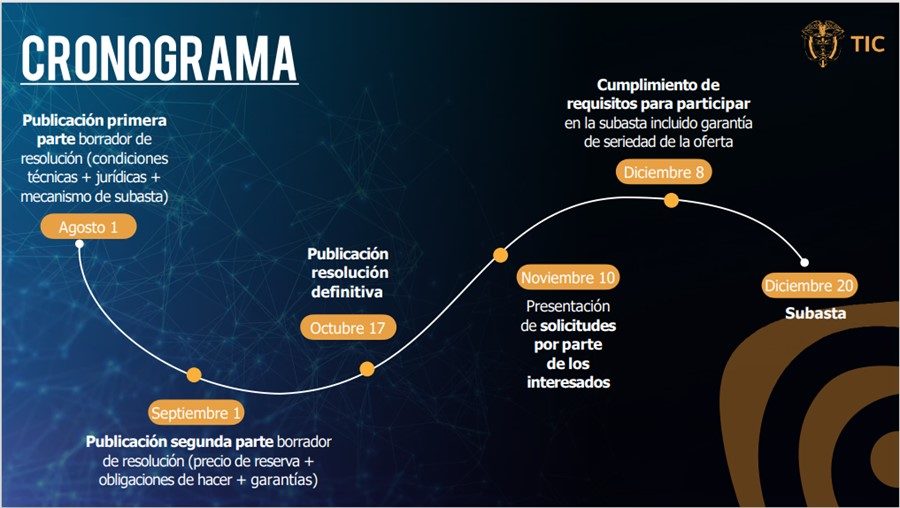


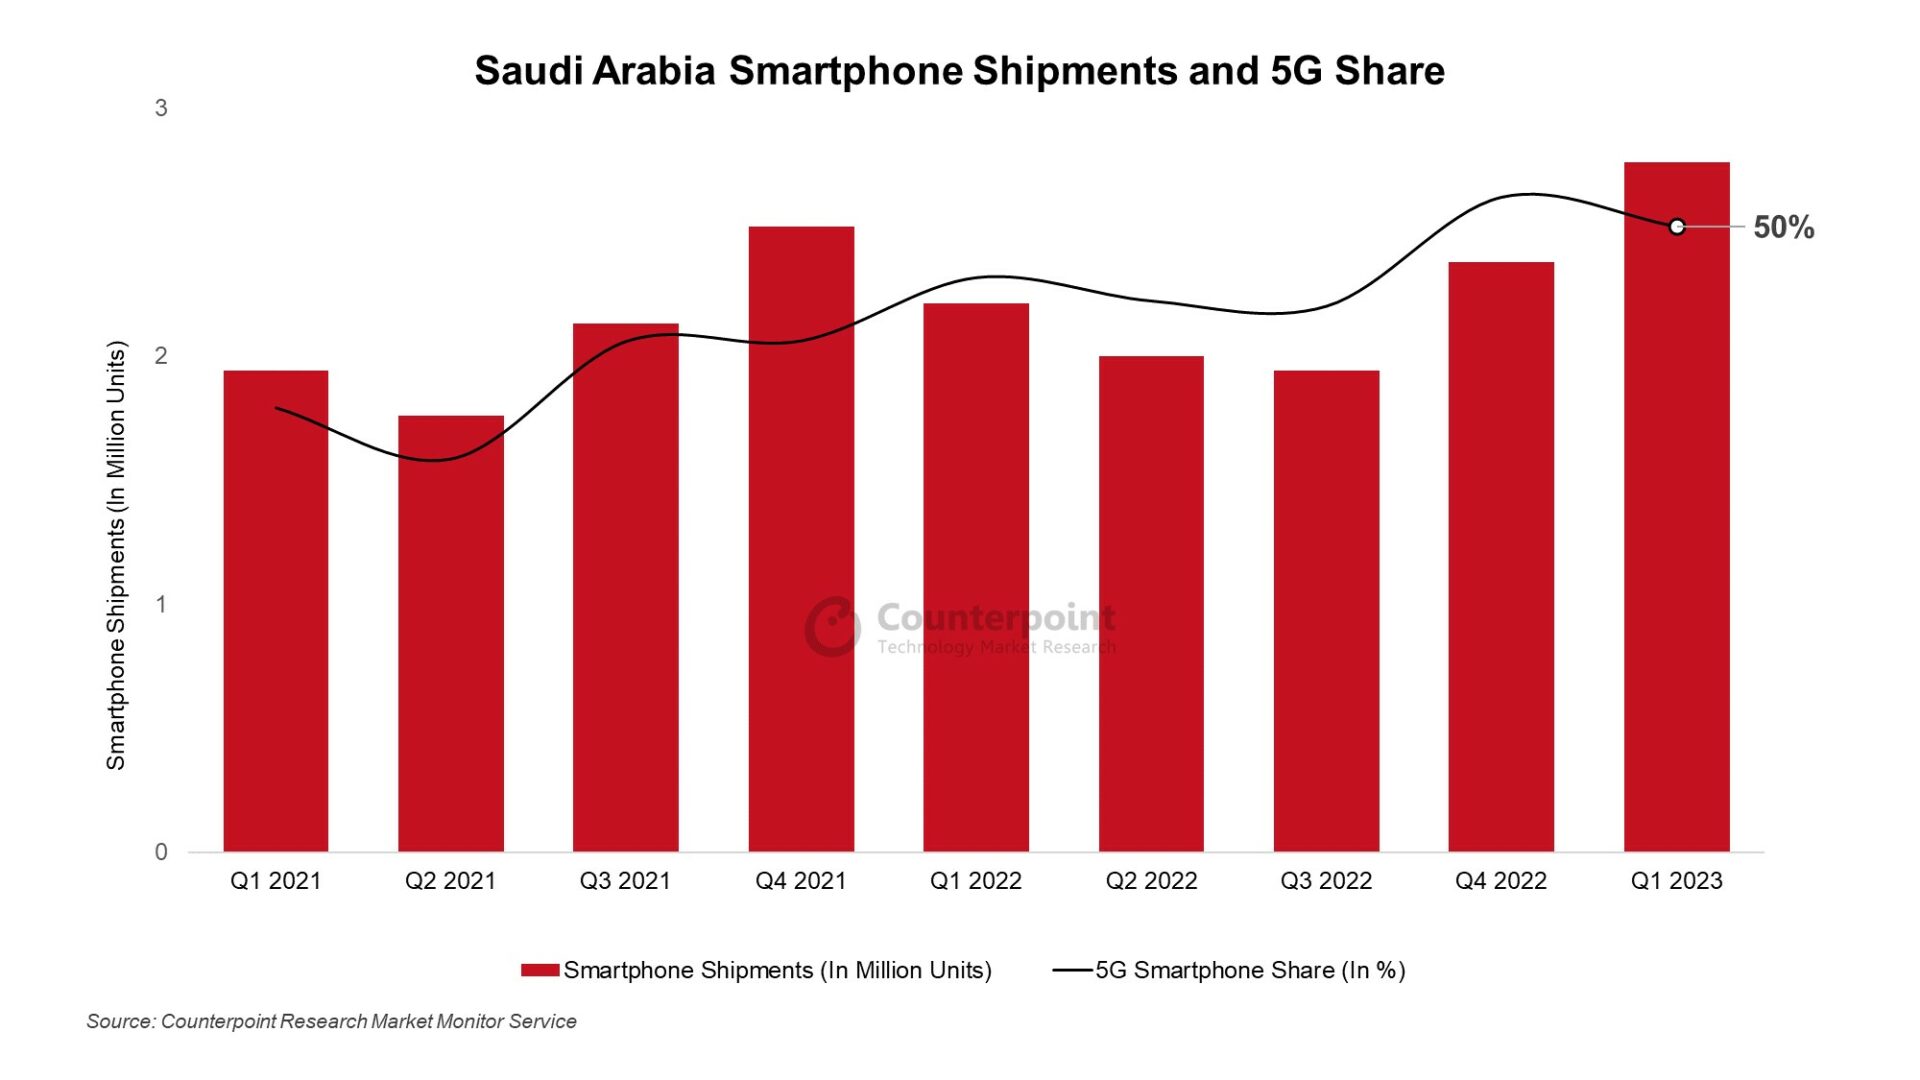
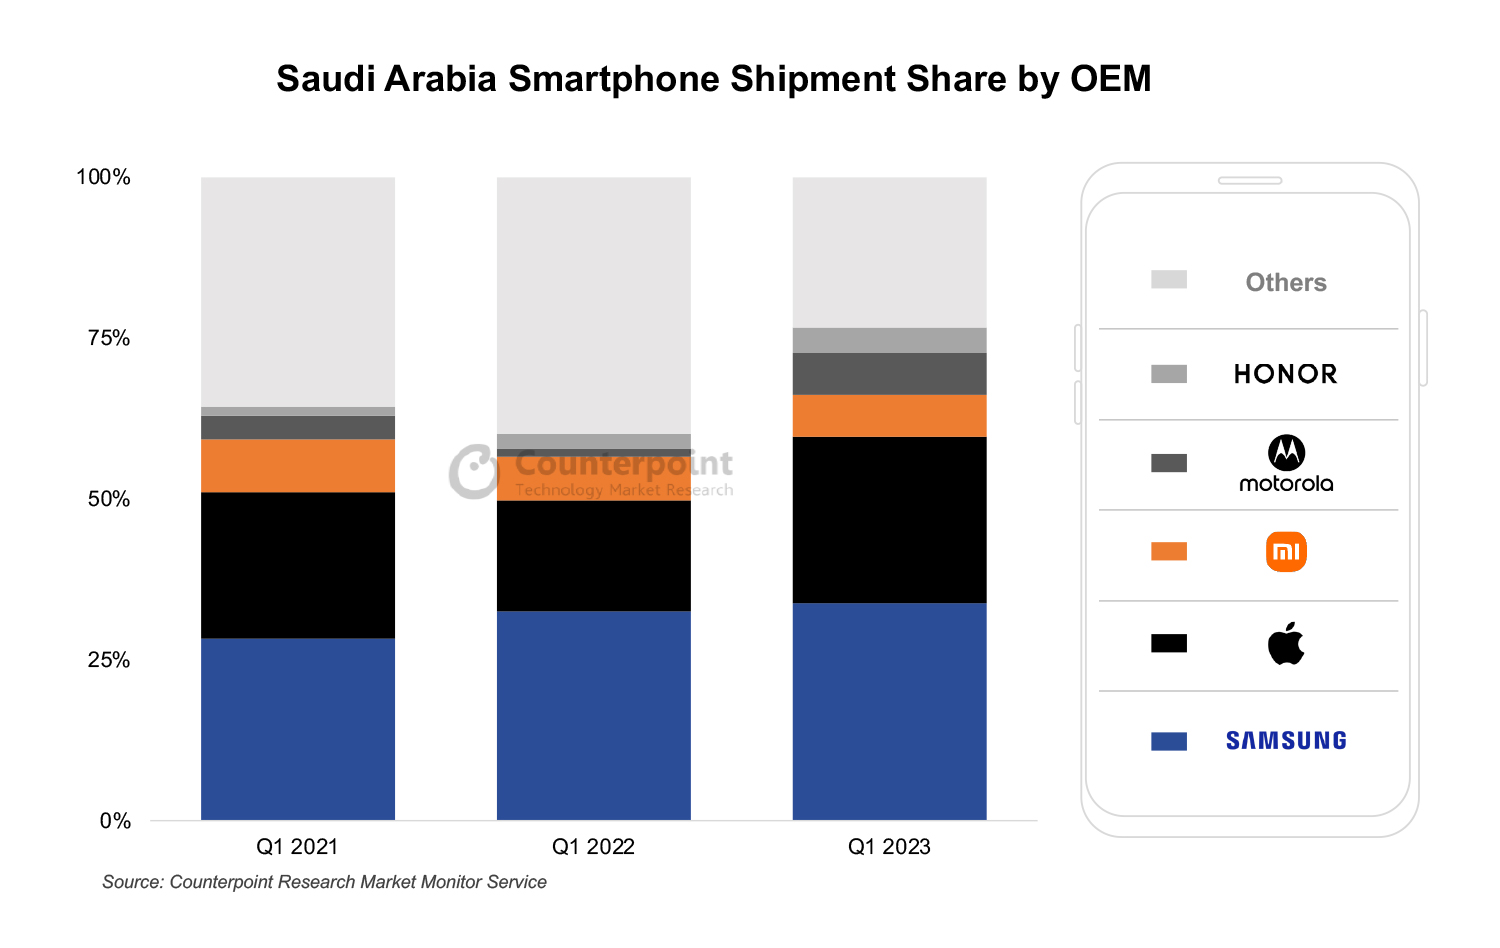 Saudi Arabia Smartphone Shipments by Top 5 OEMs for Q1 2021, Q1 2022, Q1 2023