Financial journalistGovindraj Ethirajtalks toNeil Shah, Our Research Vice President and talked aboutIndia’s Latest Big Bang Electronics projects and where will they land.
Podcast Chapter Markers
[00:56]Tata Steel sacks 38 employees, Sets A New Benchmark For Disclosures
[04:07]India’s Latest Big Bang Electronics Projects, Where Will They Land?with Neil Shah
[15:03]Hmm…IVF clinics are under the tax man’s scanner
[18:39]Mark Zuckerberg and Meta launch Threads, A Twitter Alternative, 10 million downloads and counting
[19:32]The CEOs Diet: The How & Why Of Breakfasts In Our Busy Lives
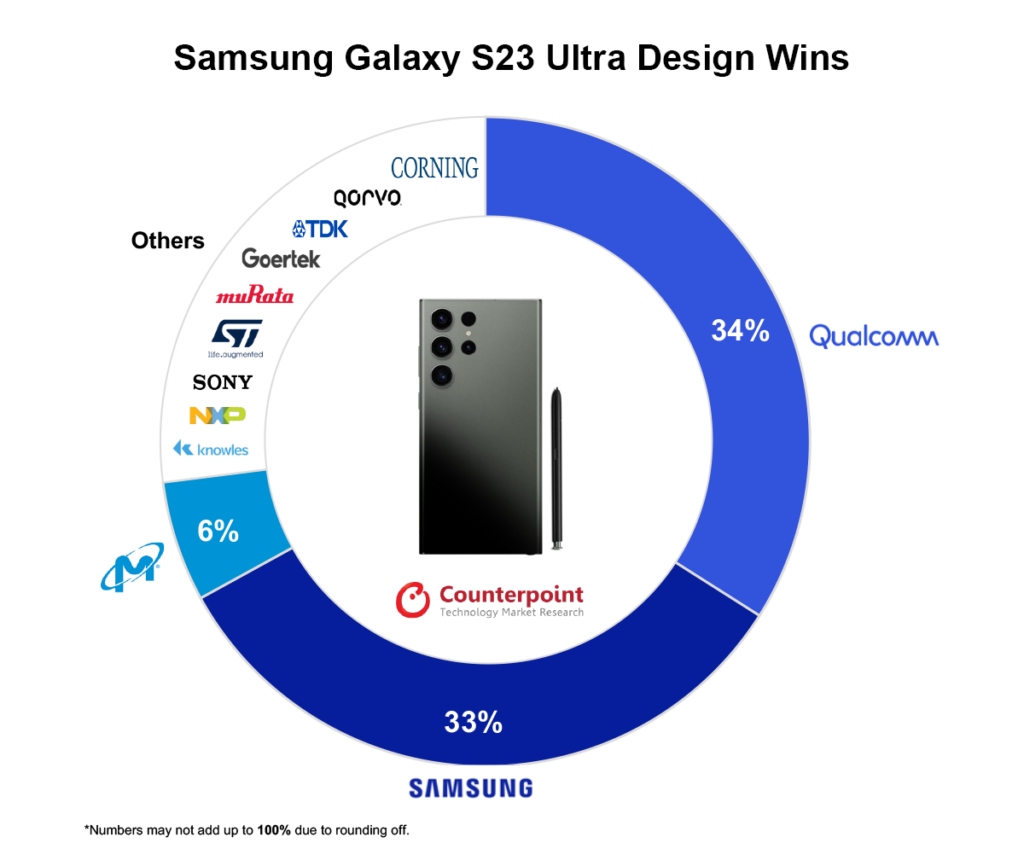
Qualcomm takes the top spot in terms of cost contribution, accounting for over 34% of the model’s BoM cost.
Qualcomm and Samsung combined contribute more than 65% of the component cost in the Galaxy S23 Ultra.
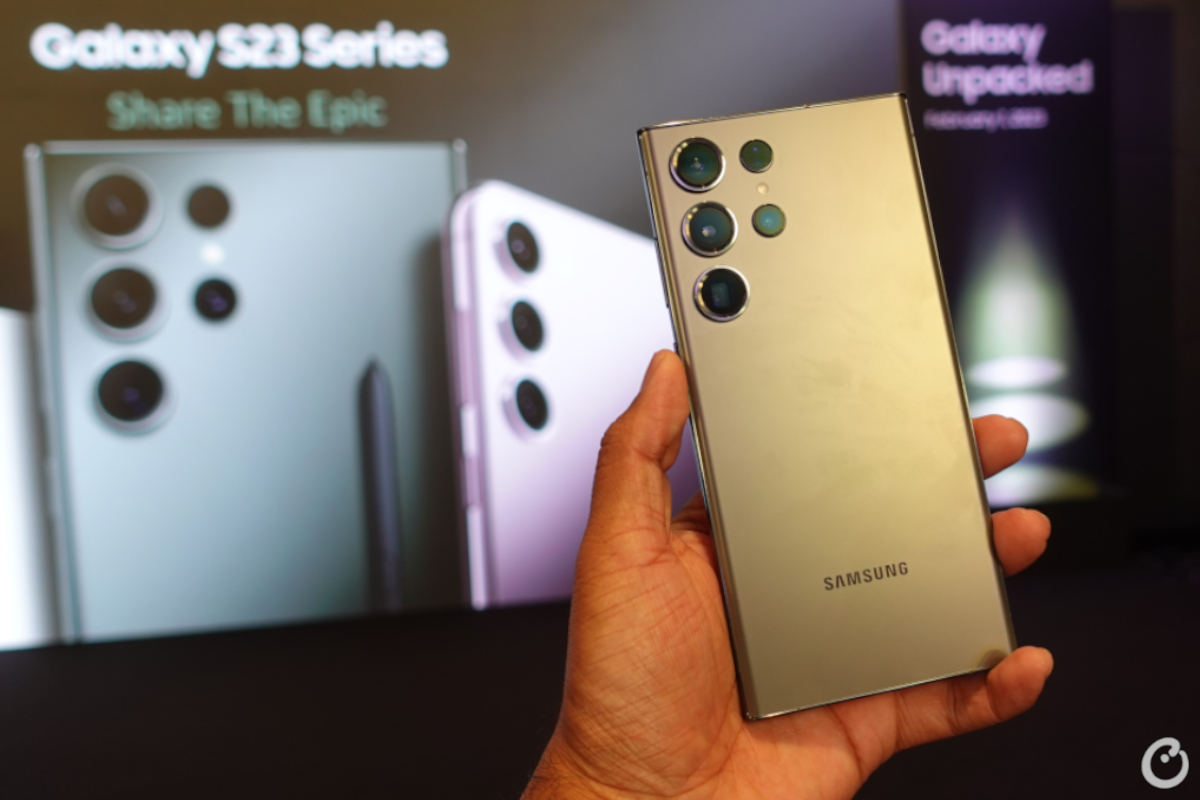
Featuring Qualcomm’s custom Snapdragon chipset, Samsung’s Galaxy S23 Ultra makes a considerable leap in computing performance with its shift to TSMC’s 4nm process node.
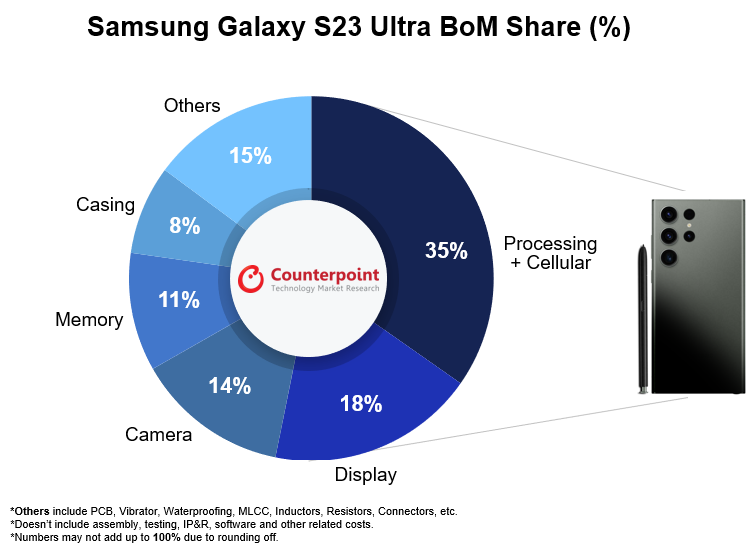
Producing an 8GB+256GB Galaxy S23 Ultra (Sub-6GHz) variant costs Samsung around $469, according to the latest bill of materials (BoM) analysis by Counterpoint’s component research service. The major components driving cost in thesmartphoneare the SoC, display and camera subsystem. Due to excess inventory and supply, components related to theRF sub-systemand memory were subjected to a cost decrease.
Qualcomm and Samsung’s design wins
TheS23 Ultrafurther builds upon Qualcomm’s design, showcasing a customized version of the Snapdragon 8 Gen 2 chipset, manufactured onTSMC’s 4nm process node. Samsung has chosenQualcomm chipsetsdue to enhanced cellular support, increased performance gain from both the CPU and GPU, and better battery life. The GPU also has support for raytracing and has gained a slight uplift of 39MHz clock speed.
Qualcomm’s share in the S23 Ultra has increased to an all-time high after attaining design wins for the fingerprint sensor IC, key power management ICs, audio codec,RFpower amplifiers, Wi-Fi + Bluetooth, GPS and Sub-6GHz transceiver.
Samsung is the second largest beneficiary. It is an exclusive supplier of the 256GBNAND flashand the 6.8-inch AMOLED display for the S23 Ultra. Thedisplaycan sustain 1750 nits of peak brightness and has a resolution of 1440 x 3088 pixels that allows the users to view pictures and videos in sharp detail. The 120Hz LTPO panel also supports adaptive refresh rate.
In thecamera sub-system, the design wins are shared between Samsung (SEMCO) and Sony. Samsung provides the 200MP wide-angle camera (S5KHP2) and the 12MP selfie camera (S5K3LU), while Sony offers the 12MP Ultrawide (IMX564), 10MP Telephoto and Periscope Telephoto (IMX754) sensors.
Other component suppliers
Silicon Mitus and Maxim are the providers of power management ICs that support the regulation of power for display and other key components.
For sensing components,STMhas registered design wins related to the laser autofocus module, accelerometer, gyroscope, barometer, and touch panel controller. The battery is packaged by Samsung and the cell is provided by ATL. The quick charging IC, which charges up to 45W, is sourced fromNXPwhile the 15W wireless charging IC is from Convenient Power.
Samsung’ssourcing strategyand choice of components are enabling the brand to have a competitive edge in terms of cost efficiency.
For detailed component and pricing analyses, queries, or for acquiring this research, contactinfo@www.arena-ruc.com
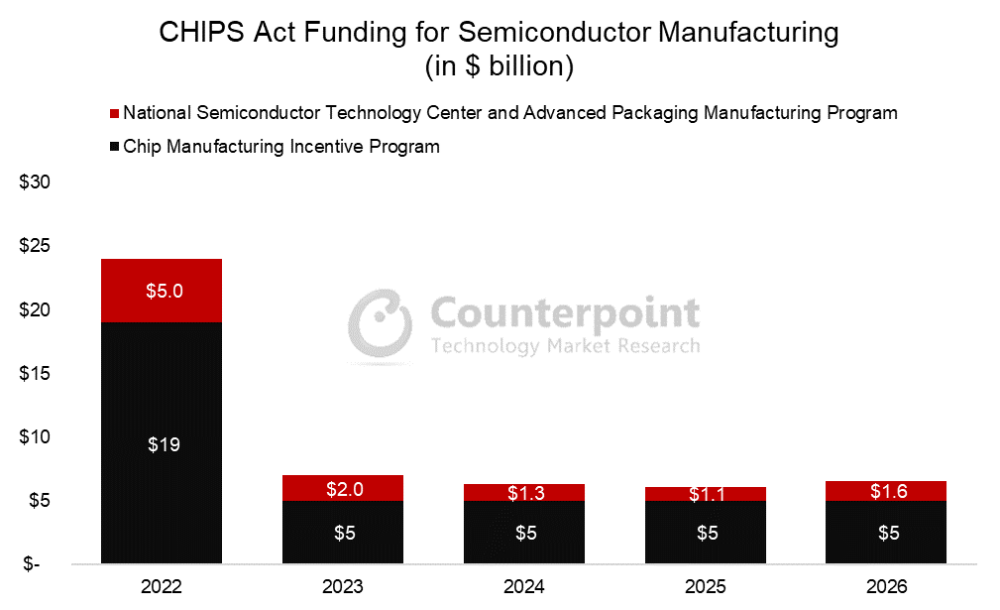
The legislation includes over $52 billion in subsidies for semiconductor manufacturing.
So far, investments worth over $200 billion have been announced for manufacturing.
New foundries from TSMC, Intel, Samsung, Micron and Texas Instruments are underway.
Last August, the US Congress passed the CHIPS Act, the largest piece of industrial policy signed into law in the US in a generation. The legislation includes over $52 billion in subsidies for semiconductor manufacturing. Over the past two decades, the share of semiconductors manufactured in the US has steadily fallen while advanced semiconductor manufacturing has become increasingly concentrated in just a handful of cities, primarily in Taiwan and South Korea.
The outbreak of COVID-19 wreaked havoc on supply chains as factories shuttered, while the fallout of an unexpected winter storm in Texas further disrupted semiconductor manufacturing. Compounded by an explosion of demand as companies, schools and government offices pivoted to work from home, the chip shortage set in, shaving a percentage off of GDP growth according to the White House. In summary, the events of the past few years have made abundantly clear the foundational role that semiconductors play in today’s economy, and the costs that accompany constrained supply.
来自美国的公法117 - 167 8月9日,2022
All this triggered the finalization and passage of the CHIPS Act. The US government was convinced that the country’s supply of semiconductors, which power everything from washing machines, smartphones and cars to supercomputers and hypersonic missiles, faced an unacceptable bottleneck at a pivotal moment. The US is almost entirely dependent on Taiwan for the production of advanced chips even as cross-strait tensions reach new highs and US-China relations new lows. Indeed, concerns over a potential conflict in the South China Sea as well as between North Korea and South Korea, not to mention acts of God, impacting chip supplies convinced the US government about boosting the country’s semiconductor manufacturing. But with higher labor costs and plenty of red tape,semiconductor manufacturersneeded added incentives to make the transition worthwhile. The CHIPS Act has done just that, sparking a wave of private investment.
Since the CHIPS Act was passed, investments worth over $200 billion have been announced for manufacturing capacity in the US, with new foundries underway from TSMC, Intel, Samsung, Micron and Texas Instruments. But while the CHIPS Act has lit the flame under private companies to act, some of the legislation’s provisions and shortcomings could lead to its undoing. These projects are faced with red tape and regulations that will cause them to linger before coming on line. Besides, while funding has been made available for workforce education and job training, the scale of the need for new employees and the lack of the required workers and skills will likely pain semiconductor firms for years to come. One solution would be to raise the number of visas available for skilled workers from abroad. Another would be to provide targeted assistance to students pursuing degrees in related fields. Finally, the Act itself fails to address the reason why semiconductor manufacturing left the US in the first place – American labor costs and regulations make production in the US more expensive than elsewhere. Once the funding runs dry, how will American semiconductor manufacturing remain competitive? Additional burdens on employers to guarantee union wages and provide child care certainly won’t make these projects anymore cost-competitive.
While flawed, the CHIPS Act is a major stepping stone to creating secure, resilient supply chains that will insulate the country from many outside shocks. This is a step in the right direction, but more must be done if the country wants to win the semiconductor manufacturing marathon and avoid fizzling out after the starting sprint.
For more information about the CHIPS Act, a detailed report on the legislation can be foundhere.
Joining the US-led effort to restrict chipmaking equipment exports to China, Japan has put in place restrictions that are more draconian than that of the US and where the Japanese state has effectively taken control of the country’ssemiconductorcapital equipment market.
Japan is imposing export restrictions on 23 types of equipment used to makesemiconductors.But instead of limiting the restrictions just to China, it has flipped the entire industry on its head.
Instead of being able to ship to anyone unless told not to, now the Japanese companies can’t ship to anyone unless they are allowed to.
This effectively gives the Japanese trade ministry life and death power oversemiconductorequipment, which may prove to be detrimental to the local industry’s health in the long run.
Unlike theUSDepartment of Commerce, where the presumption is denial of a license, it seems the Japanese Ministry of Trade will operate under the presumption of granting licenses.
Any other mode of operation would be highly detrimental to its own industry.
This represents a bigger step than what many analysts were expecting from Japan. It will really hinderChina’sability to manufacture chips at non-leading edge nodes below 20nm.
This was the weakness of the new measures announced by the US last October, as at 20nm-10nm, it is possible to build a fab using non-US equipment.
However, when you add Japan into the mix, this then becomes virtually impossible and there will be no point in buying machines from ASML, meaning that the combination of the US and Japan represents an effective embargo.
This means thatChinawill now have to rely on domestically produced capital equipment which is going to be a real problem.
Although Huawei claims to be able to manufacture at 14nm, it did not say whether it could do so at volume with good yields which is what is required for Huawei to be able to use these chips economically in its products.
The net result is that Japan’s actions make the US actions far more effective and deal a blow to any workarounds that the Chinese may have found to build fabs without US equipment.
This reinforces the view that China is in real trouble when it comes tosemiconductors, which will hamper and slow its rise as a technological superpower.
That being said, there will be a likely bounce in the Chinese economy in H2 2023, although the lack of action on stimulating the economy remains a cause for concern.
If it comes, the rising tide will lift all boats and especially the beleaguered technology sector.
Micron: A display of weakness
China’s review of Micron on “national security” grounds is a tit-for-tat retaliation that shows just how weak its hand is in the game ofsemiconductorbrinksmanship.
The Cyberspace Administration of China (CAC) has said it would review Micron’s imports into China to ensure that using its products would not compromise the security of its information infrastructure.
It seems that this move has nothing to do with national security but is instead an attempt to damage US interests in China without compromising its own technological ambitions.
If China was really concerned about “national security”, it would be reviewing many other companies. But a blockade on the import of products from many of these companies would hurt China just as much as the US, if not more.
In the case of Micron, China can still buy the same products from South Korea or Japan with no ill effects on its development of technology.
This is precisely why Micron has been targeted. It is unlikely that other companies that export chips to China will be targeted as it would do more harm than good.
The move is also unlikely to give China much in the way of negotiating leverage and so this will prove to be an isolated incident that is pretty irrelevant to the overall technological and ideological struggle.
(This is a version of a blog that first appeared on Radio Free Mobile. All views expressed are Richard’s own.)
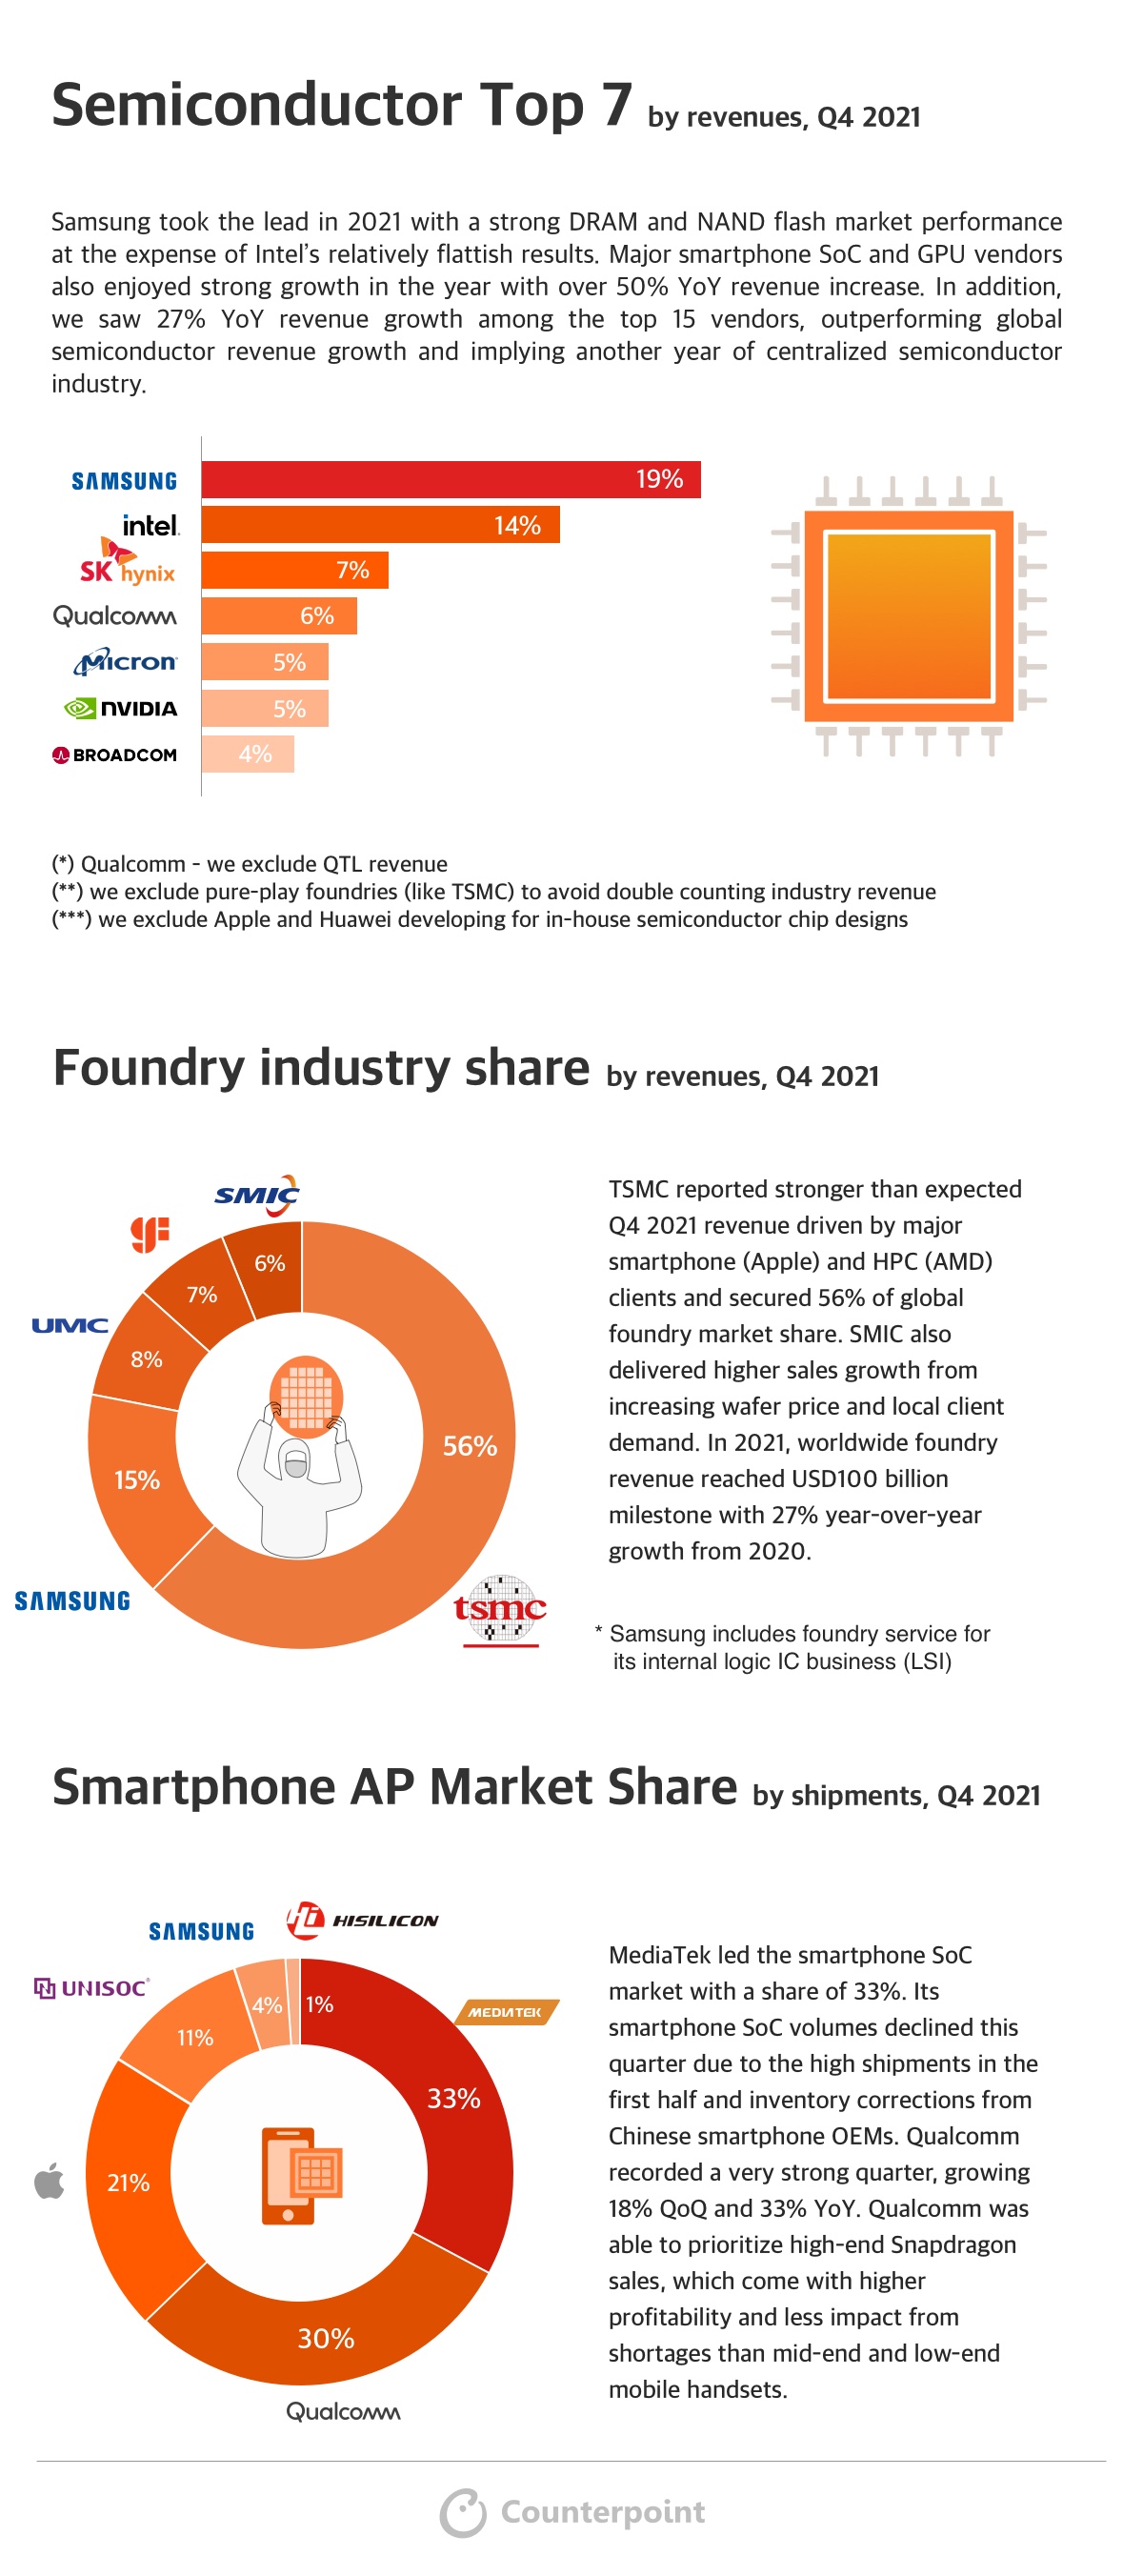
三星带头与强大的DRAM在2021年nd NAND flash market performance at the expense of Intel’s relatively flattish results. Major smartphone SoC and GPU vendors also enjoyed strong growth in the year with over 50% YoY revenue increase. In addition, we saw 27% YoY revenue growth among the top 15 vendors, outperforming global semiconductor revenue growth and implying another year of centralized semiconductor industry.
Foundry Industry Shareby revenues, Q4 2021
TSMC reported stronger than expected Q4 2021 revenue driven by major smartphone (Apple) and HPC (AMD) clients and secured 56% of global foundry market share. SMIC also delivered higher sales growth from increasing wafer price and local client demand. In 2021, worldwide foundry revenue reached USD100 billion milestone with 27% year-over-year growth from 2020.
Smartphone AP Market Shareby shipments, Q4 2021
MediaTek led the smartphone SoC market with a share of 33%. Its smartphone SoC volumes declined this quarter due to the high shipments in the first half and inventory corrections from Chinese smartphone OEMs. Qualcomm recorded a very strong quarter, growing 18% QoQ and 33% YoY. Qualcomm was able to prioritize high-end Snapdragon sales, which come with higher profitability and less impact from shortages than mid-end and low-end mobile handsets.
Use the button below to download the high resolution PDF of the infographic:
London, Hong Kong, Boston, Toronto, New Delhi, Beijing, Taipei, Seoul – January 28, 2022
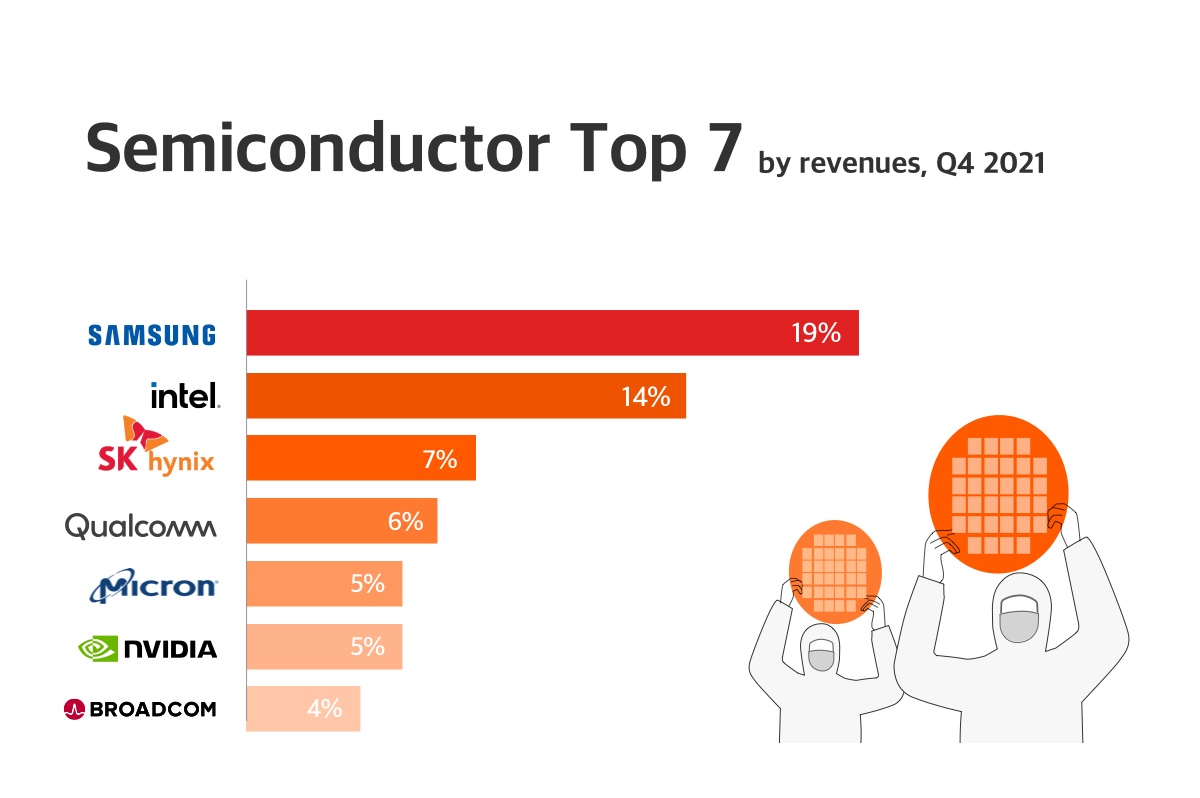
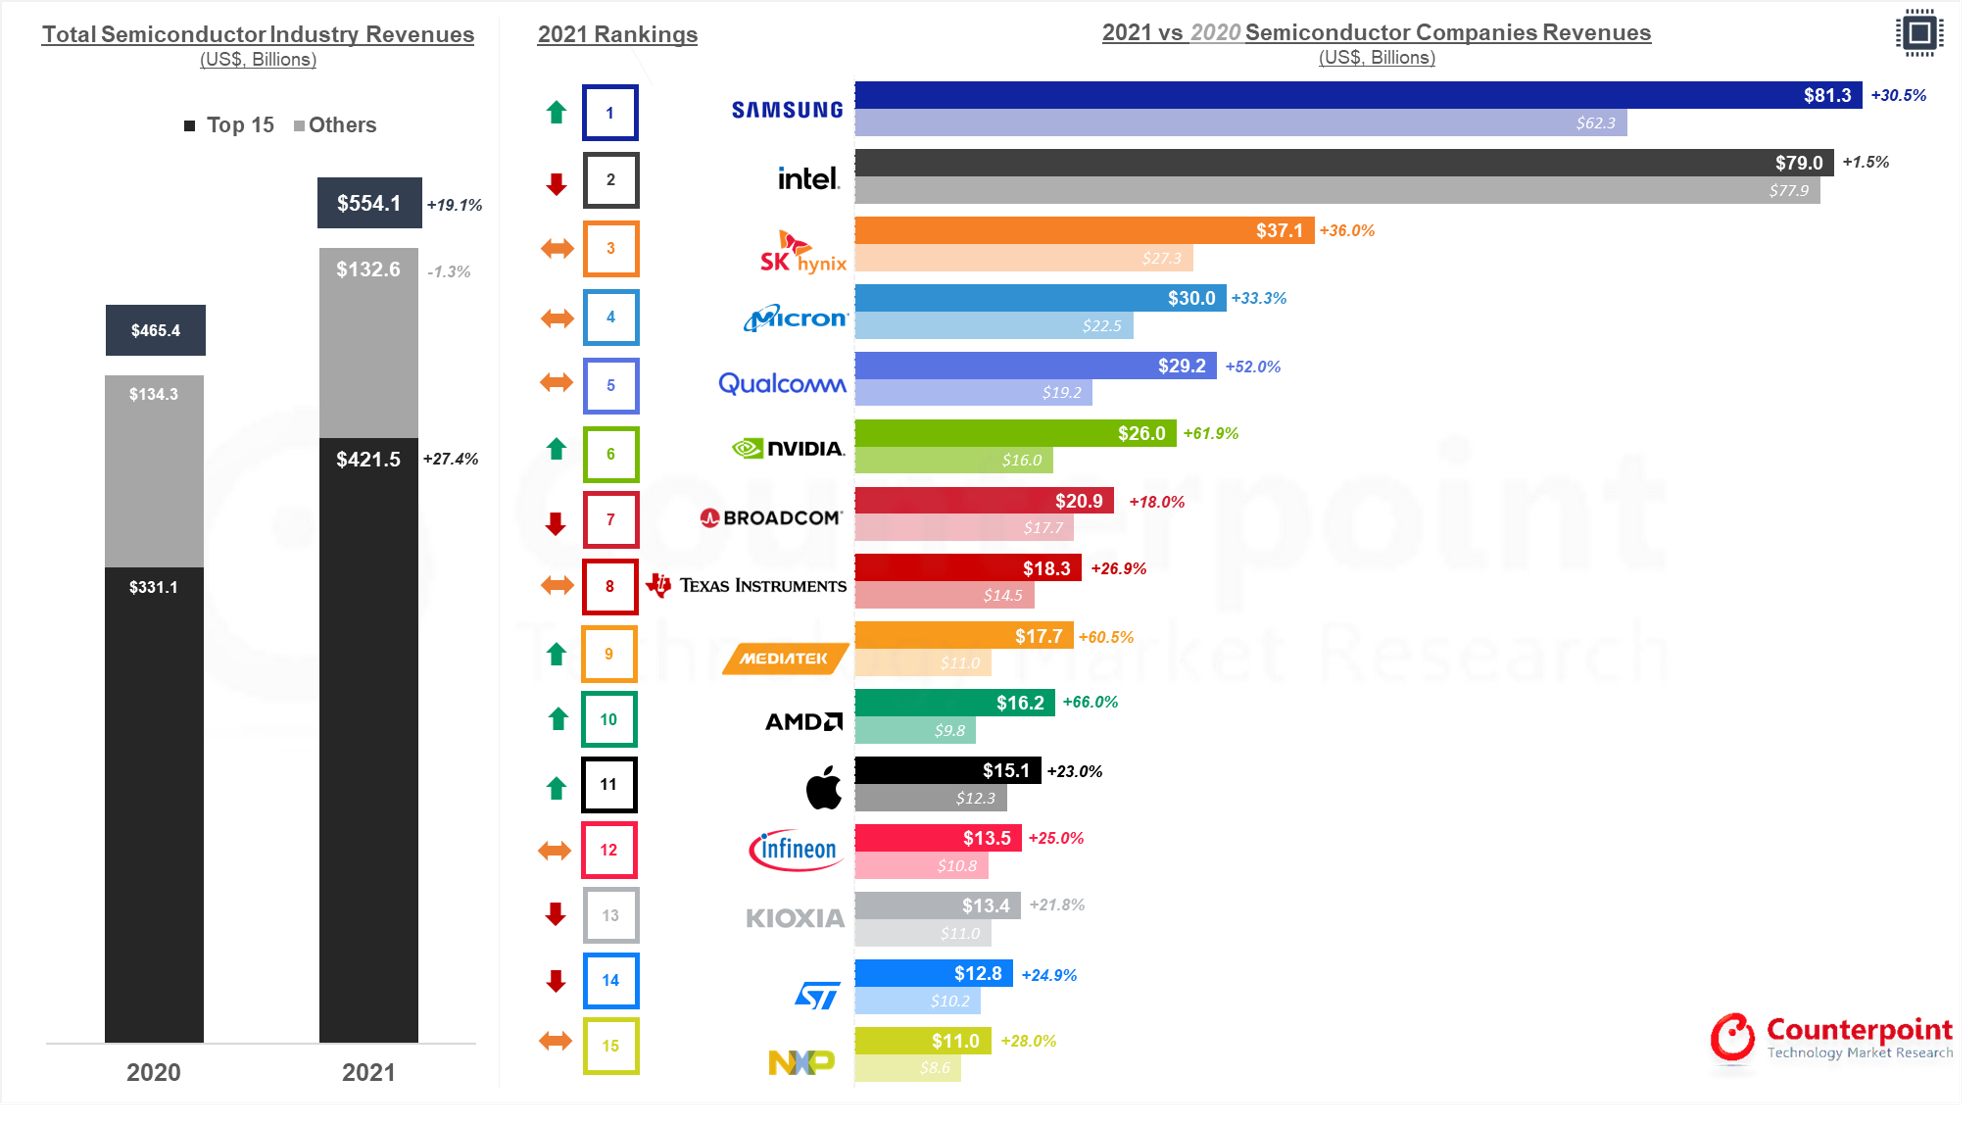
Semiconductor industry went through significant structural changes in 2021 after entity lists were announced by both China and the US. The overall 2021 semiconductor revenue rankings also varied from the previous year.Samsungtook the first position from Intel thanks to its solid growth momentum in both logic IC and memory segments. Memory vendors continued to lead the industry with SK Hynix and Micron taking the third and fourth positions, followed by IC design vendors, including Qualcomm and NVIDIA.
During 2021, many top-tier semiconductor companies reiterated material changes happening in the industry, such as semi content growth, higher inventory level and longer chip lead time due to globalcomponent shortagesas well as logistical issues. The year saw 19% YoY revenue growth with the largest contribution coming from the memory and IC design sectors.
Semiconductor Industry Top Players Revenues & Rankings – 2021
三星带头与强大的DRAM在2021年nd NAND flash market performance at the expense of Intel’s relatively flattish results. Majorsmartphone SoCand GPU vendors also enjoyed strong growth in the year with over 50% YoY revenue increase. In addition, we saw 27% YoY revenue growth among the top 15 vendors, outperforming global semiconductor revenue growth and implying another year of centralized semiconductor industry.
In general, we believe supply constraints will likely persist before H2 2022, though our checks suggest some amount of component shortage easing. Looking ahead, foundries are adding new capacities in 2023 and most of them hold optimistic views on their partnerships and utilization rates even if supply and demand normalize in the foreseeable future. High performance computing, metaverse (AR/VR/XR), 5G and automotive remain key semi content growth drivers for the industry.
Disclaimer: This ranking consists of chip companies. Foundry revenue is not included to avoid double counting.
Background
市场研究是一个世界人口对位技术l research firm specializing in products in the TMT (technology, media and telecom) industry. It services major technology and financial firms with a mix of monthly reports, customized projects and detailed analyses of the mobile and technology markets. Its key analysts are seasoned experts in the high-tech industry.
London, Hong Kong, Boston, Toronto, New Delhi, Beijing, Taipei, Seoul – Jun 25, 2021
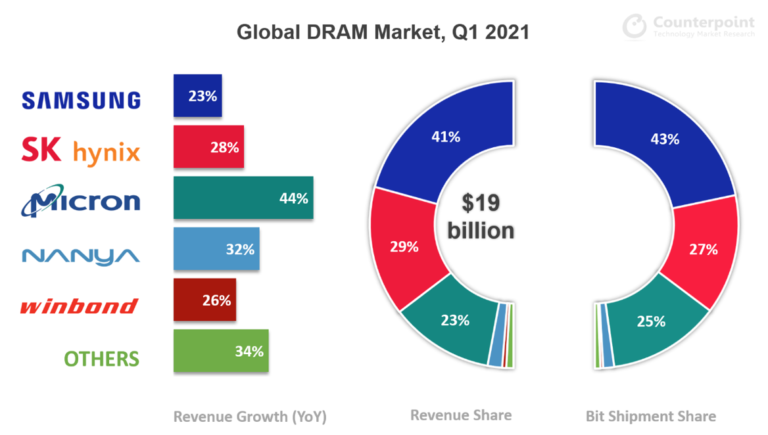
Global DRAM revenues rose to $19 billion in Q1 2021, increasing by a solid 30% YoY and 9% QoQ.Distance educationand work from home (WFH) continued propelling a substantial demand for smartphone and laptop DRAM, resulting in a 6% growth in bit shipment and a 3% rise in ASP over the previous quarter.
Associate Director Brady Wangsaid the Chinese handset makers stepped up theirsmartphoneshipments in the first quarter, intending to gain shares from the beleaguered Huawei. In addition, the high-density LPDDR4x memory prices softened in H2 2020, increasingsmartphone DRAM contentand making 6GB the minimum standard for mid- to high-end smartphones since 2021. As a result, the average DRAM capacity in smartphones clocked at 5.3GB in Q1 2021, rising impressively by around 21% YoY and 7% QoQ. Similarly, servers experienced recovery in demand, and the adoption of a new data-center CPU bumped up server content per box. Therefore, the server segment’s DRAM demand rose as well.
According toWang, DRAM is already an oligopolistic market with an Herfindahl-Hirschman Index (HHI) of 3,138. A significant capacity expansion by any player will soon turn around market status and reduce the overall profitability. Therefore, this year, all three major players will spend most of their resources in migrating to advanced nodes, a process that is bound to reduce production capacity. In addition, transportation and componentshortageconcerns will force device vendors to place orders earlier than usual. When coupled with the growing demand for personal computers, games and servers, these factors signal the possibility of the DRAM market turning to a shortage this year. The smartphone market is recovering at present, but its cost sensitivity means that a DRAM price spike may put the brakes on smartphone DRAM content growth.
Competitive Landscape
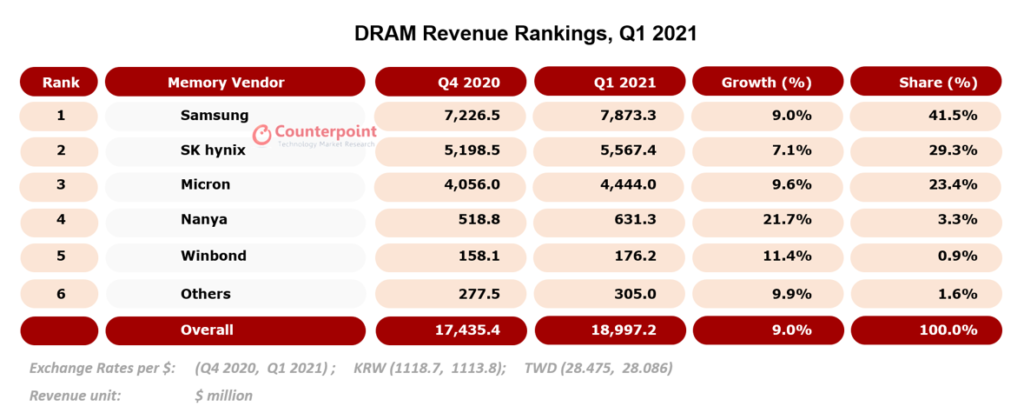
The DRAM industry is dominated by three major players that collectively account for about 95% of the market’s bit shipments and revenue.
Samsung Electronics
With $7.9 billion in revenue, Samsung led the DRAM market in Q1 2021. The South Korean semiconductor giant continued commanding over two-fifths of the DRAM market revenue, overshadowing its nearest competitor by over 41%. Samsung’s DRAM bit shipment growth came from actively responding to the (i) 5G-related surge in smartphone demand, (ii) rising server demands for data centers and (iii) rise of home entertainment culture that increased memory content in TVs and STBs to support 4K UHD content and streaming.
Research Associate Siddharth Bhatlasees 1Z nm or 15 nm as Samsung’s most advanced mass-produced DRAM node from the technology perspective. The company’s plans include beginning mass production of 14 nm node in H2 2021. Samsung aims to differentiate its DRAM offerings using multi-layer EUV on its 14 nm node, building upon the single-layer EUV in its current 15 nm node.
SK hynix
Ranking second, SK hynix accounted for over 29% of the DRAM industry’s Q1 2021 revenues. Surpassing Micron by over 25%, its revenues rose by over 28% YoY in that period, in line with the industry’s overall growth. In addition, the company’s bit shipments rose 4% QoQ, thanks to its ability to actively cater to the surging demand for mobile and PC memory. By the year-end, SK hynix aims to (i) ramp up the production of its 1Z nm DRAM and (ii) complete development and begin mass production of its 1α-EUV node.
Micron Technology
Micron achieved a 44% YoY jump in its DRAM revenue in Q1 2021, continuing to grow fastest among the big three since the preceding two quarters. Micron was the first among the big three to begin mass production of 1α DRAM, accounting for one-fourth of the industry’s DRAM revenue. However, Micron’s 1α node is based on DUV, an older technology that may face severe cost competition once the EUV-based 1α DRAMs reach the mass market.
Feel free to contact us atpress(at)www.arena-ruc.comfor questions regarding our in-depth research and insights, or for press enquiries.
Background:
市场研究是一个世界人口对位技术l research firm specializing in products in the TMT (technology, media and telecom) industry. It services major technology and financial firms with a mix of monthly reports, customized projects and detailed analyses of the mobile and technology markets. Its key analysts are seasoned experts in the high-tech industry.
The share of eMCP in mobile memory unit shipments has declined for the fourth consecutive quarter in Q2 2019 to 58.9% from 65.4% in Q2 2018, according to the latest research from Counterpoint. On the other hand, shipments ofUFS grew rapidlyat a rate of 44.3% quarter-on-quarter (QoQ) in Q2 2019, as almost all Android smartphones, priced around US$400 use UFS memory units.
We expect the growth momentum in UFS shipments to continue in the coming quarters as it has a higher read/write speed and input/output operations per second (IOPS), especially for applications that have to handle a large amount of data such as video and images. We expect UFS’ share in mobile memory unit shipments will increase to 35.5% in 2023 from 10.3% in 2018. The technology will be particularly dominant in the interface of high-end smartphones, especially due to the strongdemand for 5G smartphones.Such a scenario is advantageous for WD (Western Digital) and TMC (Toshiba Memory Corporation) which have cutting-edge NAND flash technology but no DRAM production facility.
Exhibit 1: Quarterly Mobile Memory Unit Shipment, 1Q18 – 2Q19
Source: Counterpoint Research Sep 2019
Since 2014, eMCP has become the mainstream of mobile phone memory interface. However, the shares of WD and TMC in smartphones has remained low because they do not have their own DRAM production facility. But eMCP’s time is rapidly coming to an end with a demand forhigher speed memory and larger storage capacity.在2019年第二季度,平均容量UFS是170。1GB, which is three times higher than eMCP’s 51GB and even higher than iOS’ 104.2GB in the same quarter.
Exhibit 2: Quarterly Mobile Memory Average Density, 1Q18 – 2Q19
Source: Counterpoint Research Sep 2019
Further, in Q2 2019, the overall UFS bit shipment was approximately 10,073 millions of GB, which was also higher than the eMCP’s 9,273 millions of GB. In order to take the opportunity to increase NAND flash sales, WD and TMC should work with smartphone OEMs to provide customized UFS mobile memory. They should also work with third-party NAND controller companies to provide UFS at a reasonable price and corresponding performance.
With the rapid adoption of uMCP, failing to push UFS aggressively do so will mean WD and TMC will hand over the advantage to companies like Samsung, SK Hynix, and Micron, who have both DRAM and NAND capacity.
Our data reveals that though the share of uMCP in Q2 2019 remained low compared to eMMC or UFS, its quarter-on-quarter (QoQ) and year-on-year (YoY) growth was at a record high of 91.5% and 1,882%, respectively as the base was low. Although the growth rates might normalize, we expect the demand for uMCPs to keep increasing.
For the mid-end smartphone market, we expect uMCP to become the mainstay. It is a combination of UFS controllers and low power DRAM, thus giving it the advantages of UFS’ fast speed and MCP’s small footprint. Therefore, uMCP is expected to replace the eMCP in the mid-end smartphone market and also eMMC in the high-end smartphones market.
Counterpoint will release its Q2 2019 quarterly tracker and forecast of mobile memory by interface and OEM early next week. In theQ1 2019, Counterpoint pointed out that that eMCP’s share in smartphones will continue to decline in response to demand for high-speed and high-bandwidth memory.
In order to access Counterpoint Technology Market Research Limited (Company or We hereafter) Web sites, you may be asked to complete a registration form. You are required to provide contact information which is used to enhance the user experience and determine whether you are a paid subscriber or not. Personal Information When you register on we ask you for personal information. We use this information to provide you with the best advice and highest-quality service as well as with offers that we think are relevant to you. We may also contact you regarding a Web site problem or other customer service-related issues. We do not sell, share or rent personal information about you collected on Company Web sites.
How to unsubscribe and Termination
You may request to terminate your account or unsubscribe to any email subscriptions or mailing lists at any time. In accessing and using this Website, User agrees to comply with all applicable laws and agrees not to take any action that would compromise the security or viability of this Website. The Company may terminate User’s access to this Website at any time for any reason. The terms hereunder regarding Accuracy of Information and Third Party Rights shall survive termination.
Website Content and Copyright
这个网站是对位的财产和我s protected by international copyright law and conventions. We grant users the right to access and use the Website, so long as such use is for internal information purposes, and User does not alter, copy, disseminate, redistribute or republish any content or feature of this Website. User acknowledges that access to and use of this Website is subject to these TERMS OF USE and any expanded access or use must be approved in writing by the Company. – Passwords are for user’s individual use – Passwords may not be shared with others – Users may not store documents in shared folders. – Users may not redistribute documents to non-users unless otherwise stated in their contract terms.
Changes or Updates to the Website
The Company reserves the right to change, update or discontinue any aspect of this Website at any time without notice. Your continued use of the Website after any such change constitutes your agreement to these TERMS OF USE, as modified. Accuracy of Information: While the information contained on this Website has been obtained from sources believed to be reliable, We disclaims all warranties as to the accuracy, completeness or adequacy of such information. User assumes sole responsibility for the use it makes of this Website to achieve his/her intended results.
第三方链接:这个网站可能包含链接to other third party websites, which are provided as additional resources for the convenience of Users. We do not endorse, sponsor or accept any responsibility for these third party websites, User agrees to direct any concerns relating to these third party websites to the relevant website administrator.
Cookies and Tracking
We may monitor how you use our Web sites. It is used solely for purposes of enabling us to provide you with a personalized Web site experience. This data may also be used in the aggregate, to identify appropriate product offerings and subscription plans. Cookies may be set in order to identify you and determine your access privileges. Cookies are simply identifiers. You have the ability to delete cookie files from your hard disk drive.

 While flawed, the CHIPS Act is a major stepping stone to creating secure, resilient supply chains that will insulate the country from many outside shocks. This is a step in the right direction, but more must be done if the country wants to win the semiconductor manufacturing marathon and avoid fizzling out after the starting sprint.

 三星带头与强大的DRAM在2021年nd NAND flash market performance at the expense of Intel’s relatively flattish results. Major
 Competitive Landscape