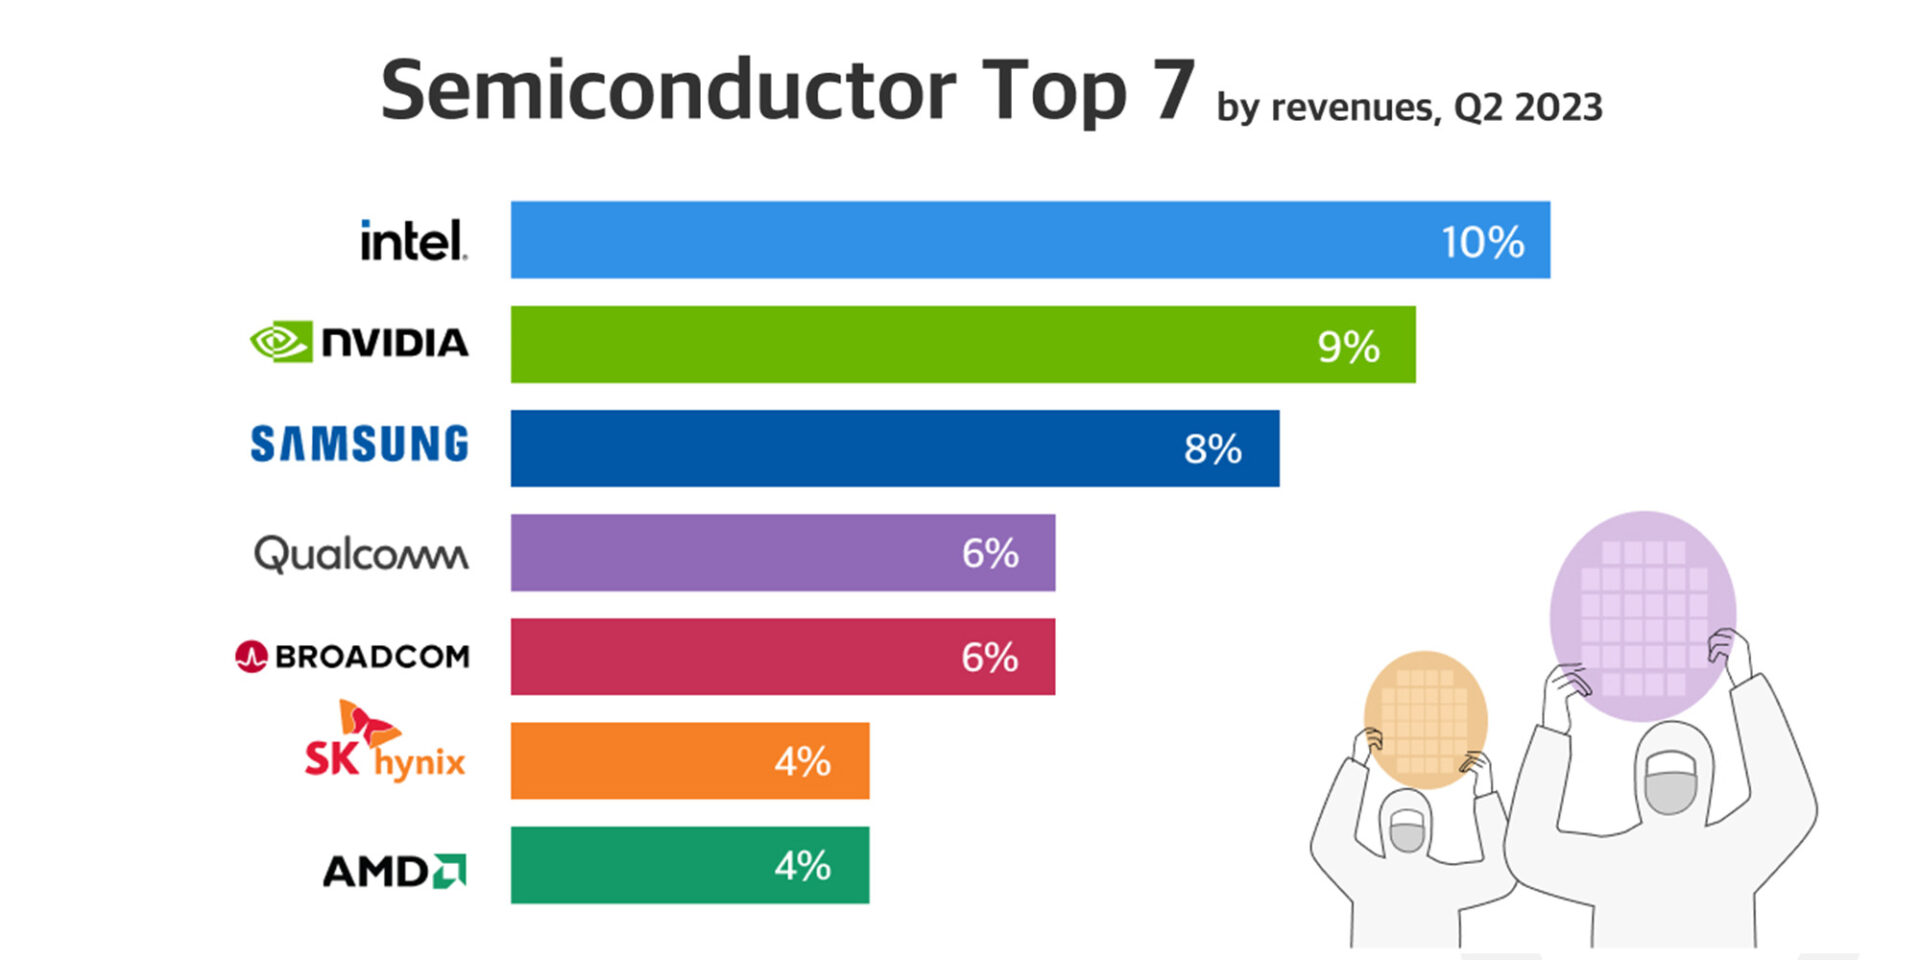
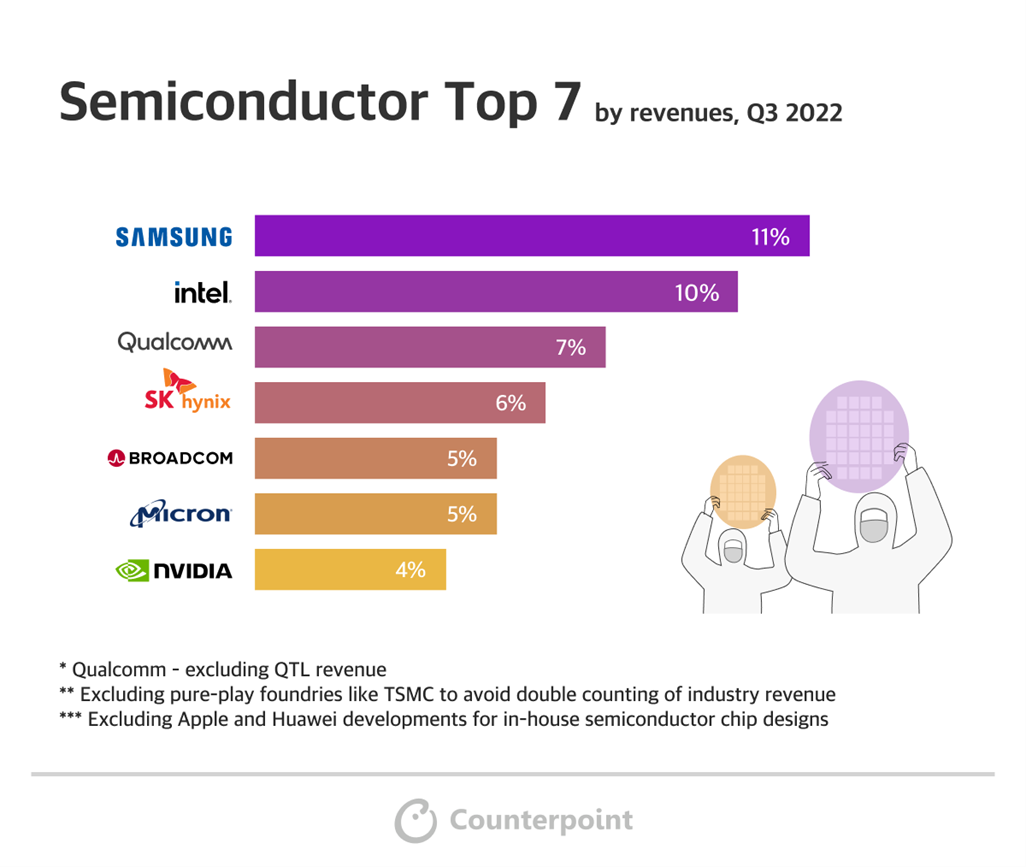
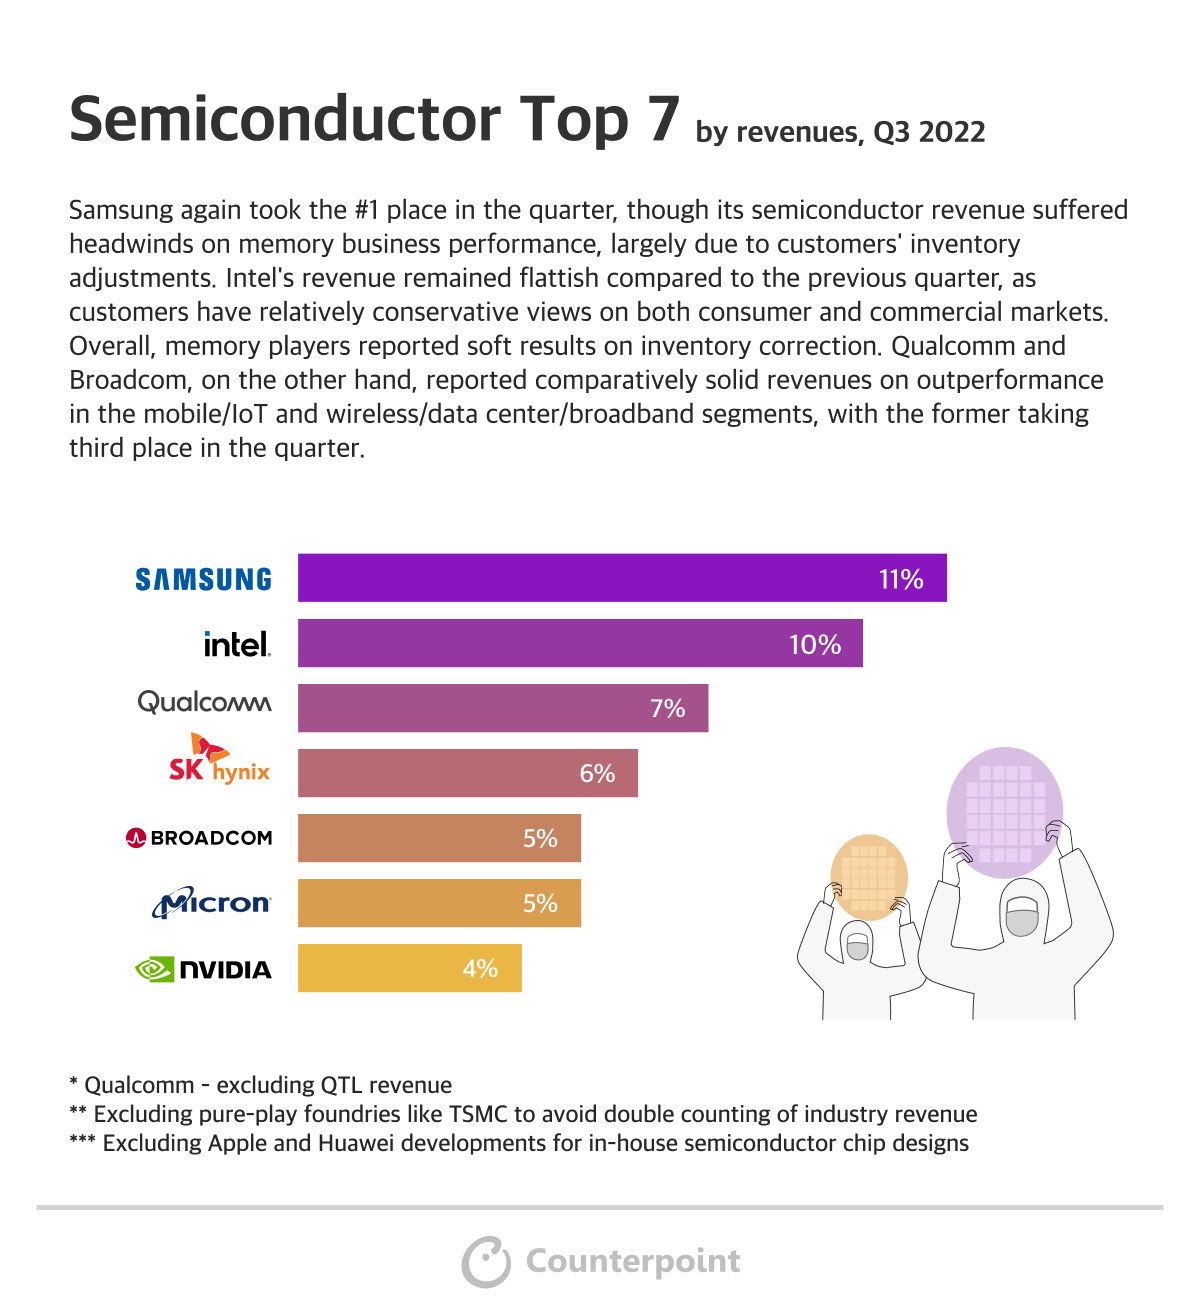
Infographic: Semiconductors Top 7 in Q2 2023
Intel maintained #1 place in Q2 2023 amid memory market slow down, which dragged down major memory players performance such as Samsung, SK Hynix and Micron. In addition, Nvidia took over the second place from Samsung due to the revenue booming on its data center business supported by strong AI server demand. Nvidia expects to see another wave of revenue growth in the upcoming quarter which could make its revenue expand again. Qualcomm’s revenue was capped by looming handset revenue and thus ranked #4 in the quarter. Broadcom and AMD’s revenues were relative resilient amid demand uncertainty.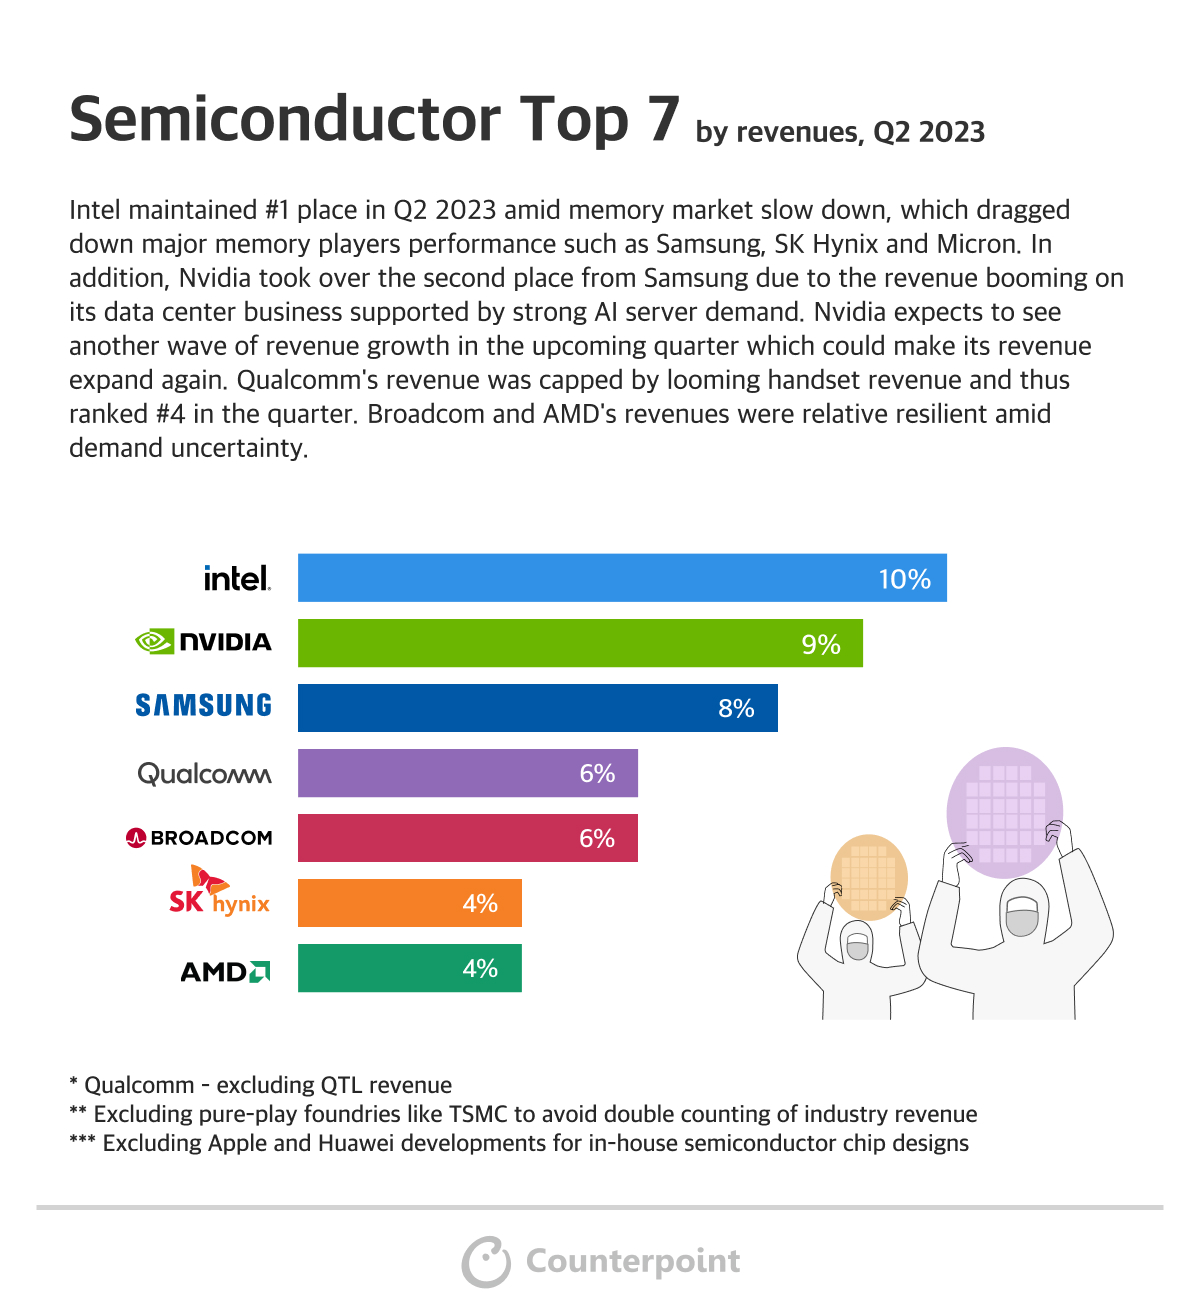
Use the button below to download the high resolution PDF of the infographic:
Infographic: Global Smartphone AP Share in Q2 2023
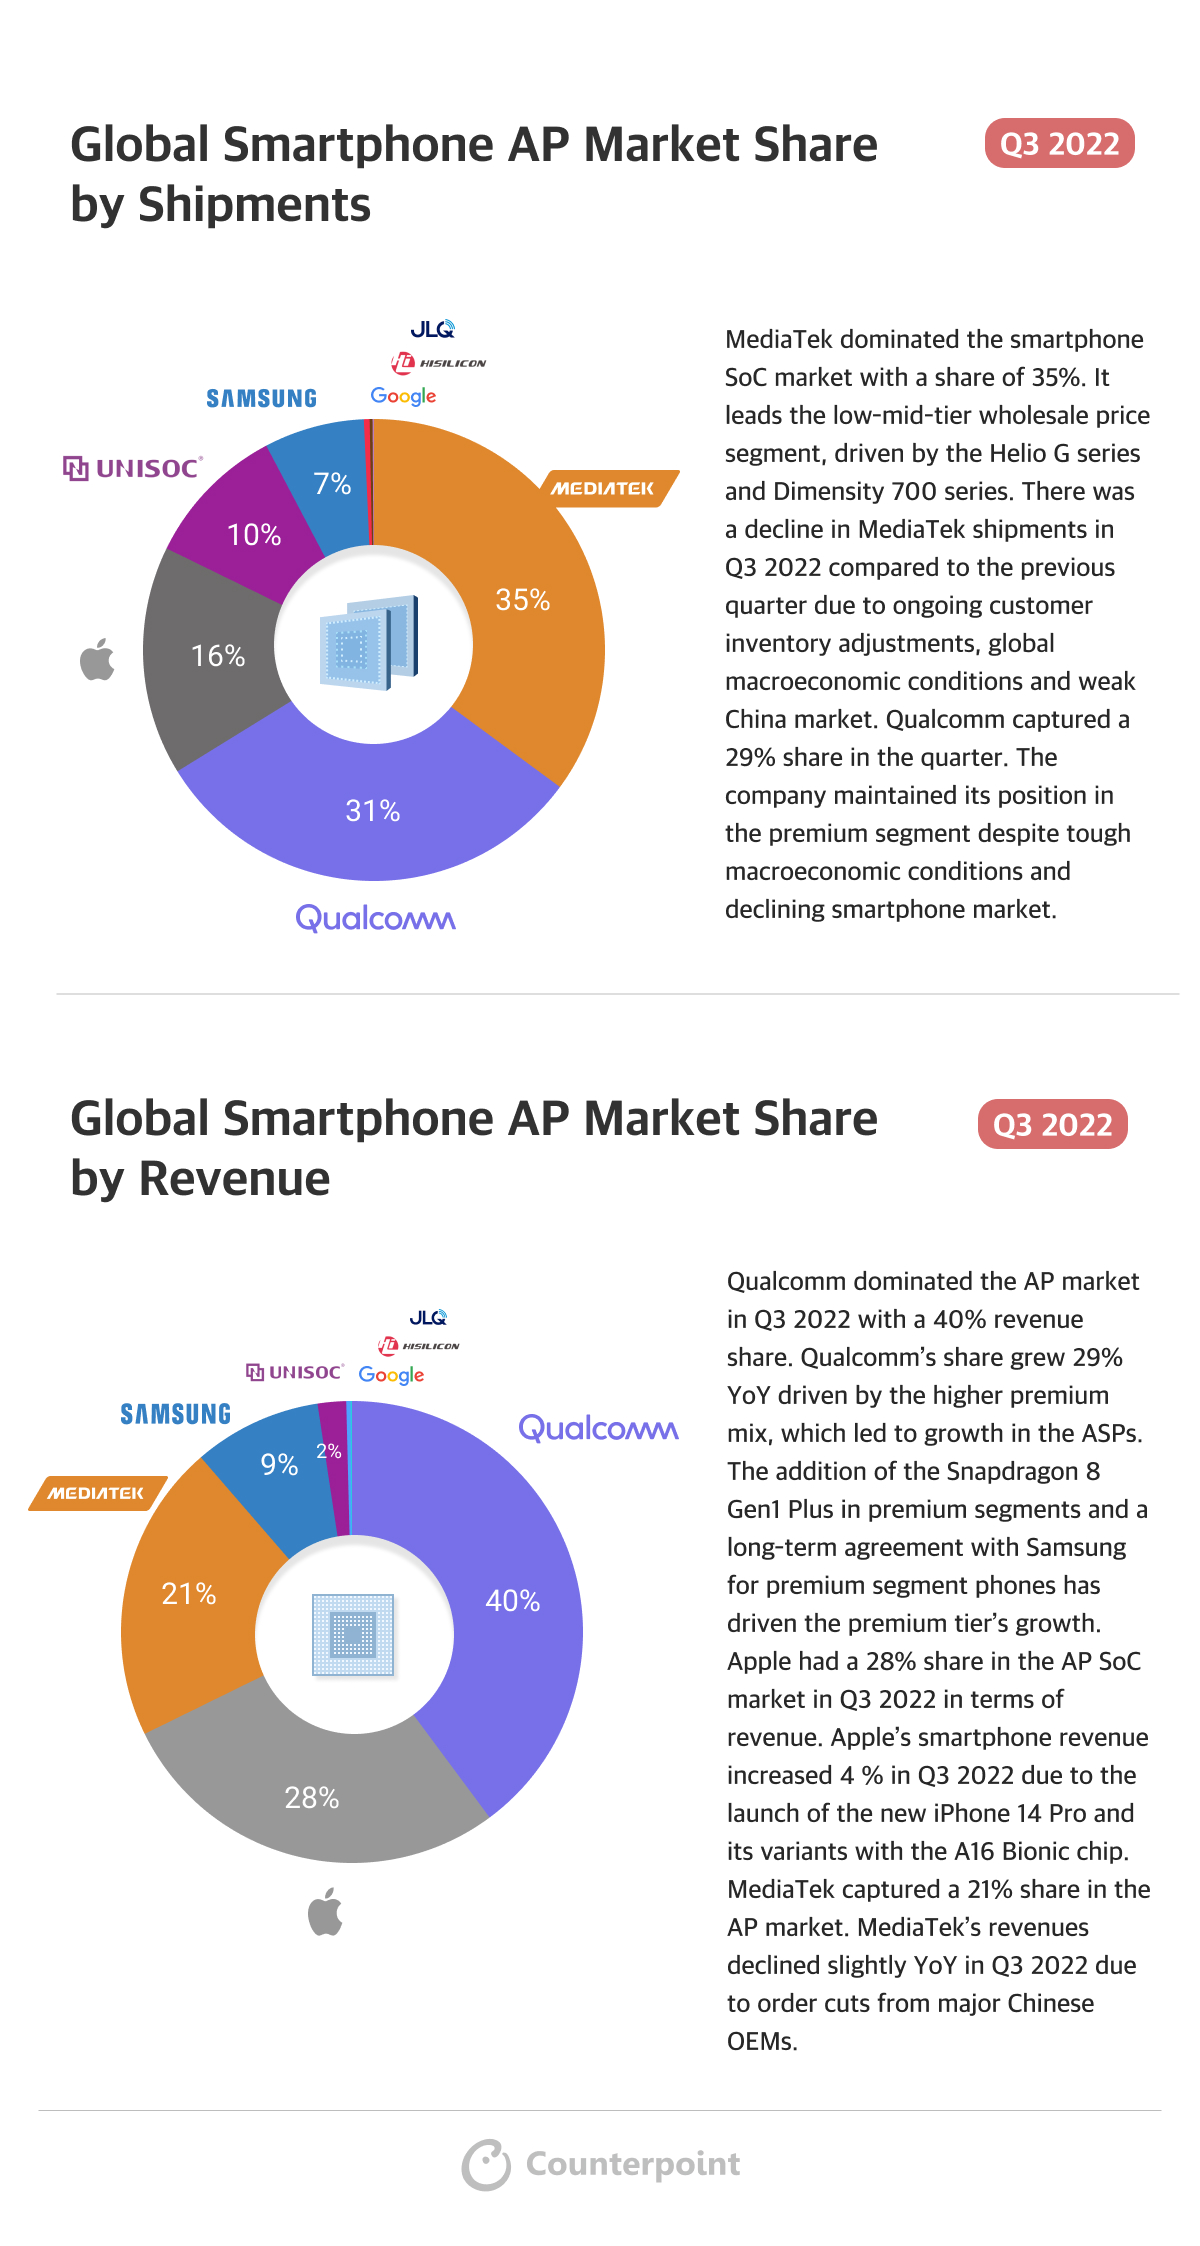
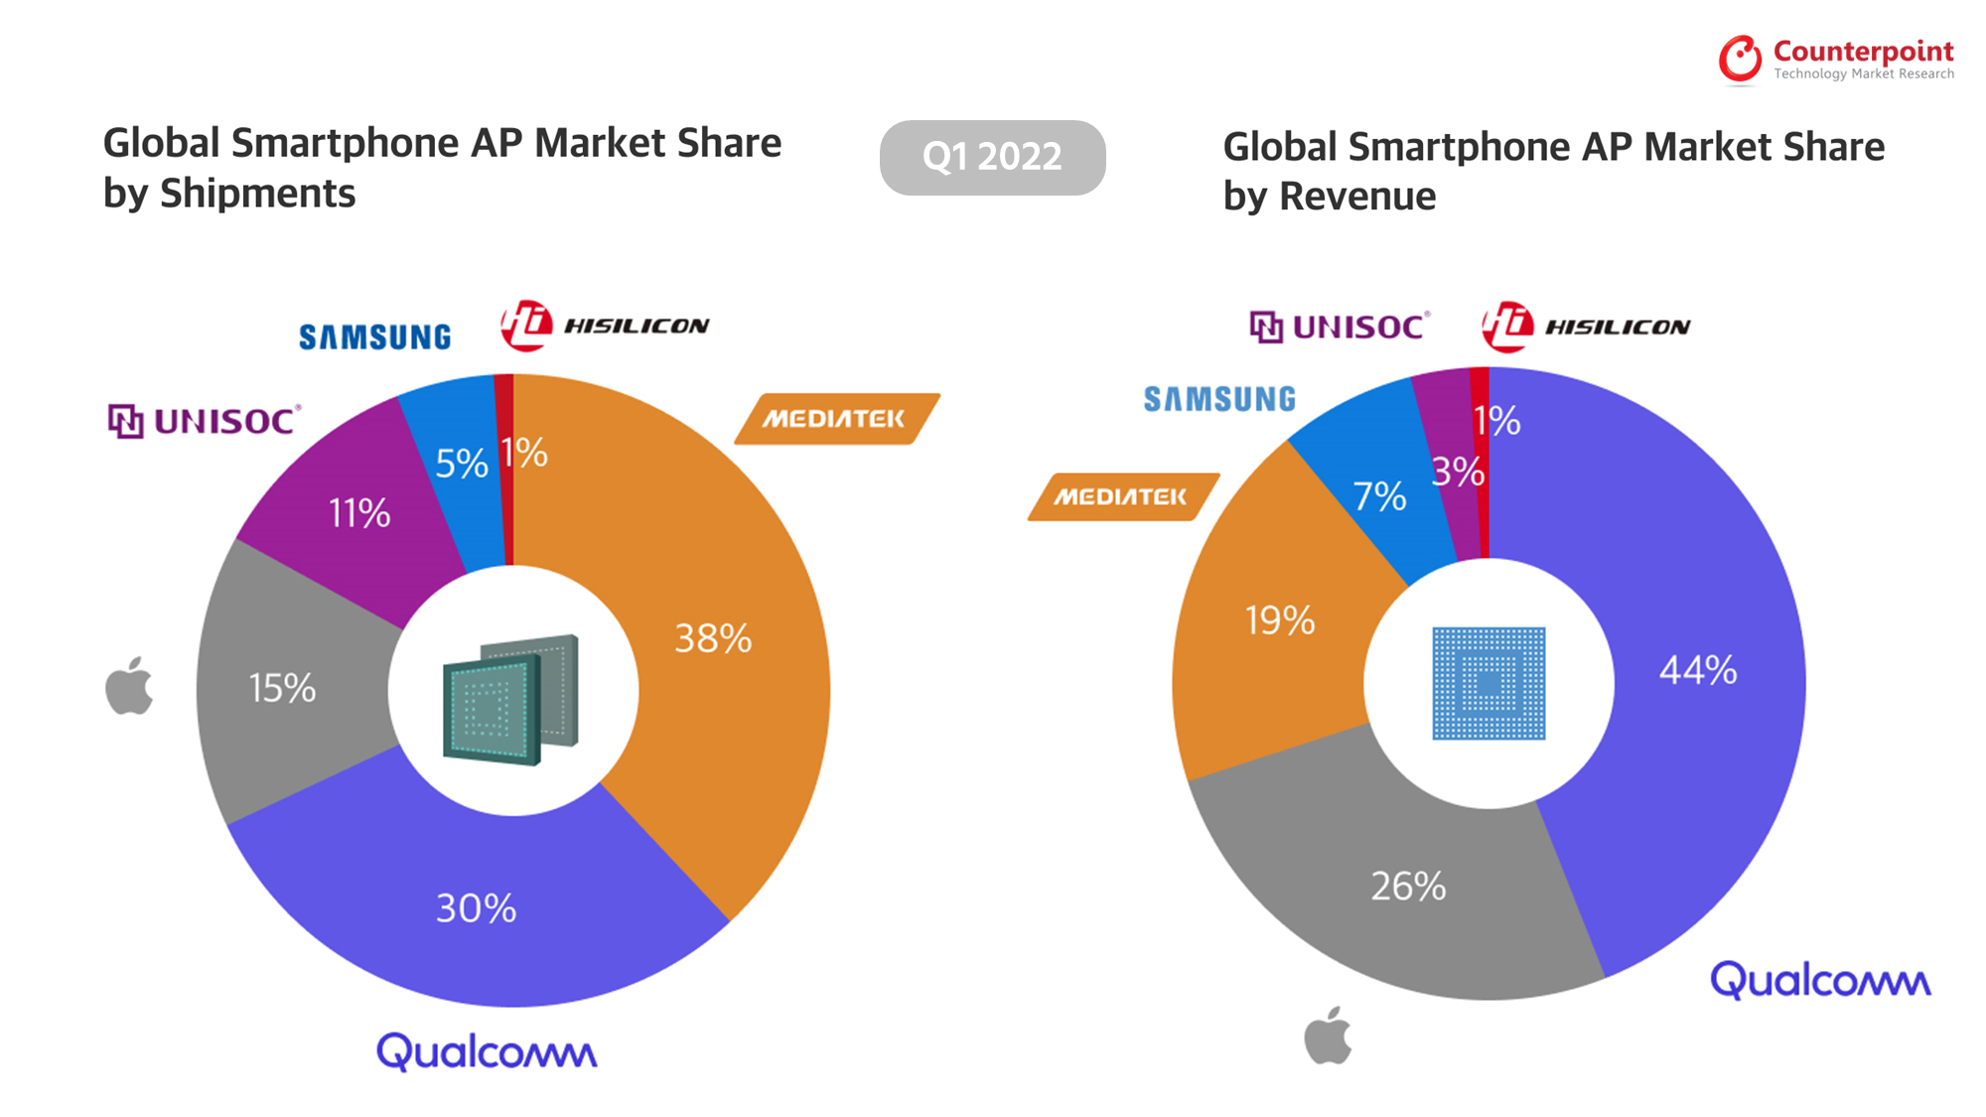
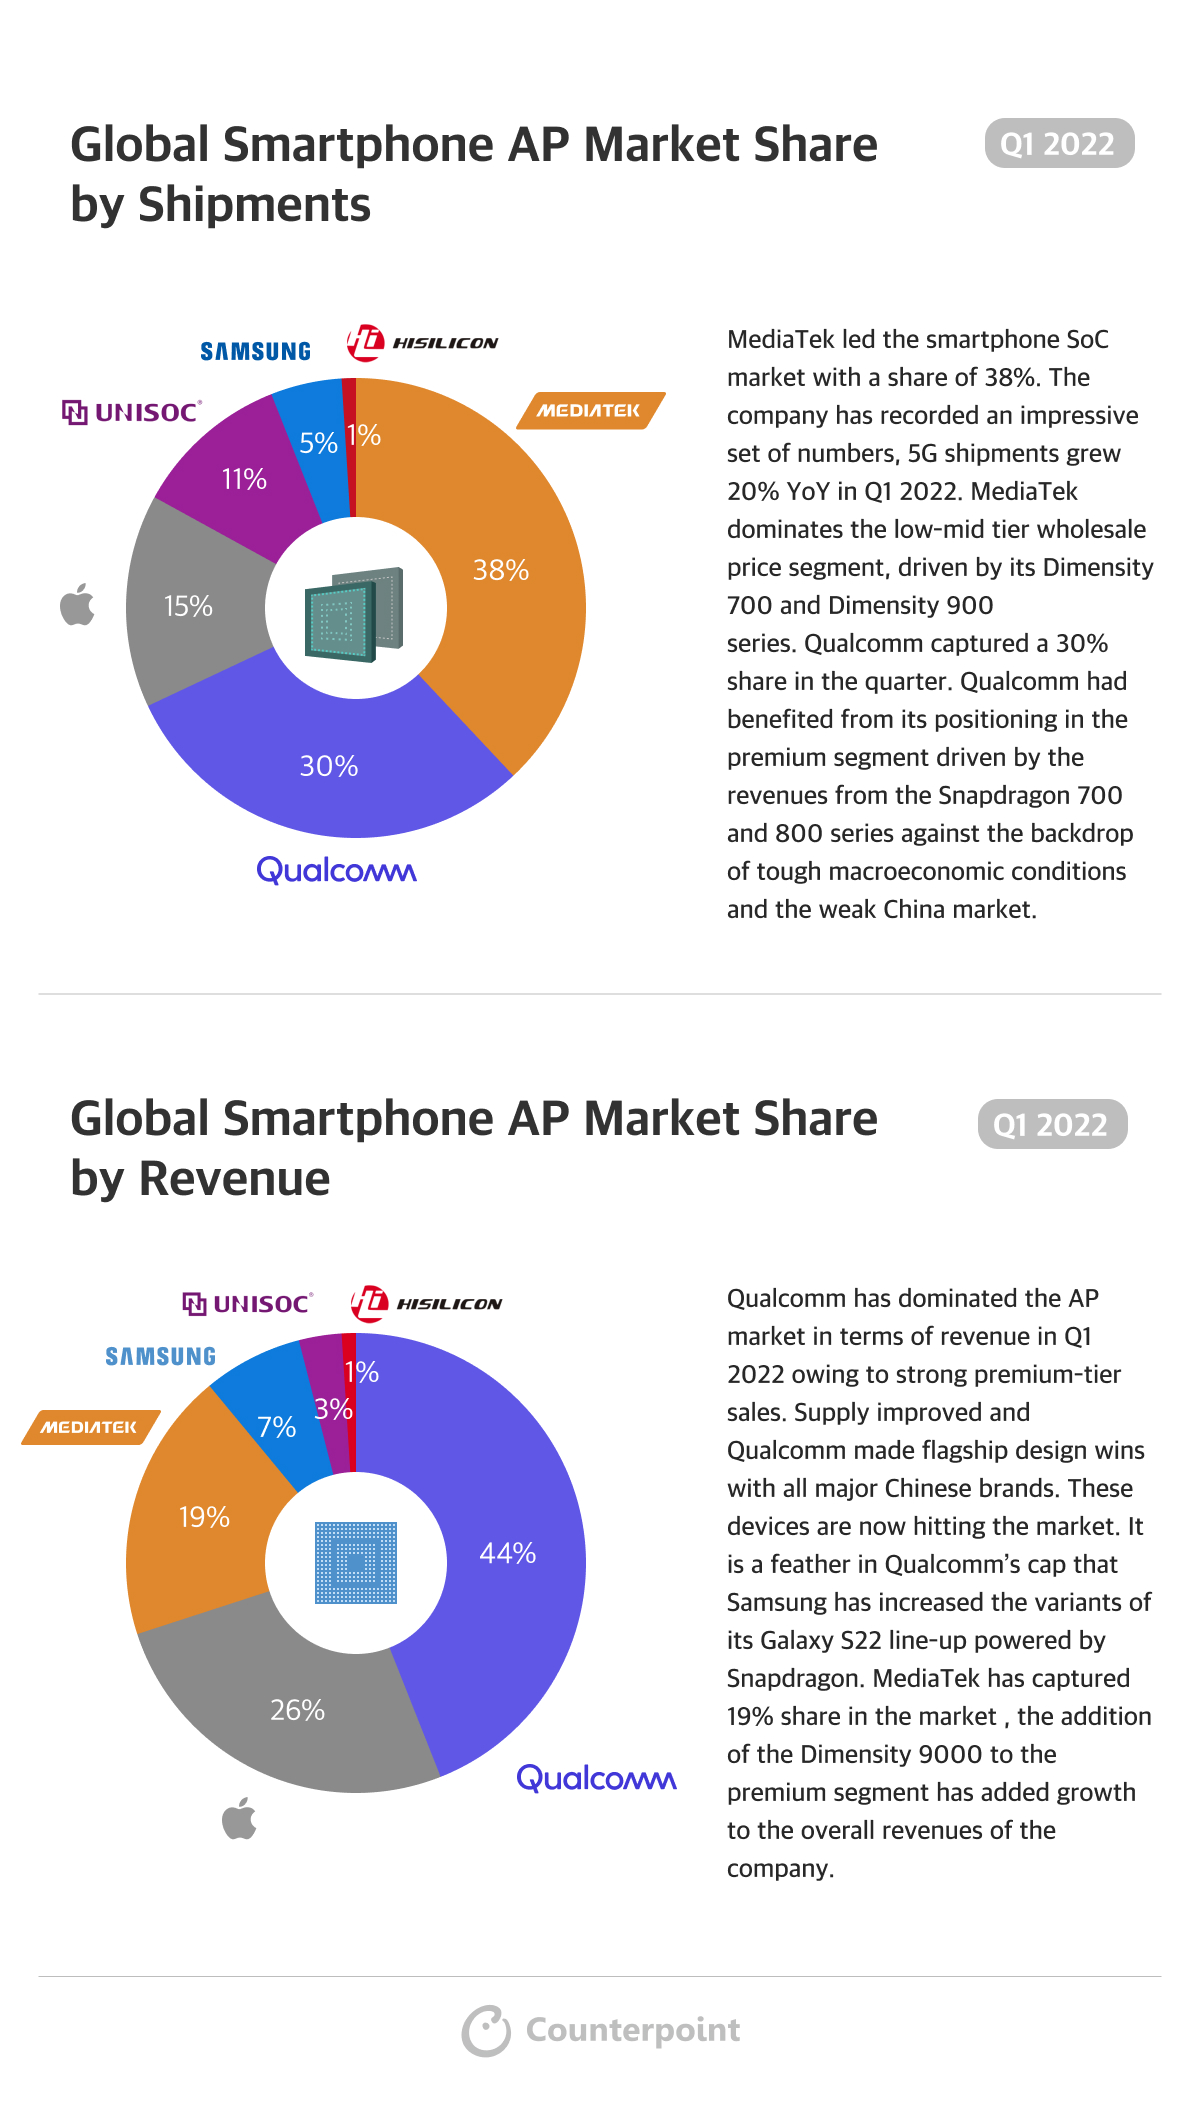
Global Smartphone AP Market Share by Shipments
MediaTek dominated the smartphone SoC market with a share of 30% in Q2 2023. MediaTek’s shipments slightly increased in Q2 2023 as the inventory levels came down and the competition is growing in the entry level 5G. New smartphone launches in the low and mid-end segments have increased the shipments in Dimensity 6000, Dimensity 7000 series. Qualcomm captured a 29% share in the quarter. Qualcomm shipments increased by 14.5% sequentially in Q2 2023 due to the high shipment for flagship chipset Snapdragon 8 Gen 2. Also, Key design wins for the Snapdragon 600 and 400 series have also contributed to the growth of Qualcomm’s shipment in Q2 2023.
美联社全球智能手机市场份额的收入
Qualcomm dominated the AP market in Q2 2023 with a 40% revenue share. This growth is coming from the premium segment due to the adoption of snapdragon 8 gen 2 in Samsung flagship smartphones and Chinese OEMs. The launch of the Samsung Flip and Fold series has also contributed to this growth. Apple had a 33% share in the AP SoC market in Q2 2023 in terms of revenue. Apple’s share declined by 24% QoQ due to seasonality. The iPhone Pro series is doing better. MediaTek captured the third position with a share of 16% in the total global smartphone AP/SoC revenues. MediaTek revenue remained flat in Q2 2023 due to the weak demand and slow China market.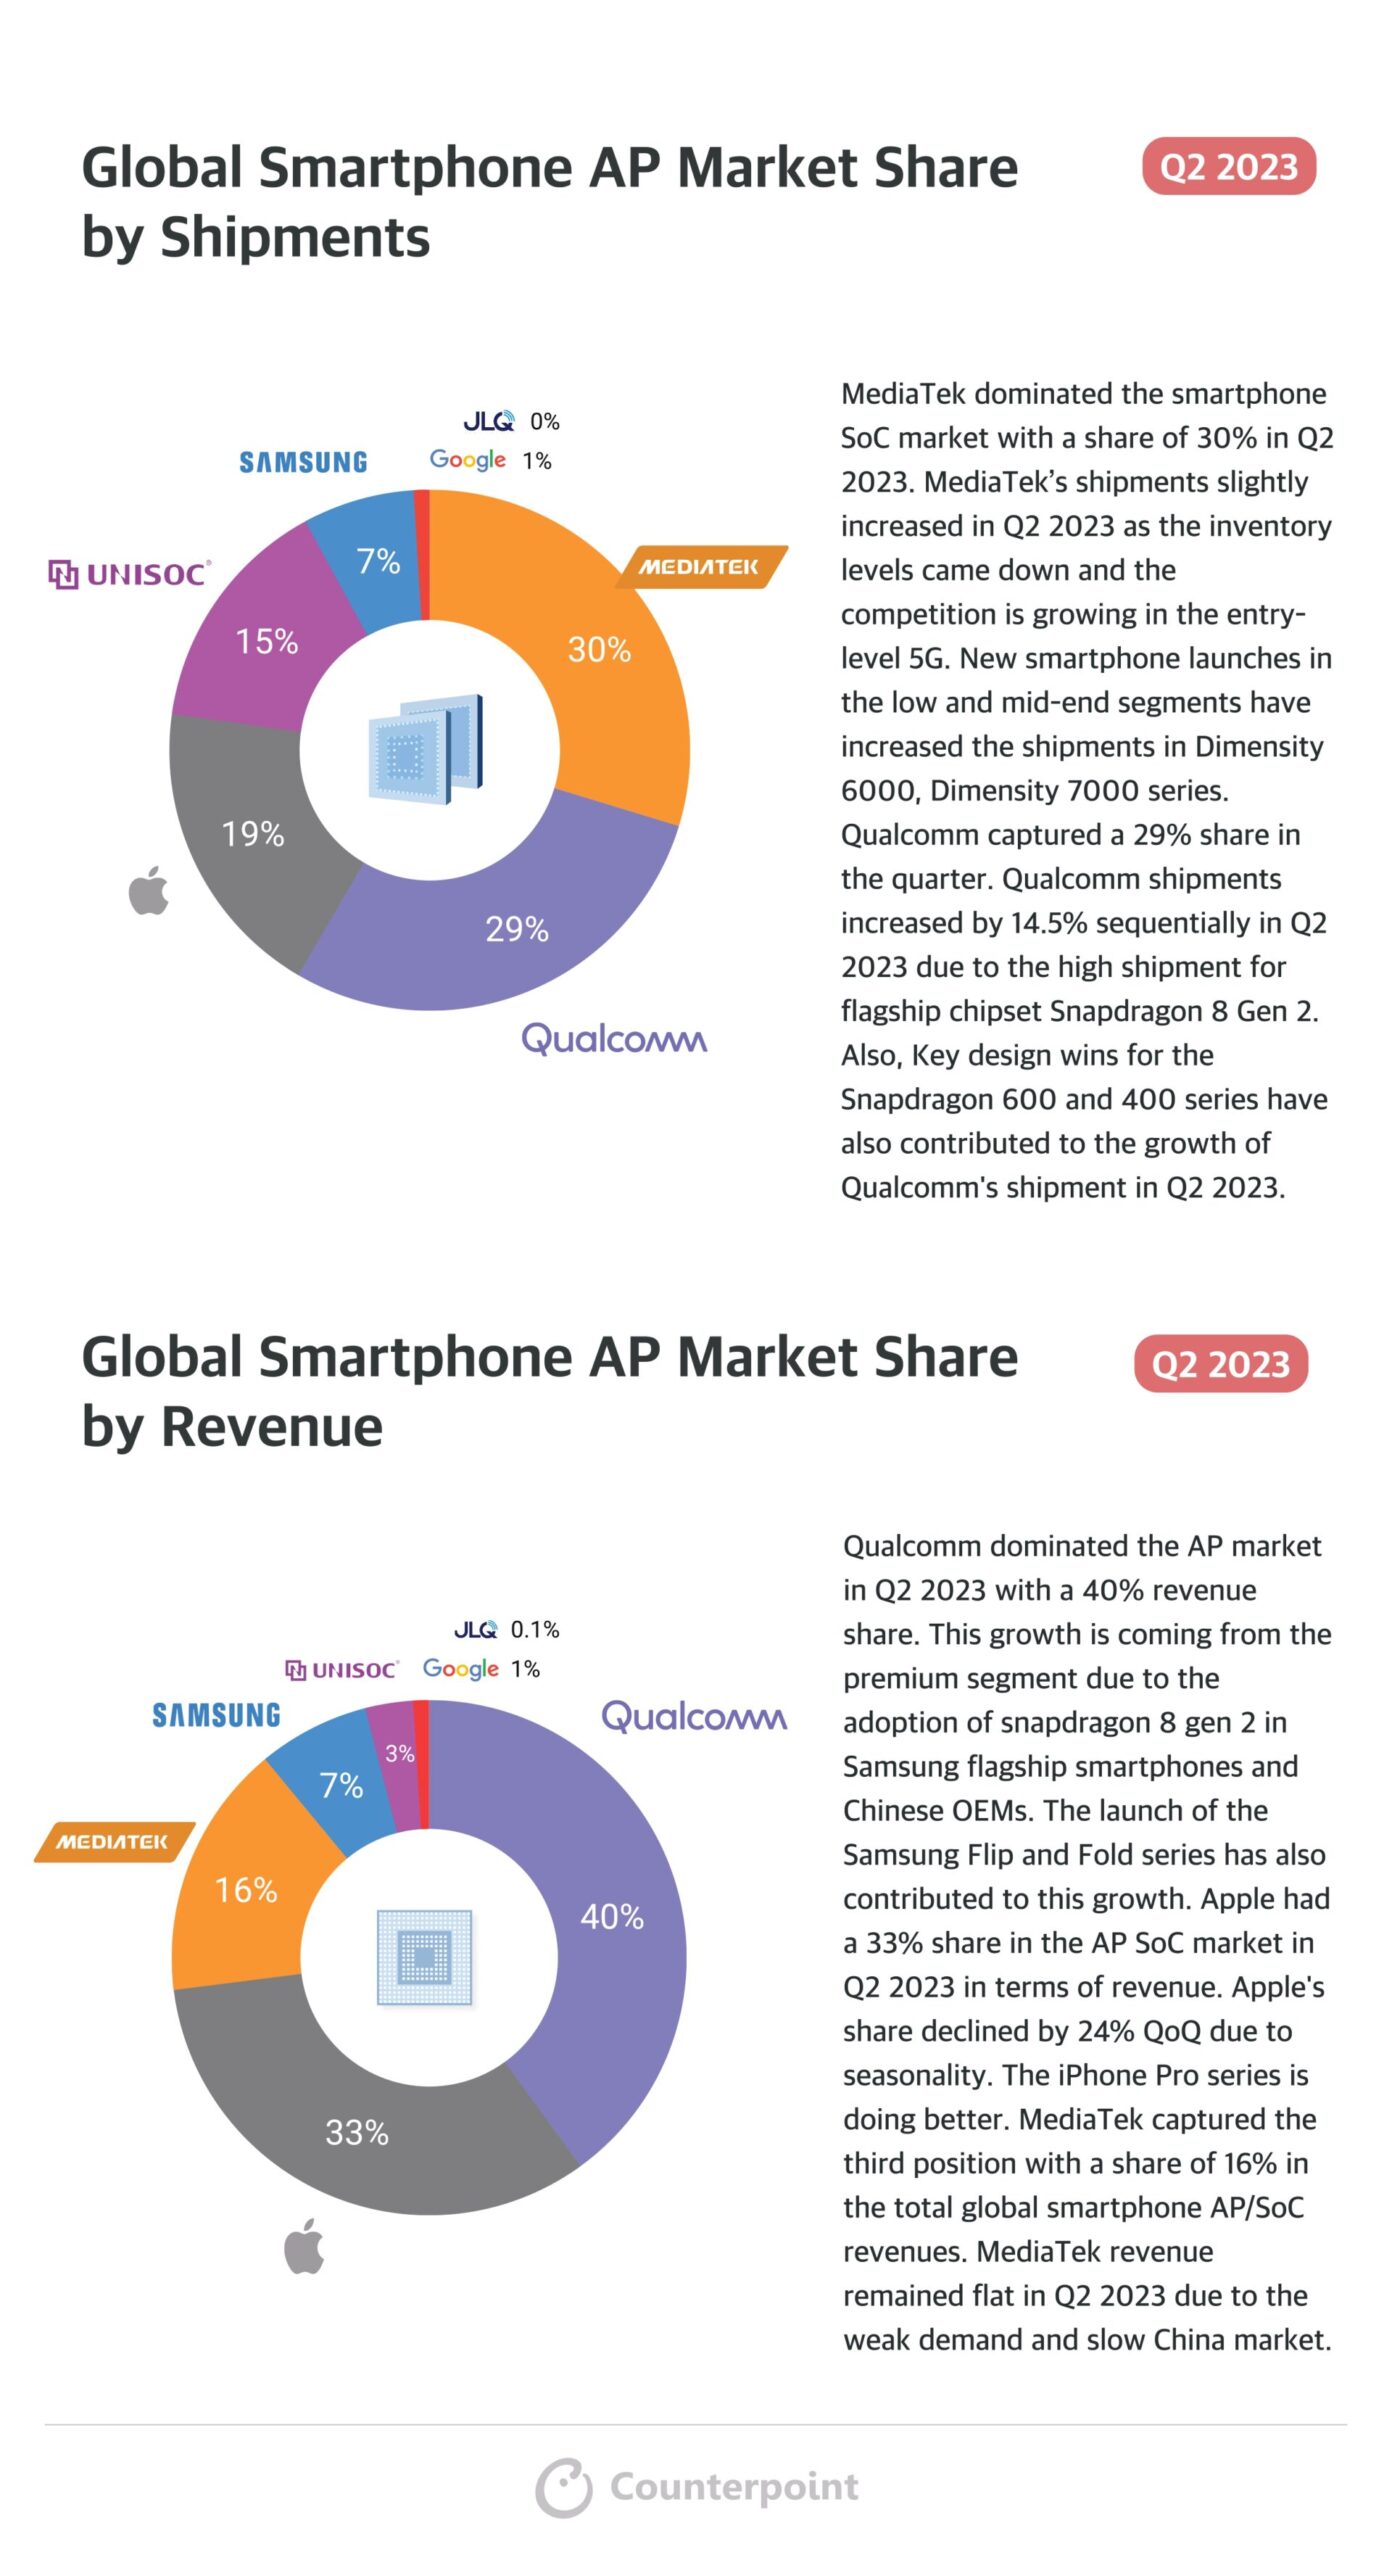
Use the button below to download the high resolution PDF of the infographic:
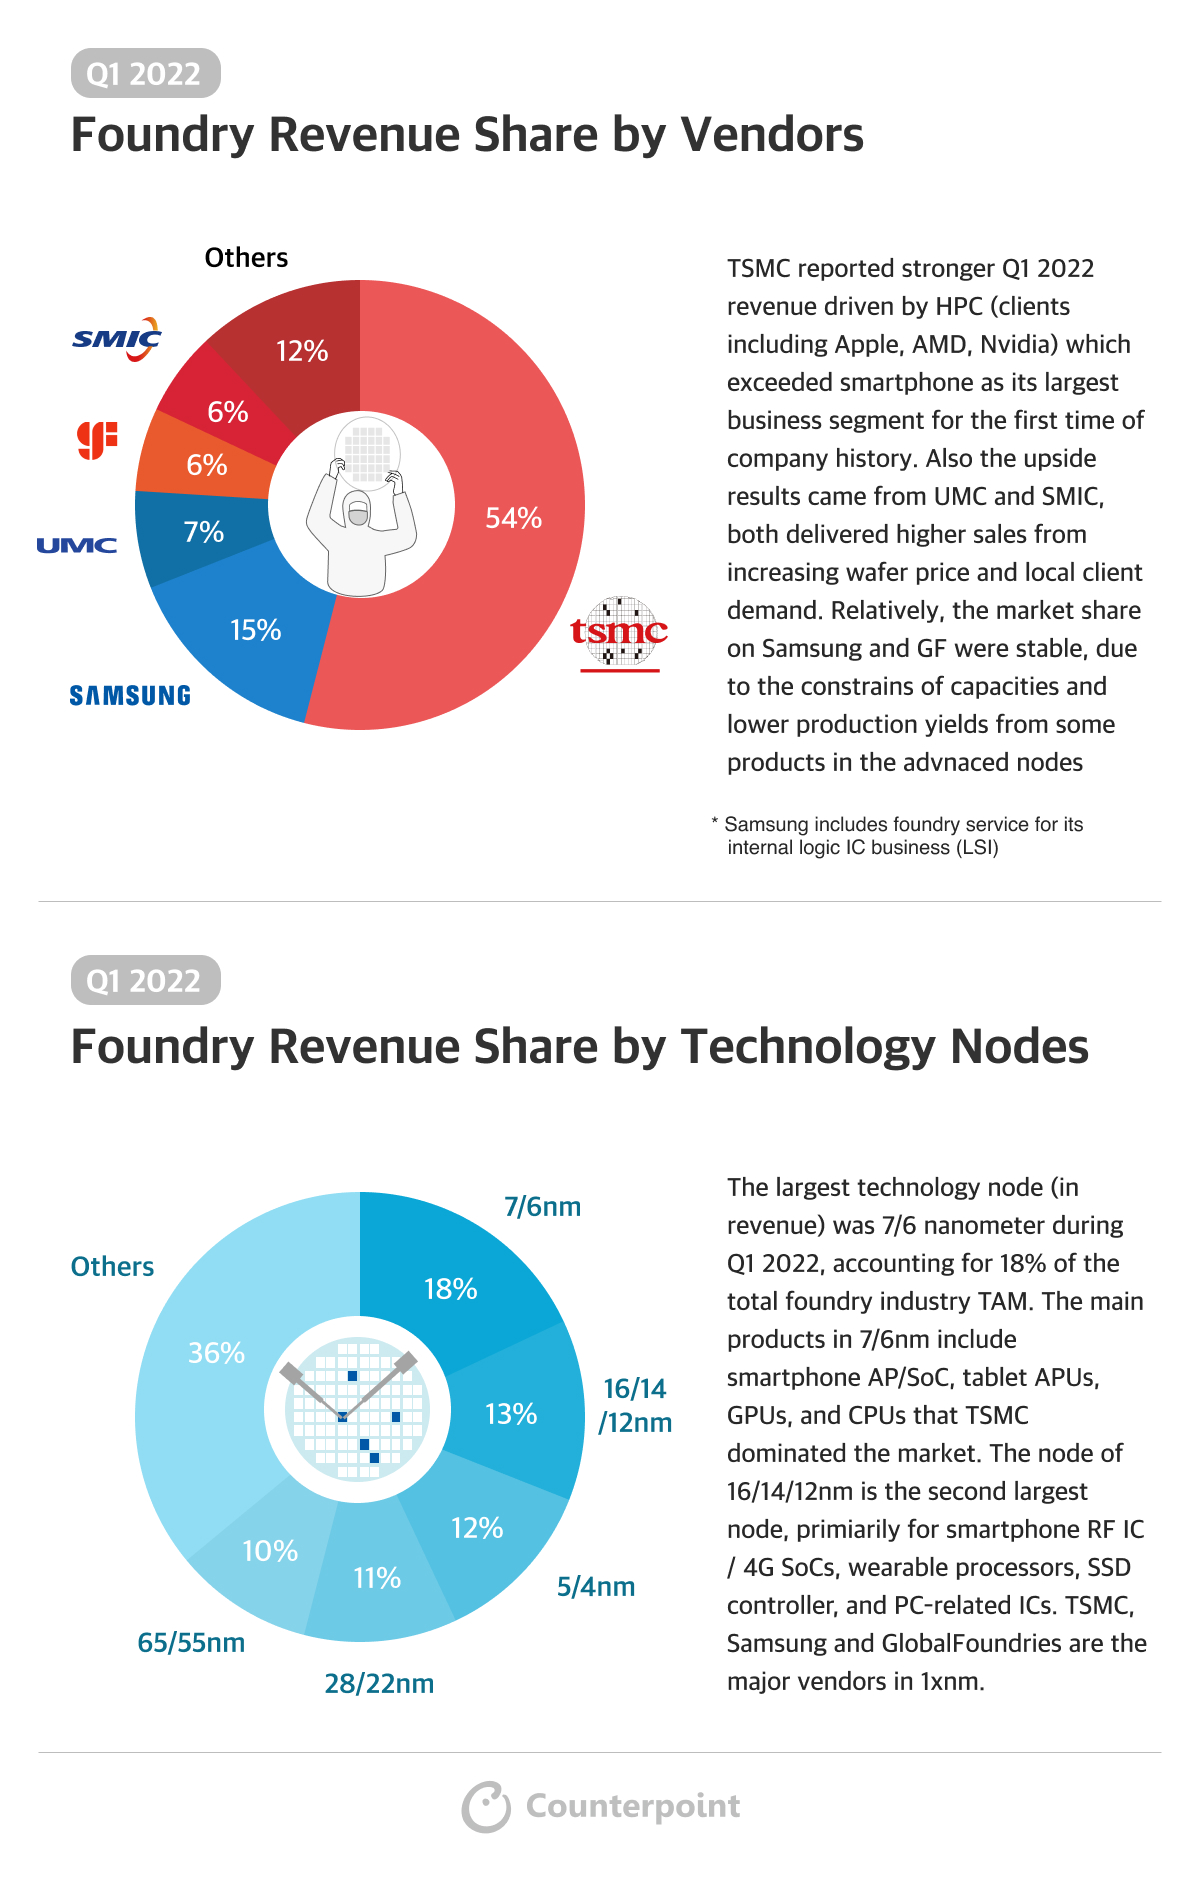
Infographic: Foundry Revenue Share in Q2 2023
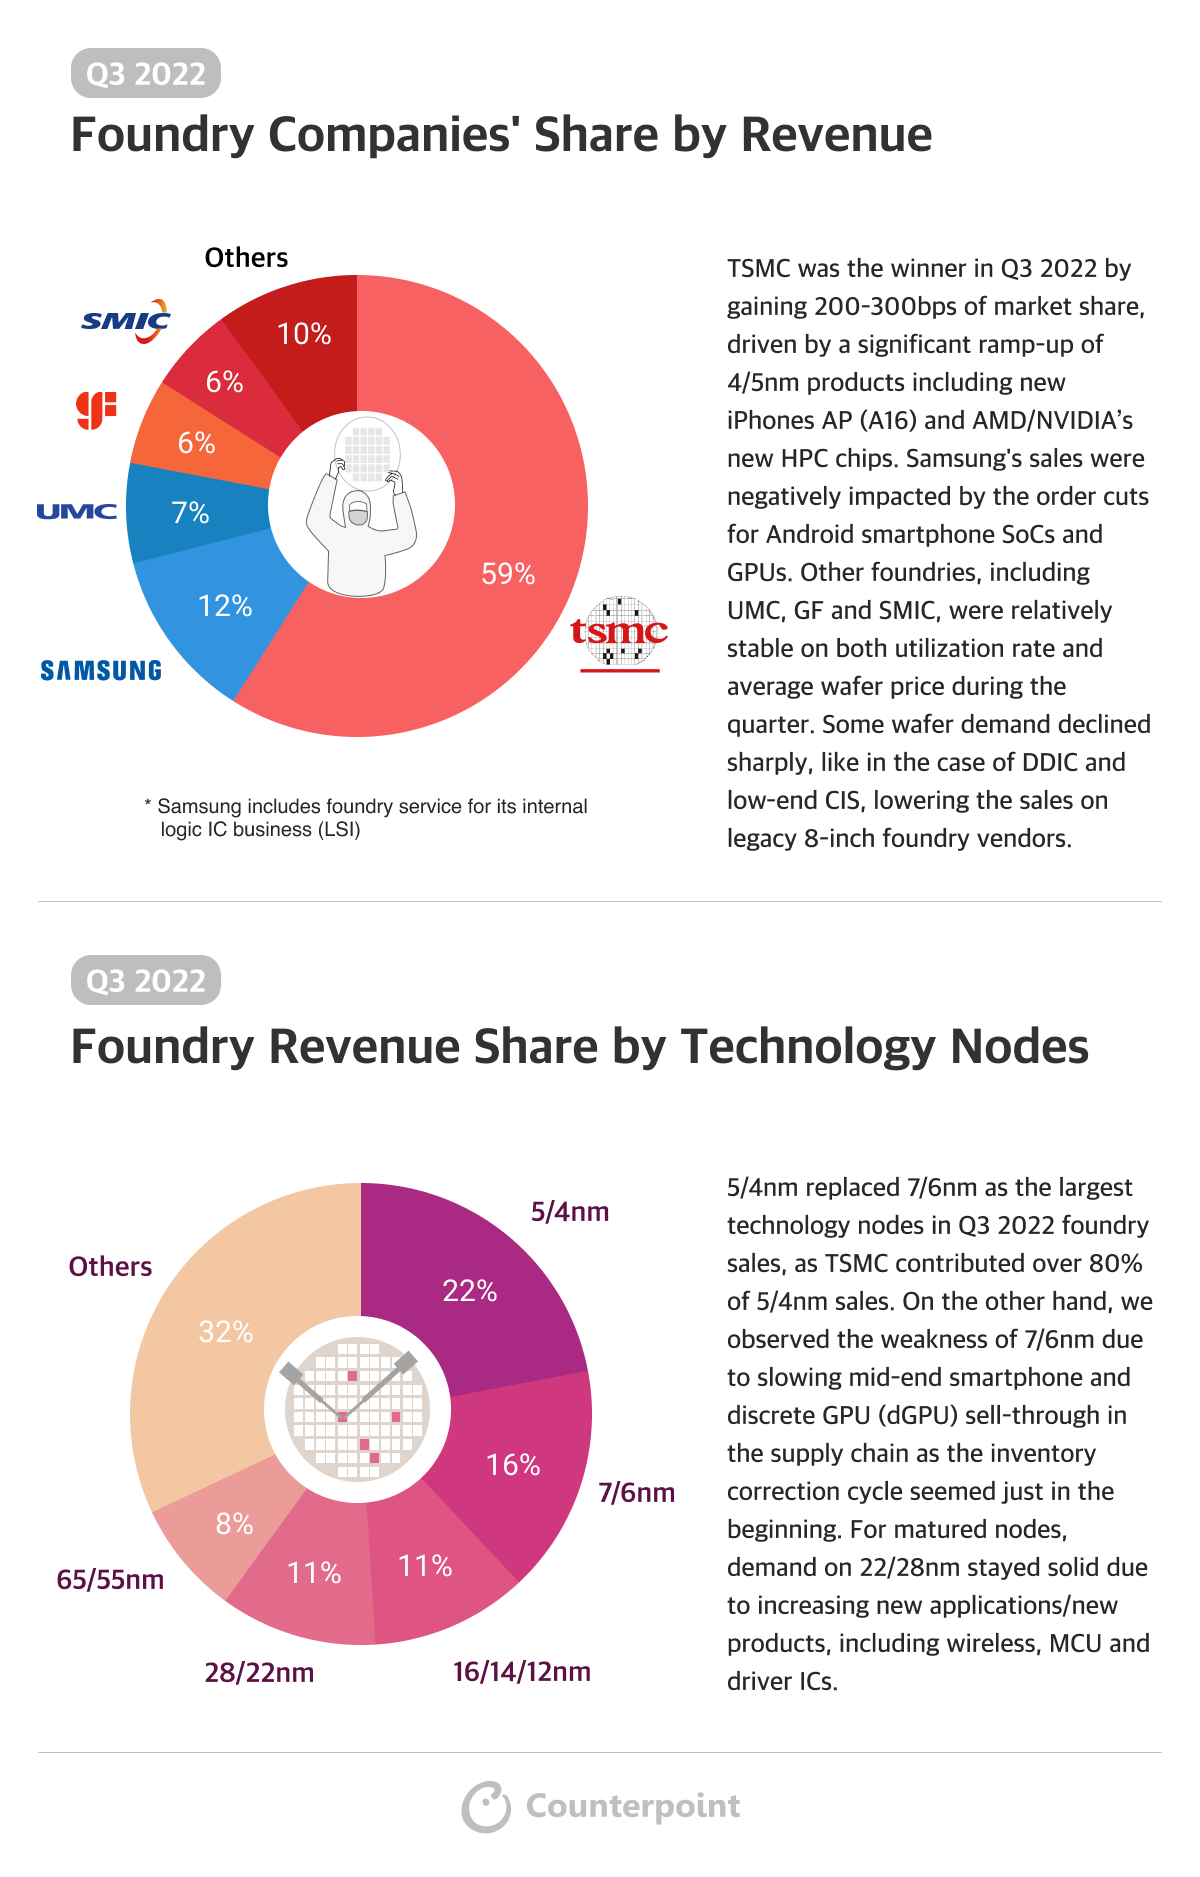
Foundry Companies’ Share by Revenue
TSMC maintained its leadership in the foundry market with a stable 59% market share in Q2 2023. In contrast, Samsung Foundry’s market share dipped by nearly 1% to 11%, primarily due to ongoing smartphone inventory adjustments and the loss of smartphone AP SoC orders from a US client. On the other hand, UMC saw an increase in market share, driven by the continued strength of DDICs and automotive applications in Q2 2023.
Foundry Industry Share by Technology Node
In Q2 2023, the 5/4nm segment continued to dominate the market, holding a significant 21% market share. This strength was driven by robust demand, particularly in the field of AI, with key customers like Nvidia and Broadcom fueling this momentum. In contrast, the 7/6nm segment experienced weakness due to a slower-than-expected recovery in the smartphone market. On the other hand, the 28/22nm segment remained robust, as demand for primary applications, including DDIC and automotive-related applications, remained strong throughout Q2 2023.
Use the button below to download the high resolution PDF of the infographic:


 Use the button below to download the high resolution PDF of the infographic: