<\/i>","library":"fa-solid"},"layout":"horizontal","toggle":"burger"}" data-widget_type="nav-menu.default">

Top

Global Smartwatch Shipments Market Share (Q1 2022 – Q2 2023)

Global Smartwatch Shipments Market Share Q2 2023

August 31, 2023

This page represents theglobal smartwatch marketshare based onshipments by quarter(from 2022-2023) by top brands.
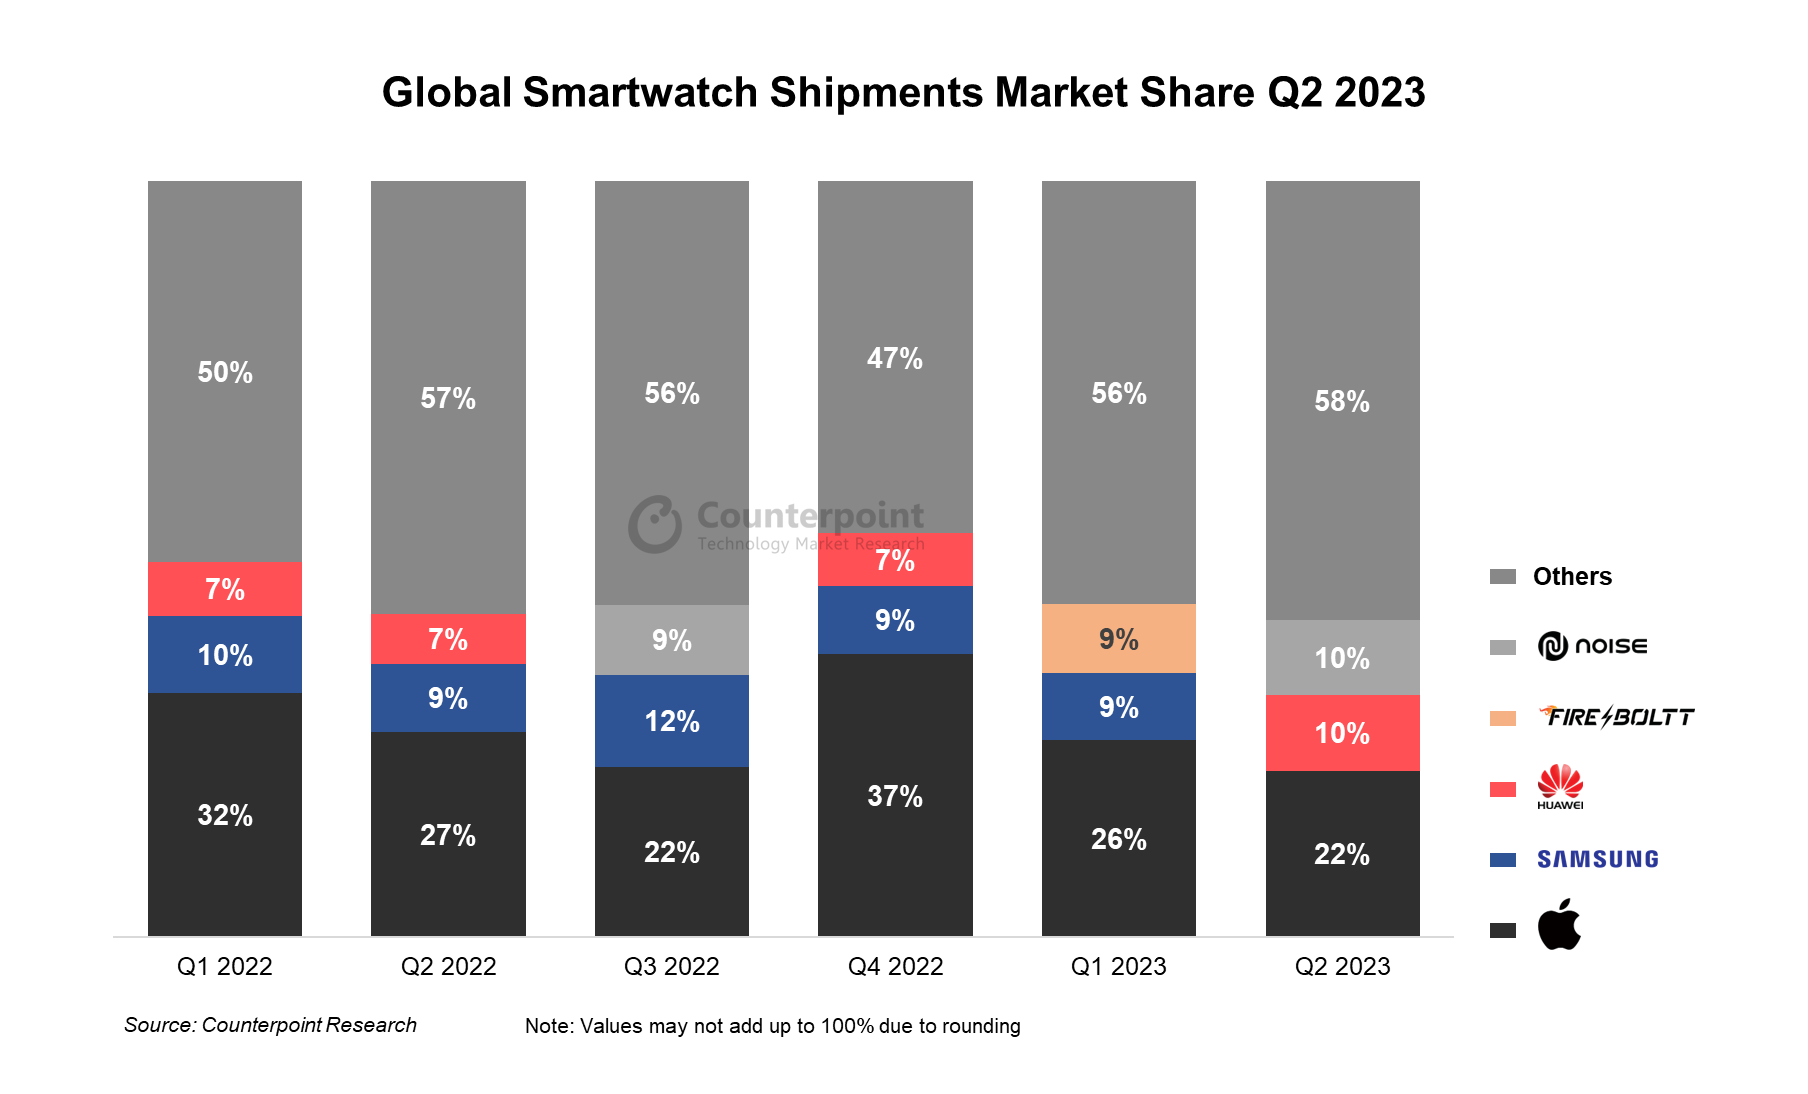
Global Smartwatch Market Share Q2 2023
Note: Rankings provided are based on the standings for each quarter.
The chart includes the top three brands and “others” for each quarter.

Source:Global Smartwatch Shipments by Model Quarterly Tracker

DOWNLOAD:
(Use the buttons below to download the complete chart)

PNG Download Button PDF Download Button

Global Smartwatch Shipments Market Share (Q1 2022 – Q2 2023)
Brands 第一季度
2022
第二季
2022
第三季
2022
Q4
2022
第一季度
2023
第二季
2023
Apple 32% 27% 22% 37% 26% 22%
Samsung 10% 9% 12% 9% 9%
Huawei 7% 7% 7% 10%
Fire Boltt 9%
Noise 9% 10%
Others 50% 57% 56% 47% 56% 58%

Highlights:

  • The global smartwatch market’s shipments bounced back to increase by 11.1% YoY in Q2 2023 to reach 35 million. The previous two quarters had experienced a YoY decline.
  • While Apple and Samsung saw YoY declines of 10% and 19% respectively, Huawei and India’s top two brands – Noise and Fire-Boltt – recorded significant growth.
  • In terms of regional markets, India led the overall global gains as it more than offset declines in North America, Europe and the rest of Asia.

We also have a detailed smartwatch shipments model tracker available for subscribing clients:

Global Smartwatch Shipments by Model Quarterly Tracker, Q2 2023

This report analyses the shipments of smartwatches splitting them in ASPs, price bands and revenues. It also includes model and specs level analysis with a region split.
This is a robust quarterly report with fact-based deep analysis that covers multiple dimensions and will help players across the smartwatch value chain to holistically analyze the current state of the global smartwatch market and plan ahead of competition.

The global smartwatch market increased by 11.1% YoY reaching 35million of quarterly shipments. This is a turnaround in three quarters after experiencing a YoY decline in the previous two quarters.

While Apple and Samsung saw YoY declines of 10% and 19% respectively, Huawei and India’s top two brands – Noise and Fire Boltt – recorded significant growth. By region, India led the overall global gains as it more than offset declines in North America, Europe and the rest of Asia.

Contact UsRead More

*Data on this page is updated every quarter

This data represents the global smartwatch market share by quarter (from 2020-2023) by top brands. For detailed insights on the data/tracker, please reach out to us atcontact(at)www.arena-ruc.com. If you are a member of the press, please contact us atpress(at)www.arena-ruc.comfor any media enquiries.


免责声明:数据、图表和其他视觉效果this page are the exclusive property of Counterpoint Research. While we encourage free use and sharing of all the data on this page, we do request that you always attribute Counterpoint Research

Global Smartwatch Shipments See YoY Growth After Two Quarters

  • In Q2 2023, global smartwatch shipments increased 11% YoY after declining for two successive quarters.
  • For the first time in two years, Huawei took the second spot, fueled by a 58% YoY surge in domestic shipments.
  • India’s market recorded a remarkable 70% YoY growth, whereas North America saw a 9% decline.

Seoul, New Delhi, Hong Kong, Beijing, London, Buenos Aires, San Diego – August 29, 2023

Global smartwatch shipments increased 11% YoY in Q2 2023 after declining in both Q4 2022 and Q1 2023, according to Counterpoint Research’s recently publishedGlobal Smartwatch Model Tracker. India’s shipments soared by 70% YoY, serving as the primary driver for the global market’s rebound. China’s market also recorded a modest increase. Besides, a shift in the competitive landscape was evident as Huawei ascended to the second position in terms of global market share.

Research Analyst Woojin Sonsaid, “Huawei recorded impressive growth in Q2 2023, securing the second position in quarterly shipments for the first time in two years. The leading Chinese brand’s growth stagnated for some time due to technological sanctions and a slowdown in its domestic market. Although the Chinese market’s recovery remained lukewarm, Huawei aggressively pushed new flagship products such as the Watch 4 series into the market in Q2, achieving its highest quarterly shipments after 2020. Huawei seems to be determined to bounce back in the market. It remains to be seen whether this momentum can be effectively expanded to other sectors, such as smartphones.”

Global Top 3 Smartwatch Brands’ Shipment Share, Q2 2023 vs Q2 2022

Smartwatch Brands’ Shipment Share

Source:Counterpoint Global Smartwatch Model Shipment & Revenue Tracker, Q2 2023

Market summary

  • Applesaw a 10% YoY decline in its Q2 2023 shipments. This decline pushed its Q2 shipments to below 8 million units for the first time in three years. Consequently, Apple’s market share fell to 22% from 27% in Q2 2022.
  • Huaweimade big strides by increasing its domestic market share to 39% following a surge of 58% in shipments. This achievement propelled the brand to the second spot in the global smartwatch market share rankings. Another significant change was observed in the premium segment, especially in the >$500 band. Huawei’s products in the >$500 band in China expanded their share in the band to 52% in Q2 2023, a remarkable leap from the brand’s near-absence from the band in the same quarter of 2022.
  • Indian brandsNoiseandFire-Bolttemerged as major contenders, boasting 86% and 70% YoY growth, respectively. Within Noise’s offerings, products priced under $50 constituted a significant 98% of total shipments. Noise’s Colorfit Icon series managed to carve out a substantial 28% share of the total shipments. Fire-Boltt also made strides in expanding its market share by capitalizing on cost-effective smartwatches.
  • Samsungwitnessed a 19% YoY decline in Q2 2023. The brand managed to boost shipments in the Chinese and Indian markets. Samsung’s performance in North America and Europe, its pivotal markets, recorded 24% and 13% YoY declines, respectively.

Smartwatch Shipment Share by Region, Q2 2023 vs Q2 2022

Smartwatch Shipment Share by Region

Source:Counterpoint Global Smartwatch Model Shipment & Revenue Tracker, Q2 2023

In terms of regional shipment shares, India’s market stood at 34%, a 12% points surge compared to the year-ago period. In Q2 2023, 88% of India’s smartwatch shipments were dominated by products priced <$50. Leading the charge in this segment were Noise, Fire-Boltt and boAt, collectively contributing to 72% of India’s total shipments.

TheChinese market’s share declined due to the swift expansion of India’s market. However, China’s shipments grew 5% from Q2 2022. In terms of revenue, the share of products priced >$500 surged to around 34% in China.

In North America, there was an 9% YoY reduction in shipments in Q2 2023. However, the revenue saw a rise of around 3% due to the sustained popularity of high-end premium products. Nevertheless, North America’s share inglobal smartwatchrevenues declined, compared to both Q2 2022 and Q2 2021.

Background

Counterpoint Technology Market Research is a global research firm specializing in products in the TMT (technology, media, and telecom) industry. It services major technology and financial firms with a mix of monthly reports, customized projects, and detailed analyses of the mobile and technology markets. Its key analysts are seasoned experts in the high-tech industry.

Analyst Contacts

Sujeong Lim

twitter vector 2

Neil Shah

twitter vector 2

Follow Counterpoint Research
twitter vector 2

press(at)www.arena-ruc.com

相关的帖子

Global Smartwatch Market Revenue up 20% in H1 2020, Led by Apple, Garmin & Huawei

  • The top three brands contributed more than 69% of the total market revenue in H1 2020.

Seoul, Hong Kong, New Delhi, Beijing, London, Buenos Aires, San Diego —August 20, 2020

Exhibit 1: Global Smartwatch Shipment Revenue Share % in H1 2020 vs H1 2019

Counterpoint Research Global Smartwatch Shipment Revenue Share % in H1 2020 vs H1 2019

The global smartwatch market posted a healthy 20% revenue growth in H1 2020 despite the COVID-19 pandemic and shipments remaining flat compared to the same period last year, according to the latest research from Counterpoint’s IoT service.

Commenting on thesmartwatchmarket dynamics, Senior AnalystSujeong Limsaid: “The smartwatch space remains a popular consumer device segment, compared to the downturn seen in smartphone demand and many other segments in the first six months of 2020 due to the devastation caused byCOVID-19. Close to42 million smartwatches were shippedin the first half of 2020 as wearables continue to see greater demand with consumers becoming more health conscious. India (+57% YoY), Europe (+9% YoY) and the US (+5% YoY), the most affected regions of COVID-19, saw a healthy growth in smartwatch shipments which offset the decline in other markets.”

Lim added: “Applecontinued to dominate the smartwatch market both in volume and value. Apple captured a record half of the market in terms of revenue due to strong demand for the Apple Watch S5 models. In terms of shipment volumes,Apple Watchgrew 22% globally with Europe and North America being the fastest growing markets in the first half of 2020.”

Commenting on the competitive landscape, Vice President ResearchNeil Shahsaid: “Huawei saw healthy volumes (+57% YoY), jumping to the second spot globally in the first half of 2020.Huaweibenefitted from significant demand for its smartwatches, especially the Watch GT2 series in its home market China and Asian markets, with shipment volumes growing 90% in both the regions.Garmin, the second-largest brand in terms of revenue globally, continued to make strides cornering the sports enthusiast and athlete market. The brand saw healthy demand (+31% YoY) for its Forerunner and Fenix line, making up one of the broadest portfolios of smartwatches in the market. Europe and North America remain the key markets for Garmin.”

Talking about fast-growing brands, Shah said: “Amazfit (+51% YoY) andXiaomi(+47% YoY) made healthy strides during the first half with expanding portfolios and better geographic reach. China, India and the rest of Asia remain central to these brands’ growth story.Samsungfaced some headwinds during the first half, but the launch ofGalaxy Watch 3在这个年代econd half could drum up some demand for the Korean vendor. Fitbit, Ticwatch and Suunto faced some tough competition from Garmin and Apple during the first half and will thus look forward to ramping up initiatives to ignite the demand during the holiday season.”

Exhibit 2: Global Smartwatch Best-Selling Models by Shipment Volumes, H1 2020
Counterpoint Global Smartwatch Best-Selling Models by Shipment Volumes, H1 2020

评论其他smartwatch趋势,研究DirectorJeff Fieldhacksaid: “GoogleWearOS continues to account for 10% of the total smartwatch market, behindApple WatchOS. Huawei’s Lite OS and Amazfit’s Amazfit OS are growing fast. Further, the cellular-capable smartwatch is becoming more popular and accounts for more than one in four smartwatches shipped, benefitting the likes ofQualcomm. Heart rate monitoring now is featured in almost 60% of the smartwatches. Fall detection and SPO2 are the features that should see mass-adoption in future models. Square form-factor accounts for almost two-thirds of the smartwatches globally as the form factor is helping to better fit additional sensors and needed battery footprint. The massive leaps in battery life and processing power are helping to better track overall health as continual heartrate, sleep and other monitoring can be done instead of the device sitting on a charger. The leaps in solar charging technology will also help OEMs concentrate on better monitoring. We expect to continue to see a focus on fitness and wellness applications.”

A comprehensive report on the smartwatch shipment tracker by model and geography is available for subscribing clients on our华体会游戏网址.

Background:

Counterpoint Technology Market Research is a global research firm specializing in Technology products in the TMT industry. It services major technology firms and financial firms with a mix of monthly reports, customized projects and detailed analysis of the mobile and technology markets. Its key analysts are experts in the industry with an average tenure of 13 years in the high-tech industry.

Analyst Contacts:

Sujeong Lim
twitter

Neil Shah
twitter

Jeff Fieldhack
twitter

Counterpoint Research
press(at)www.arena-ruc.com
twitter

Term of Use and Privacy Policy

Counterpoint Technology Market Research Limited

Registration

In order to access Counterpoint Technology Market Research Limited (Company or We hereafter) Web sites, you may be asked to complete a registration form. You are required to provide contact information which is used to enhance the user experience and determine whether you are a paid subscriber or not.
当你注册个人信息我们问you for personal information. We use this information to provide you with the best advice and highest-quality service as well as with offers that we think are relevant to you. We may also contact you regarding a Web site problem or other customer service-related issues. We do not sell, share or rent personal information about you collected on Company Web sites.

How to unsubscribe and Termination

You may request to terminate your account or unsubscribe to any email subscriptions or mailing lists at any time. In accessing and using this Website, User agrees to comply with all applicable laws and agrees not to take any action that would compromise the security or viability of this Website. The Company may terminate User’s access to this Website at any time for any reason. The terms hereunder regarding Accuracy of Information and Third Party Rights shall survive termination.

Website Content and Copyright

This Website is the property of Counterpoint and is protected by international copyright law and conventions. We grant users the right to access and use the Website, so long as such use is for internal information purposes, and User does not alter, copy, disseminate, redistribute or republish any content or feature of this Website. User acknowledges that access to and use of this Website is subject to these TERMS OF USE and any expanded access or use must be approved in writing by the Company.
– Passwords are for user’s individual use
– Passwords may not be shared with others
– Users may not store documents in shared folders.
– Users may not redistribute documents to non-users unless otherwise stated in their contract terms.

Changes or Updates to the Website

The Company reserves the right to change, update or discontinue any aspect of this Website at any time without notice. Your continued use of the Website after any such change constitutes your agreement to these TERMS OF USE, as modified.
Accuracy of Information: While the information contained on this Website has been obtained from sources believed to be reliable, We disclaims all warranties as to the accuracy, completeness or adequacy of such information. User assumes sole responsibility for the use it makes of this Website to achieve his/her intended results.

Third Party Links: This Website may contain links to other third party websites, which are provided as additional resources for the convenience of Users. We do not endorse, sponsor or accept any responsibility for these third party websites, User agrees to direct any concerns relating to these third party websites to the relevant website administrator.

Cookies and Tracking

We may monitor how you use our Web sites. It is used solely for purposes of enabling us to provide you with a personalized Web site experience.
This data may also be used in the aggregate, to identify appropriate product offerings and subscription plans.
Cookies may be set in order to identify you and determine your access privileges. Cookies are simply identifiers. You have the ability to delete cookie files from your hard disk drive.
This site is registered onwpml.orgas a development site.