<\/i>","library":"fa-solid"},"layout":"horizontal","toggle":"burger"}" data-widget_type="nav-menu.default">

Top

Navigating Permanent Roaming for IoT: Challenges and Solutions

  • The growing IoT ecosystem has brought forth its own set of challenges. One such challenge is permanent roaming.
  • While many countries allow permanent roaming without significant constraints, some big countries have implemented limitations on this practice.
  • There are multiple ways to circumvent the problem of permanent roaming. These includeeSIM, Multi-IMSI, aggregator platforms, and dynamic network selection algorithms.

The Internet of Things (IoT) has revolutionized the way we interact with the world around us. From smart homes to industrial automation,IoTdevices are playing a pivotal role in enhancing efficiency and convenience. However, the growing IoT ecosystem has brought forth its own set of challenges. One such challenge is permanent roaming, a phenomenon that has gained significance due to the global nature ofIoTdeployments. In this blog, we will delve into the concept of permanent roaming for IoT, discuss the challenges it poses, and explore potential solutions.

Understanding permanent roaming for IoT

Permanent roaming in the context of IoT refers to the practice of utilizingcellularconnectivity across different geographical locations on a consistent basis. Unlike traditional mobile phones, which might roam temporarily when users travel, IoT devices often need to maintain connectivity across various regions for extended periods. This is a fundamental requirement for IoT devices used in logistics, remote monitoring,agricultureand other activities.

While many countries allow permanent roaming without significant constraints, some big countries have implemented limitations on this practice. The map below shows countries where permanent roaming is banned and those where local carriers have imposed restrictions.Major countries where permanent roaming is restricted

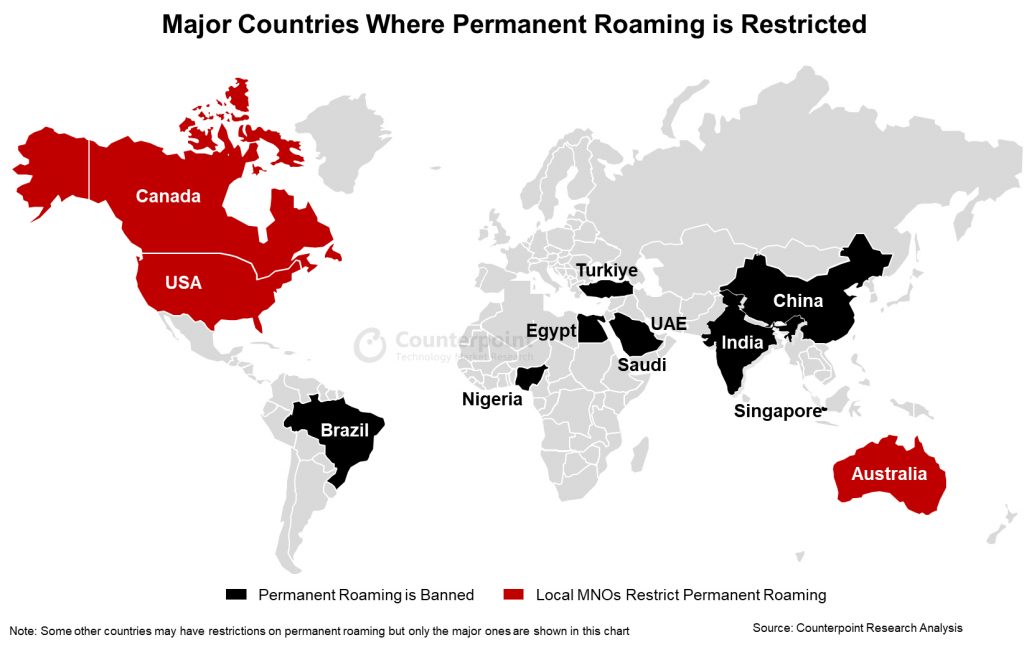
Countries that prohibit permanent roaming includeIndia, China, Brazil, Saudi Arabia, Egypt, Nigeria, Turkiye (formerly Turkey), UAE and Singapore. Besides, mobile operators in the US, Canada and Australia have imposed restrictions on permanent roaming within theirnetworks, effectively imposing a ban on this practice in these countries. Remarkably, these 12 countries collectively cover more than 50% of the world’s population and account for well over three-quarters of the IoT market.

Challenges posed byrestrictions onpermanent roaming

IoT devices are typically deployed on a global scale, leading to a complex scenario where these devices are connected to multiple mobile network operators (MNOs) across different countries. Imagine an electric car company that markets its vehicles across various regions. In countries where permanent roaming is not allowed, the company must procure local connectivity. This situation presents a host of challenges that ripple through the operational landscape:

  • Complex network management:Handling connections to multiple networks becomes really complex. Each network might have different prices, coverage areas and technical needs. The process of harmonizing such distinct facets is likely to be intricate and time-consuming.
  • Dealing with many partners:The company needs to work with different network partners. This means making deals, managing money and ensuring good service quality across networks. Besides, multiple networks means multiple bills and contracts. All of these tasks together can become very complicated and hard to manage as this activity is not core to the business.
  • Higher costs:Because of the rules against permanent roaming, the company has to pay more money to set up connections in each country. This extra cost can make things difficult and might affect how much the company can grow.
  • Less flexibility:Without the ability to use permanent roaming, the devices might not work as well when they move between countries. This can be a problem for customers who expect a consistent experience.
  • More planning needed:Since the company can’t rely on the same connection everywhere, it needs to plan ahead. This can slow things down and make expansion harder. There could be issues related to data sovereignty and compliance that may require additional planning.

Solutionsforpermanent roaming

There are multiple ways to circumvent the problems associated with permanent roaming. However, it is critical to select a managed service provider that has tie-ups with local MNOs/MVNOs. Alternatively, direct MNO relationships can be managed using aggregator connectivity management platforms.

eSIM (embedded SIM):eSIMtechnology is a game changer in the IoT landscape. It enables devices to have programmable SIM cards that can be remotely provisioned over the air. With eSIM, IoT devices can switch between different MNOs without requiring a physical SIM card replacement, thus simplifying the management of connectivity. UsingeSIM, it is possible to switch between a local profile and multiple roaming profiles every 90 days to avoid permanent roaming. Many managed service providers have this workaround to avoid permanent roaming. The new IoT eSIM specifications will further simplify the provisioning and orchestration of connectivity.

Multi-IMSI (International Mobile Subscriber Identity):Multi-IMSI solutions allow a single physical SIM card to have multiple IMSIs from different MNOs. This enables the device to seamlessly switch between networks while maintaining a single SIM card. By intelligently selecting the optimal IMSI based on factors like network quality and cost, Multi-IMSI solutions optimize connectivity and reduce operational complexities. However, the managed service provider needs to have a local presence or tie-ups.

Aggregator platforms:Aggregator connectivity management platforms (CMPs) act as intermediaries between IoT device owners and various MNOs. These platforms offer a unified interface for managing connectivity, provisioning,billing, and reporting across multiple networks. By consolidating these tasks, aggregator platforms simplify the management of permanent roaming for IoT devices. A new set of aggregator CMPs like IOTM and ConnectedYou is targeting enterprises instead of carriers to solve the problem of managing multiple networks.

Some of the aggregator platforms offer Dynamic Network Selection Algorithms. Smart algorithms can be implemented in IoT devices to dynamically select the most suitable network based on parameters such as signal strength, latency and cost.

Conclusion

With the IoT landscape continuing to expand globally, the challenges associated with permanent roaming are becoming more pronounced. However, with the advent of innovative solutions such aseSIM, Multi-IMSI, aggregator platforms, and dynamic network selection algorithms, these challenges can be effectively mitigated. These solutions not only simplify the management of connectivity but also enhance cost-effectiveness and operational efficiency for IoT deployments. The key is to find the right managed services partner, which has a platform that enables easy management of connectivity.

相关的帖子

Post Event Coverage: Logicalis’ Journey to Become “Architects of Change” in LATAM ICT Environment

Logicalis ICT(信息、通信Technology) infrastructure and service provider, a UK based company, with a strong global presence. It is unique as Latin America is the company’s biggest region in terms of revenue and number of employees. It has more than 3200 LATAM-based employees and the region represents 37% of its global revenue.

Logicalis has a solid relationship with all major global hardware and software providers. So much so that it has gained many awards. For example, it is Cisco Global Gold Certified reseller, Oracle Platinum Level Partner, etc. Furthermore, in 2019 Cisco awarded it the Latin America Customer Experience Partner of the year.

Cisco recently stated that it has 15,000 SD-WAN sites in LATAM and Logicalis has installed 12,350 of them. So, it already has a good relationship with a significant number of regional and multinational customers. These clients naturally turn to Logicalis to solve their digitalization demand. Logicalis has more than 800 customers in LATAM that cover all major industries though 50% are from the telecommunications sector and 30% from finance.

Logicalis grew through various acquisitions. Thus, the services offered in each market may vary, depending on the merged or acquired companies. In 2008, Logicalis Brazil merged its existing operation with Promon Tecnologia, one of the region’s biggest and oldest IT integrators. This merger allowed it to gain significant business and valuable human resources in Brazil. Most of the management in Logicalis Brazil today are from Promon. Logicalis is the fourth biggest ICT business provider in Brazil, outperforming large multinationals companies such as Nokia.

今年Logicalis分析师峰会was a two-day event in Sao Paulo, Brazil. The company took the opportunity to showcase its plans to evolve from a traditional IT integrator to what it describes as, “Architects of Change” within the LATAM’s digital transformation. It plans to leverage all the digital infrastructure it buids, to expand into technology and business consulting to design technology solutions.

Exhibit 1: Logicalis Latin America Service Portfolio

Logicalis Latin America Service Portfolio
Source: Logicalis Latin America Strategy Presentation

To do so, it has projected its growth based on several strategic pillars: Cloud, Information Security, Data Intelligence and IoT services (exhibit 2). It has built a team of professionals in each of these pillars. During the event, it showed that it possesses the capabilities and partnerships to offer clients end-to-end services and solutions in each strategic priority area.

Last but not least, Logicalis’ key success factor lays on its ability to demonstrate to clients potential cost savings or revenue potential of implementing a solution. This is a value-added service that IT managers appreciate, as many projects undertaken in the region have failed to prove a positive return on investment.

The COVID-19 crisis will impact the revenue of most businesses in the region. However, it has also exposed how little prepared many businesses were to cope with new way of working. This will force private and public enterprises to embrace and increase the digitalization of their operations. Thus, Logicalis’ ambition to shape the LATAM digital transformation path looks more relevant than ever.

LATAM Individual Markets Overview 2019

In 2019, the Latin America region represented only 10% of the global smartphone market. Nevertheless, it includes Brazil and Mexico, which are both among the top ten biggest markets worldwide. These two countries now have similar smartphone usage penetration, but they have quite different dynamics. Open distribution channels account for 80% of Brazil’s market. While in Mexico, 80% of the market is operator-driven.

LATAM countries have various levels smartphone penetration. Chile and Argentina have the highest, while Peru and Paraguay have the lowest. The varying maturity levels and local regulations largely dictate the competitive landscape:

  • BrazilandArgentina都需要本地制造/装配。它是a complicated process to set up local manufacturing, so only a few brands manage to do so, which makes these markets highly concentrated brand wise the same three brands represent more than 80% of the market. In both countries, Samsung has more than 40% share. Motorola is a distant follower and LG continues as #3. LG has been losing share in many other markets, but it enjoys a competitive advantage of local manufacturing in these countries.
  • Mexico: Samsung leads the market, but Huawei is a close contender. So much so that during two months in 2019, it overtook Samsung, making Mexico Huawei’s biggest market in the region. The battle for supremacy accelerated the replacement rate and increased smartphone penetration. Motorola is a solid #3.
  • Peru:the top 3 brands represent only 65% of the market. It is one of the most brand diverse markets in LATAM. It also has high feature phone penetration. Samsung and Huawei lead the market, while Motorola is a distant third. Peru has one of the lowest smartphone usages in LATAM, mainly because of the low 4G LTE coverage.
  • Chileis the most mature market in the region. It has LATAM’s highest smartphone penetration, rate of replacement and ASP. It is still an operator driven market, so brands need to have operator approval to succeed. Although it is a small market, it is among Apple’s top 3 market in LATAM. Samsung leads the market. Huawei’s performance was impacted by the US trade ban.
  • Ecuadoris the smallest market in this infographic, but withhigh growth potential.3 g智能手机仍然相关,部分由于e of the price of the smartphone, partly due to the limited coverage of the 4G network. Samsung and Huawei lead the market. Bmobile, a local brand, is a distant #3.
  • Colombiais the third biggest market in LATAM. Samsung is the absolute leader. Huawei was challenging Samsung leadership in the market during Q1 2019. However, the trade ban imposed by the US government highly impacted Huawei causing a loss of share to Samsung and Motorola.

Samsung was the absolute leader in all the major market in LATAM in 2019. Motorola was a distant number two that excelled in Argentina and Brazil. Huawei was a strong number three, but its performance was impacted during the second half of the year.

The infographic is a high-level overview of the data we track in our quarterlyMarket Monitor Service.

LATAM Smartphone Market Falls YoY For The Fourth Consecutive Quarter in Q2 2019

Samsung is the top smartphone brand in the LATAM market with 42.3% share.

Motorola ships more than Huawei to become the second-largest smartphone brand once again.

Samsung, Motorola, and Huawei together have 71% market share.

New Delhi, Hong Kong, Seoul, London, Beijing, San Diego, Buenos Aires – August 22nd, 2019

Smartphone shipments in Latin America fell 3.3% year-on-year (YoY) during Q2 2019, according to the latest research from Counterpoint’sMarket Monitorservice. This is the fourth consecutive quarter that smartphone shipments have fallen on a YoY basis. Sequentially, shipments increased marginally by around 1%.

As the market shrinks, local brands are getting squeezed and losing out to international and Chinese players. The market is more concentrated than ever, and this trend is increasing. Within just a year, the market share of the top three brands in LATAM has grown 10 percentage points. Samsung, Motorola, and Huawei, the top three brands, now account for 71% of the total market.

Commenting on the Huawei’s performance in LATAM, Counterpoint’sSenior Analyst, Tina Lu, highlighted, “Huawei started the quarter shipping its highest ever number of smartphones. Its volume outpaced that of Motorola as it became the second-largest brand in LATAM. However, the US’ trade ban on Huawei, announced in May, impacted demand. It affected its shipments, especially from June onwards. Looking forward, Huawei’s position in LATAM could remain limited to a single-digit share if the trade ban continues. Even if the trade ban is lifted during the next couple of months, it will take some time to pick-up the growth pace it enjoyed in LATAM during most of H1 2019, unless it gets serious about setting up an assembling/manufacturing facility in Brazil.”

Parv Sharma, Research Analyst,added, “Samsung and Motorola have both been the biggest winners of Huawei’s drop. Samsung regained leadership in each of the big markets of the region after being challenged in some markets by Huawei. Samsung’s performance was due to price cuts for the J series and the launch of the new A series. It is also spending massively on advertising across all channels. This combination has led to its highest ever market share. Meanwhile, Motorola once again became the second-largest player in the region. It had double-digit YoY growth, as it managed to stay a strong number two in both Brazil and Argentina.”

Exhibit 1: LATAM Smartphone Market Share

LATAM Smartphone Market Share Source: Counterpoint Research Market Monitor Q2 2019

Commenting on the price-band trends in LATAM,Tina Lu, highlighted, “LATAM is still a low-end smartphone market, almost 57% of the smartphones sold cost less than US$199, although this share is declining. People are spending slightly more on a smartphone, and as a result, the beneficiary is the US$200-US$299 price-band. Huawei and Motorola have been the main drivers of this increase. Motorola discontinued its C series at the end of last year and left only the E series in the entry-level segment and the G series as its mid-range device. This has also led to an average selling price (ASP) increase.”

While the

Exhibit 2: LATAM Smartphone Price-Band Market Share

LATAM Smartphone Price-Band Market Share Source: Counterpoint Research Market Monitor Q2 2019

Market Summary:

  • Samsung’s volumes increased at a double-digit rate on a YoY basis. More than four out of 10 smartphones shipped in the region during Q2 2019 were from Samsung.
  • Motorola’s YoY growth was due to its success on the open channel as well as Argentina and Brazil. It has a good understanding of the open channel and benefited from the fact that the open channel that has grown fastest in LATAM over the last three years.
  • LG continues to decline, both YoY and quarter-on-quarter (QoQ). Brazil is the only market where it is still a strong number three. In some LATAM markets, such as Mexico and Colombia, it is not even in the top five best-selling brands.
  • Apple’s volumes decreased in most LATAM markets. But the worst-performing markets were Brazil, Chile, and Mexico. The XR and XS models are too expensive for LATAM while the 7 and 8 are not able to lure users.
  • Alcatel had a slight increase over the previous quarter and YoY. The brand had a major restructuring in the second half of last year. Its sales are improving slightly in most LATAM markets, especially in Brazil, Colombia, and Mexico.

The comprehensive and in-depth Q2 2019 Market Monitor is available for subscribing clients. Please feel free to contact us atpress(at)www.arena-ruc.comfor further questions regarding our in-depth latest research, insights or press enquiries.

The Market Monitor research is based on sell-in (shipments) estimates based on vendor’s IR results, vendor polling triangulated with sell-through (sales), supply chain checks and secondary research.

Analyst Contacts:

Tina Lu

Parv Sharma

Peter Richardson

Follow Counterpoint Research
press(at)www.arena-ruc.com

You can alsovisit our Data Section(updated quarterly) to view smartphone market shareGloballyand fromthe USA,ChinaandIndia

Rise of the Open Channel in LATAM

The sales channel landscape for the LATAM mobile devices market has been going through significant changes in the last few years. Just two years ago, nearly 70% of the quarterly mobile device sales in LATAM came from operators. Today, the open channel has a more even share (43%) of the market. And it is growing fast.

In a market where sales of mobile devices have grown at a CAGR of only 0.24% between 2016 and 2018, the open channel has grown at almost 8% CAGR. As a result, operators have been slowly pivoting towards being a service provider after years of being device driven business.

Exhibit 1: Open Channel Mobile Devices Market Share 2016Q1 vs. 2019Q1

Source: Counterpoint Market Monitor Q1 2019

At Counterpoint, we have been mapping the top three operators’ share in mobile device sales for more than three years. The findings reveal starkly different strategies of LATAM’s two biggest operators, America Movil, and Telefonica, resulting in very distinct outcomes and share of the mobile device market. America Movil, which operates under the brands Claro and Telcel, and Telefonica, which operates under the brands Movistar and Vivo, still account for 70% of the mobile handsets sold through the operator channel. Counterpoint’s latest research tracks the changing trends of the sales channel and OEMs for mobile devices in the LATAM region over the last few years in great detail. The comprehensive and in-depth report is available exclusively for clientshere.

We believe the LATAM mobile devices market is heading towards an open channel ecosystem. Every other quarter, operators do regain some share. However, in peak season, the open channel claws back its lost share and even gains marginally. Over time, operators will continue to lose share. This forces OEMs to negotiate with the retail sector directly.

The open channel, which consists of big retail chains as well as small shops, in some instances, can be tougher to work with than an operator. However, the rise of the open channel has allowed more brands to enter the region. All the top five selling brands, that account for 78% share in LATAM, have a different approach to the operators and open channel when it comes to their channel strategy. Huawei is extremely strong within operator channels. Samsung, on the other hand, the leader of the market in LATAM, and its participation across different sales channels is very similar to that of the market.

This is why we believe that the increasing importance of the open channel is positive for OEMs. Although the operator channel was large, operators were often very selective about the models they stocked. For example, Claro (America Movil) Brazil would only range four brands. However, the same company in Mexico, under the brand name Telcel, would offer more than 22 brands. An increasing share of open channel sales removes such arbitrariness of distribution. But the open channel requires a more aggressive turnover than operators. We examine this and much more in our latest analysis, exclusively for clients, titled.LATAM Mobile Devices Sales Channel Analysis: The Rise of the Open Channel’

Will Huawei’s Extraordinary Growth Story in LATAM Come to a Grinding Halt?

Huawei has been building momentum in LATAM with record volumes and a growth of 51% year-on-year (YoY) during 2018. Its growth came at a time when the market declined by 1%. And it isn’t as if Huawei was slowing down. In Q4 2018, its volume growth reached 130%, YoY. Astonishingly, this growth came despite Huawei not being present in around 37% of the LATAM smartphone market as it does not operate in Brazil and exited Argentina in Q3 2018.

By the end of 2018, Huawei was the leader of the market in Peru and a very solid number two in Chile and Colombia. In Colombia, Huawei became the second largest brand in 2018 and also the leading Chinese brand with 24% market share after including sales of its co-brand HONOR. HONOR entered Colombia in H2 2018, and quickly picked-up share. In Mexico, its biggest LATAM market, Huawei has been increasing volumes through a two for one mix between high and low-price band devices and recently challenged Samsung to be the number one brand in the country. Even in Peru, Huawei keeps challenging for the top spot.

Exhibit 1: Huawei LATAM Shipment Volume Share Evolution

Source: Counterpoint Research Market Monitor

Part of Huawei success in LATAM is due to its improving reputation for offering excellent quality products. Heavy spending on marketing; up to several millions of dollars yearly, in sponsorship, and both online and offline campaigns has successfully built the Huawei brand in the region.

Further, its sales team was big enough to help the brand get into all channels and carriers. Huawei even opened flagship repair stores in most of the capital cities of the biggest countries in LATAM. All these efforts were quite synchronized.

However, just as it seemed Huawei was about to reach a peak for its consumer business unit, the US government decided to impose the export ban. Under a business-as-usual scenario, Huawei’s diligent efforts to enter Brazi would likely have been successful and further boosted its presence in LATAM. But in the current geopolitical environment, entering Brazil looks increasingly unlikely. For the short-term, it will be difficult for Huawei to maintain momentum in LATAM. Counterpoint Research’s analyst team has measured the multiple impacts of the ban in LATAM and other regions, as well as other Huawei business units. This analysis is available to all subscribing clients.

Tapping the Vast Opportunity of Smart Cities in LATAM

In LATAM, governments are the biggest contractor of projects. Between 2013 and 2016, public investment represented around 4% of the region’s total GDP or roughly US$213 billion, according to the World Bank. Nearly 40% of all public investment in the region is a public-private partnership. Building up of urban infrastructure attracted most of these investments. Unfortunately, these projects are often inefficient due to weak planning. As a result, governments are turning to technology with the hope of making their investments work by making projects more efficient.

几天前,我有机会participate in the 2nd edition of the SmartCity Expo in Buenos Aires, Argentina. It was one of the biggestsmart city事件在拉丁美洲。公司推广their services to the cities, while the cities were showcasing how they have evolved. It was a platform for the meeting of the public sector and the private sector. The key themes that emerged out of the event were – digital transformation, security, mobility, education, sustainable future, inclusiveness, and shared economy.

In the last three to four years, a bulk of the public investment in technology has been for digitalizing all processes. National and capital cities’ governments, especially, have spent a good deal of resources to improve their e-readiness. In Brazil, for example, Congress has approved a US$87 billion budget for 2019 to continue with its digital transformation goal.

E-Government index measures the government use of electronic communications devices such as computers and the Internet to provide public services. Exhibit 1 shows the list of ten most e-ready countries in LATAM.

Exhibit 1: LATAM Top Ten E-Government Development Index (EGDI)

Source: UN E-Government Knowledgebase.

However, even within the top ten countries, cities other than national capitals are far from being e-ready. For example, Colombia has more than 1,200 municipalities, Argentina has 2,300, Brazil has 5,500, and only the top 5% of the cities in these countries have an online appointment system. Many small cities, located wealthy parts of countries, are looking to improve their e-readiness. Nonetheless, even cities that started digitizing their data many years ago need intelligence to sort the data. They also could benefit from the use of blockchain technology to crossover data.

Another focus area at the SmartCity Expo was improving city security. Big cities, such as Buenos Aires, Rio de Janeiro, and Sao Paulo, struggle in this regard. As security is an issue that city dwellers most demand, most governments have been installingcamerasall over the cities. For example, Buenos Aires, had 8,500 security cameras by the end of May 2018, while Rio de Janeiro had 4,200 in 2017. The cameras in Rio de Janeiro have been collecting information since 2003 and generate a few terabytes of data every month. Therefore, authorities in Rio de Janeiro are looking for new cloud services to manage and store this data. The city of Rio also needs AI to identify what is normal and what is an anomaly. In the case of Argentina, the coast guard generates 12,000 records each quarter. This year, it contracted Big Data Analytics services to process the data.

Mobility is another area where all major capital cities in LATAM had invested heavily to transform the physical infrastructure. However, there is still a need for major technology investment. For example, the city of Buenos Aires has 6 million people that commute within the city daily. However, it doesn’t have a platform or any information that would convey all the bus or train schedule. To correct this situation, Buenos Aires is planning to launch an app that would inform commuters about the timings of public transport. Although, in the beginning, the coverage of the app will be limited. At present only six cities in LATAM have this service. With almost 60% smartphone penetration, soon all the other cities will have to provide such a service.

这些只是几个为什么有这样的样本a hype about smart cities in LATAM. On average, each of these contracts is worth US$1.5 million. As for opportunities, it is clear that “technology is global”. However, technology needs to be supported by a robust business model. And for this the biggest problem for any company are the LATAM governments in most countries, the contract process is often not transparent, always extremely bureaucratic, and many times tainted with corruption. These are the challenges which need resolution if the smart city opportunity in LATAM is to truly flourish.

4G-LTE at the Top of the Wave in Latin America

By the end of 2018, the subscriber base for 4G-LTE had surpassed 3G in LATAM. Although 4G subscriptions surpassed the 3G subscriptions by only 5M subs, this scale will continue to tilt towards 4G-LTE until 5G comes around. 4G-LTE smartphone sales surpassed those of 3G smartphones by the end of 2015, however, it took three years for LTE to become LATAM’s leading technology in terms of subscribers.

Exhibit 1: LATAM Subscription Share by Technology

LATAM Subscription Share by Technology

Source: Counterpoint Market Monitor 2018

Chile and Brazil lead the 4G-LTE penetration with more than 50% of their subscriptions. Colombia and Peru both have 4G-LTE penetration below 30% and will likely have the highest growth amongst major LATAM countries during 2019 and beyond. All Central American countries also offer ample growth opportunities in LTE technology. El Salvador was one of the countries to launch 4G-LTE most recently. It launched its 4G-LTE network at the end of 2016. By the end of 2018, its LTE subscription penetration remained below 13%.

Exhibit 2: 4G-LTE Penetration and Growth (2018)

4G-LTE Penetration and Growth (2018)

Source: Counterpoint Market Monitor 2018

2G has shrunk to represent around 20% of the subscriber base. Brazil and Mexico have the lowest 2G participation, while Central America countries and Peru have the highest. However, in Colombia, Claro (AMX) expanded its 2G network at the beginning of 2018 mainly to serve the bottom of the pyramid users that can’t afford a smartphone device and smartphone data plan.

A few carriers in the region are considering shutting their 2G networks off so they can reuse the spectrum for 4G-LTE. This is to respond to the exponential growth of data demands or potential demands of 5G. AT&T Mexico has already announced that it aims to shut down its 2G network starting April 2019. This task might not be that easy as AT&T will have to clean the frequency before it is usable to build a new network. This means not only moving 2G mobile users to 4G technology, but also those 2G M2M devices, which could complicate the shutdown.

LATAM has a population of 650M but more than 710M subscriptions. With 430 unique subscribers, there is an average of 1.68 SIM cards per user. In many countries regulators and operators have been pushing to decrease the number of lines. There are more subscriptions than people due to many reasons, but the main reason is because many users have more than one mobile line and multiple devices.

As 4G-LTE is already the dominant technology–now what is next? Currently, 18 carriers in the region have already launched VoLTE (voice over LTE), and at least 21 more have already announced their plans to launch it. Additionally, AT&T announced the launch of its LTE-M network in Mexico and TIM Brazil announced the launch of an NB-IoT network. In both cases, they will soon be offered commercially.

Many operators have also announced 5G trials and testing. Brazil regulator, ANATEL, announced that it will be auctioned 5G frequency by the end of 2019. However, as we learnt from 4G, it might take at least two years between the auctioning of the frequency and the commercial launch of the technology. 5G frequencies most likely will have to be cleaned before it can be used, so it will take some time. Many LATAM carriers, megacarrier or small, have said publicly that they need to work on recovering the investment of LTE technology before they can move to the large investments of 5G. LTE technology is now at the top of the wave, in LATAM, to prepare the region for the 5G wave that will unload full starting 2024.

Economic Instability Is Taking a Toll on the LATAM Smartphone Market

Chinese OEMs continues to gain traction in the region

New Delhi, Hong Kong, Seoul, London, Beijing, San Diego, Buenos Aires –

November 23st, 2018

According to the latest research from Counterpoint’s Market Monitor service, the Latin American (LATAM) Smartphone market has declined by more than 7% YoY due to economic uncertainty in four out of the six major countries in LATAM. Colombia, Brazil and Mexico’s markets were affected by presidential elections. These elections brought uncertainty to the economy and hence altered consumer purchasing behavior.

Commenting on the Latin American market development, Counterpoint’s Senior Analyst, Tina Lu, highlighted, “The replacement rate of local consumers is noticeably slowing. The cost of purchasing a new smartphone is a major investment for many consumers and, in most cases, they pay for their devices in 18 or 24 monthly installments. There is, therefore, a strong desire to make the smartphone last longer than the installment payment period. This change in user behavior has also brought a new level of importance to after-sales services. This has knock-on benefits in driving more business to companies providing after-sales service and refurbished smartphones”.

Commenting on vendor performances, Parv Sharma, Research Associate, noted: “Following the overall market decline, the sale of all top-selling brands in volume terms apart from Huawei, have also decreased. Huawei has once again recorded strong growth of 37% YoY, and 10% sequentially. Huawei has been driving volume, in its biggest market, Mexico, with a two for one mix between high and low-price band devices. Huawei is gaining brand preference as its reputation for offering excellent quality products widens.”

Exhibit 1: Percentage LATAM Shipment Volume Share – 2018 Q3

LATAM Shipment Volume Share – 2018 Q3
Source: Counterpoint Research Market Monitor Q3 2018

Samsung remains the absolute leader in the LATAM market. However, it lost around 1% share.

Samsung’s unit volume decline came mostly from Argentina, Chile and Brazil. Argentina’s market contracted by more than 40% YoY.

Motorola managed to retain its share, despite its decision to gradually decrease the volume of its bestselling C-series models and in the face of stiff competition from other Chinese brands.

Motorola grew in markets which were traditionally a challenge for it, such as Colombia, where it managed to achieve more than 50% YoY growth by increasing its share with local operators.

Huawei has double-digit growth in most of the region’s markets in which it operates. The one exception was Argentina where its volume reduced by more than a quarter YoY due to the company’s decision to outsource sales and distribution – a process that is not yet finalized.

LG’s business has been the most impacted. LG remains in the top three brands in Brazil, the largest market in LATAM, but it was not enough to offset a sharp drop in most other markets in the region.

Mexico was the only country, in LATAM, to be included in the first round of the latest iPhone launches. In all the other countries, Apple launched its latest iPhone models between October and November.

Exhibit 2: Latin America Brands Origin Variation 2017 Q3 vs 2018 Q3

Latin America Brands Origin Variation 2017 Q3 vs 2018 Q3

Source: Counterpoint Research Market Monitor Q3 2018

国际品牌仍然在一家smar占据主导地位tphone ecosystem, Samsung is the best-selling brand in this group.

Although some Chinese brands such Huawei and Xiaomi enjoyed strong performances, the Chinese brands’ group had only around 2% growth, offset by the decline of other Chinese brands such as Alcatel, Lenovo and ZTE.

Regional brands grew by 1% driven by the increasing numbers of local brands that managed to enter the distribution channel of most LATAM’s carriers.

Brazilian local brands such as Multilaser or Positivo also drove the growth of these regional brands.

Chinese brands are expected to grow in the LATAM region, but not massively until 2020 as two of the biggest LATAM markets, Brazil and Argentina will continue to effectively be closed to direct imports in 2019.

LATAM’s overall market will likely return to growth in 2019. Partly due to an easy comparison with a depressed 2018 and because many of the events that have caused the slowdown in 2018 will have passed.

The comprehensive and in-depth Q3 2018 Market Monitor is available for subscribing clients. Please feel free to contact us atpress(at)www.arena-ruc.comfor further questions regarding our in-depth latest research, insights or press enquiries.

Analyst Contacts:

Tina Lu

+54 91160411221

tina@www.arena-ruc.com

Parv Sharma

+91 974-259-6030

Parv@www.arena-ruc.com

Peter Richardson

+44 791-723-1934

Peter@www.arena-ruc.com

Follow Counterpoint Research

press(at)www.arena-ruc.com

Brazil and Argentina Increased Protectionism Through New Regulations

In November 2017, Miguel de Godoy, the head of ENACOM, (Ente Nacional de Comunicaciones – Argentina’s National Communication Regulator) announced that ENACOM is working on a project that would block all devices that were imported illegally into the country.

This regulatory project has been informally called: “La Lista Blanca” (the White List) in Argentina. This is different from the so-called “Lista Negra” (Black List). The latter is compiled from IMEI numbers of all mobile handsets reported stolen, so when activated, the carrier would automatically block the device. La Lista Blanca is different. It is intended to target devices that have been illegally imported into the country, often from a neighboring country such as Chile or Uruguay.

Around the same time, ANATEL (Agência Nacional de Telecomunicações – Brazil’s National Telecommunications Regulator) announced that project “Celular Legal” has been approved by the congress. Starting Feb 22nd, 2018 carriers will start blocking all mobile devices that have not been homologated with ANATEL.

Chart 1: New Regulatory Project implementation Schedule

Sources: Anatel, ENACOM, Telam(Argentina National Press Agency)

Potential Impact of This Regulation

Samsung, Motorola and other brands’ sales in the affected countries have been most impacted by the smuggling, as their sales have underperformed expectations since 2014. Meanwhile their colleagues in neighboring countries have exceeded sales targets. Some OEMs/assemblers have been actively lobbying the local regulators, to enact and approve this regulation.

Chart 2: New Regulation Procedure and Impact

Sources: Anatel, ENACOM, Telam (Argentina National Press Agency)

Brazil

  1. Between 60%-70% of the illegally imported mobile devices in Brazil, arrive from Paraguay. Many brands have many models that are not approved by ANATEL and these brands will be most impacted.
  2. When the regulation is implemented, the quantity of imports in Paraguay will likely diminish by between 20% to 40%.
  3. The rest of the illegal mobile devices are from other neighbouring countries, such as Peru, Bolivia and Colombia. The volume of product being imported to these countries will also undergo a slight decrease.
  4. Brazil’s TAM in 2018 should increase by 5% to 10% in addition to the market’s own growth.
  5. However, we expect many consumers to lengthen their rate of replacement as local, approved, handsets are generally 40%-50% more expensive than illegal imports.
  6. The second-hand devices market will also likely increase in the short-term. Most of these devices are sold, informally, from consumer to consumer, rather than back into official channels.

Argentina

  1. In the case of Argentina, about 70%-80% of the illegally imported mobile devices enter from Chile. This was the principal reason that total imports of devices, had more than 20% growth, in Chile, between 2014 and 2015.
  2. Samsung, Apple, LG, Huawei and Motorola were the main brands “traded”. So much so, that recently some of these OEMs, have taken a measure to decrease the number of units shipped to Chile.
  3. The rest of the units arrive from Bolivia and Paraguay and brands such as Blu will likely experience the biggest impact.
  4. If the regulation passes in Argentina, sell-in is expected to increase by at least 10%. However, it likely won’t recover the 25% of the market volume represented by the grey market currently.

As this regulation is set to be implemented in stages, its impact will not be felt until 2H 2018:

– Sell-in in Chile, Peru, Paraguay, Bolivia and even Colombia will most likely be impacted.

– Locally-established OEMs are not expected to fully recover the impacted volume until 3Q 2018.

– Used devices will likely see an uptick I demand (and prices) in the short term to fulfill the needs of consumers that cannot afford a new phone; cheap new smartphones will not be available.

The LATAM region’s overall TAM will see a slight reduction during 2018 driven by reductions in grey trade between countries and a lengthening replacement cycle. For full regional recovery, it will require these two countries to open their markets leading to lower device prices. One other consequence is likely an upswing in sales of second hand devices, though the refurbished handset market remains at a nascent stage across the region.

Term of Use and Privacy Policy

Counterpoint Technology Market Research Limited

Registration

为了访问对位技术市场Research Limited (Company or We hereafter) Web sites, you may be asked to complete a registration form. You are required to provide contact information which is used to enhance the user experience and determine whether you are a paid subscriber or not.
Personal Information When you register on we ask you for personal information. We use this information to provide you with the best advice and highest-quality service as well as with offers that we think are relevant to you. We may also contact you regarding a Web site problem or other customer service-related issues. We do not sell, share or rent personal information about you collected on Company Web sites.

How to unsubscribe and Termination

You may request to terminate your account or unsubscribe to any email subscriptions or mailing lists at any time. In accessing and using this Website, User agrees to comply with all applicable laws and agrees not to take any action that would compromise the security or viability of this Website. The Company may terminate User’s access to this Website at any time for any reason. The terms hereunder regarding Accuracy of Information and Third Party Rights shall survive termination.

Website Content and Copyright

This Website is the property of Counterpoint and is protected by international copyright law and conventions. We grant users the right to access and use the Website, so long as such use is for internal information purposes, and User does not alter, copy, disseminate, redistribute or republish any content or feature of this Website. User acknowledges that access to and use of this Website is subject to these TERMS OF USE and any expanded access or use must be approved in writing by the Company.
– Passwords are for user’s individual use
– Passwords may not be shared with others
– Users may not store documents in shared folders.
– Users may not redistribute documents to non-users unless otherwise stated in their contract terms.

Changes or Updates to the Website

The Company reserves the right to change, update or discontinue any aspect of this Website at any time without notice. Your continued use of the Website after any such change constitutes your agreement to these TERMS OF USE, as modified.
准确的信息:尽管欺诈的信息tained on this Website has been obtained from sources believed to be reliable, We disclaims all warranties as to the accuracy, completeness or adequacy of such information. User assumes sole responsibility for the use it makes of this Website to achieve his/her intended results.

Third Party Links: This Website may contain links to other third party websites, which are provided as additional resources for the convenience of Users. We do not endorse, sponsor or accept any responsibility for these third party websites, User agrees to direct any concerns relating to these third party websites to the relevant website administrator.

Cookies and Tracking

We may monitor how you use our Web sites. It is used solely for purposes of enabling us to provide you with a personalized Web site experience.
This data may also be used in the aggregate, to identify appropriate product offerings and subscription plans.
Cookies may be set in order to identify you and determine your access privileges. Cookies are simply identifiers. You have the ability to delete cookie files from your hard disk drive.