Expansion, Premiumization Drive Transsion’s Record Quarter
September 4, 2023
Transsion Holdings reported revenues of RMB 25.03 billion for the first half of 2023, registering a growth of 8.3% YoY. Net profit grew 27.2% YoY primarily due to better product mix (higher proportion ofsmartphonesas compared to feature phones, with the former accounting for 92% of group revenues) and geographical expansion into higher-value markets.
2023年第二季度的亮点,收入是30.7% while net profit grew 83.9%. It was the best quarter in Transsion’s history in both revenue and net profit terms. Gross margins also improved to 24.5%, up 2.4% from a year ago.
Much of Transsion’s turnaround in the key financial metrics above can be attributed to a rebound in macroeconomic fundamentals in theAfricanhome market and beyond. Most importantly, inflation rates have come down while food prices have stabilized. Local currencies have also found a stronger footing while several indebted countries across theemergingmarkets have managed to secure restructuring packages with lenders. As Africa’s most entrenched handset company, thanks to its deep channel penetration and marketing heft, Transsion once again benefitted the most from the upturn.
Transsion’s operating cost in H1 2023 increased 5% YoY as the company is ramping up its operations, particularly in newer markets. It has been aggressive with sales and marketing despite the cyclical downturn, with the spending on these activities increasing 23.6% YoY in H1 2023. R&D spending was also up 20.6% YoY to drive premiumization efforts and develop higher-value products to target the new markets. Costs attributed to management grew 6% YoY, whereas cash flow from operating activities turned positive, primarily due to the reduction in the cost of components and materials, as the company is reducing its inventory and moving towards a leaner operating model. According to Counterpoint Research, Transsion’s smartphone sales volume grew 3% YoY in the first half of 2023 and 17% YoY in Q2 2023 as demand for TECNOsmartphones增加在全球范围内,特别是在公司的东北wer markets. This helped Transsion’s cash flow, as cash on hand increased 61% YoY to reach an all-time high of RMB 12.79 billion. The number of inventory days dropped further to 61, from 86 a year ago. Therefore, the inventory problem that has been troubling the company for the past year has successfully been managed.
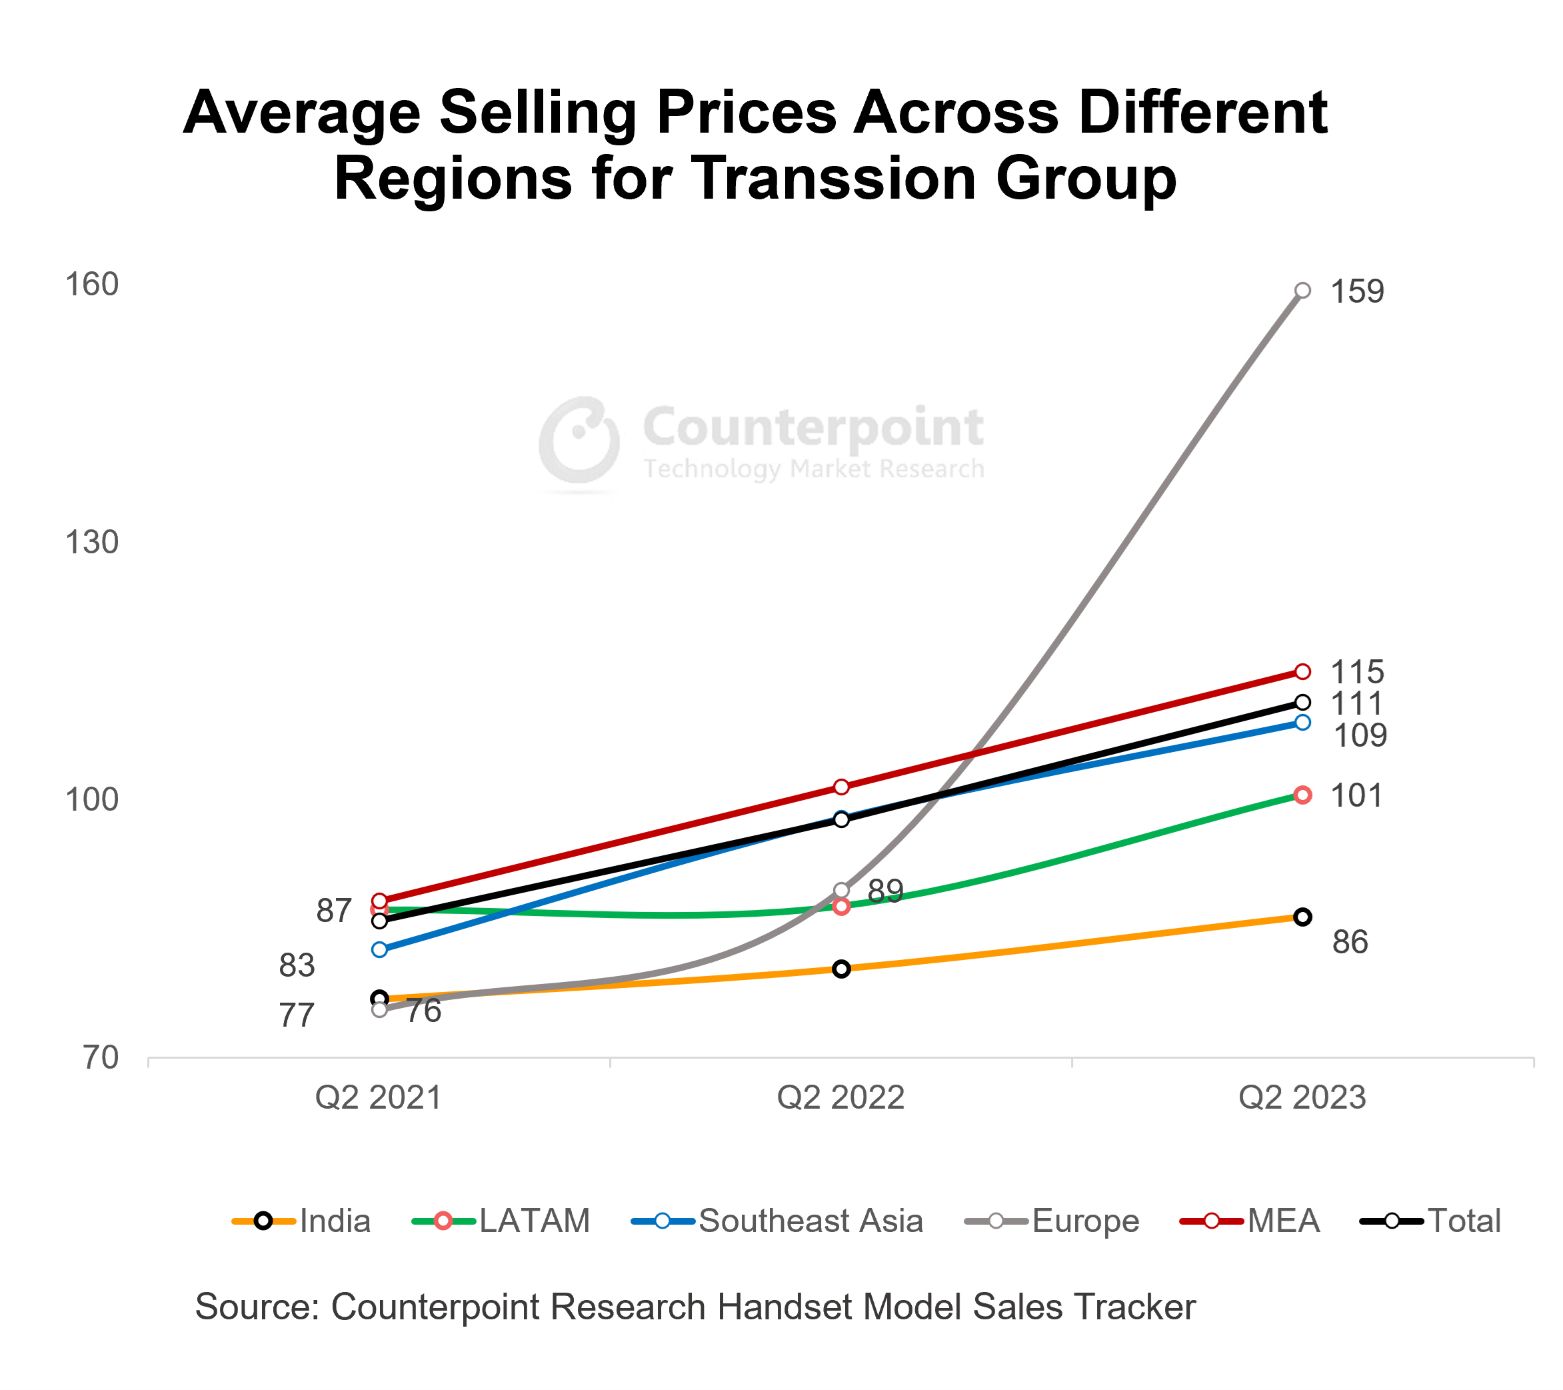 Much of Transsion’s financial successes can be attributed to its continued commitment to entering new markets. In Q2 2023, Africa accounted for 57% of Transsion’s smartphone sales volume, a net drop of 8% from a year ago. Outside Africa, Transsion smartphone sales grew 35% in Q2 2023, most notably in Latin America, EasternEurope,Indiaand Southeast Asia.
The reason for Transsion’s big increase in profitability is found in its ability to upsell to customers. Average selling prices (ASP) for Transsion smartphones rose by 14% YoY for two years in a row. The MEA region anchored the increase as a big expansion into the Middle East was the main factor. In a bid to replicate its success in Africa, Transsion has targeted the low end when entering new markets, but there is potential for the company to grow beyond the current level.
While Transsion continues to enjoy stable gross margins of around 30% in Africa, the company does face a more competitive landscape in the rest of the world, with gross margins of 15%-20%. However, there is room for improvement as the company continues with its premiumization strategy. In a recent interview, Transsion VP Qi Zhang said the company would be launching a flipfoldablein September in another attempt to showcase its technical prowess in the premium segment.
Q3 Revenue Stays Resilient, But Profit Declines Sharply as Costs Balloon
December 13, 2022
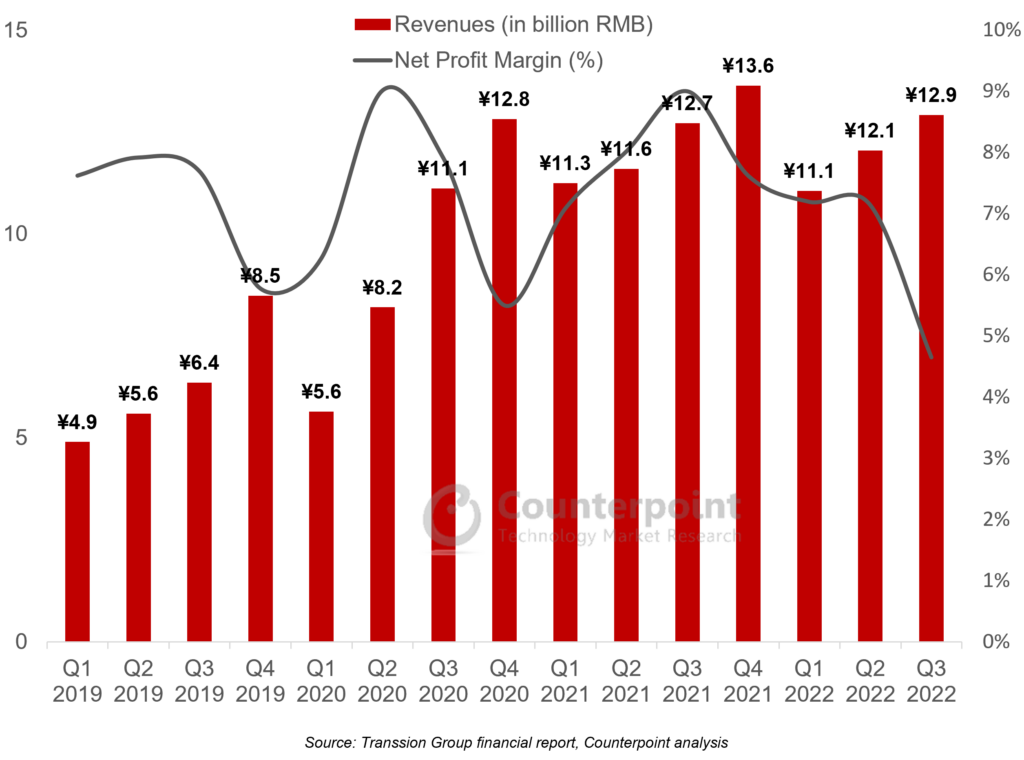
Transsion Holdings has reported flat revenue growth for Q3 2022 at 12.9 billion RMB. However, net profit slumped 47.4% YoY due to macroeconomic headwinds, inventory destocking initiatives, competitive pressures, and higher R&D and market expenditure.
Transsion Group Quarterly Revenue and Net Profit Margin
Transsion’s Q3 smartphone shipments fell 18% YoY, as emerging market demand was hammered by macroeconomic concerns. Inflation rates ticked higher, continuing the pressure on lower-income consumers with high food and energy prices. Local currencies too continued to depreciate against the US dollar.
Despite the big drop in shipment numbers, Transsion’s revenues still achieved positive growth. This was due to a big increase in smartphone selling prices. TECNO and Infinix’s average selling prices (ASPs) rose 26% and 28% YoY respectively. Transsion was able to achieve this due to successful iterations of mainstream devices across TECNO and Infinix, while launching more sophisticated devices that have gathered popularity among aspiring switchers. On the other hand, bringing higher-value products to more mature markets in India and Southeast Asia meant higher contribution from higher-end products to the company’s revenue mix.
Transsion Group Financials Deep Dive – Sales, R&D and Inventory

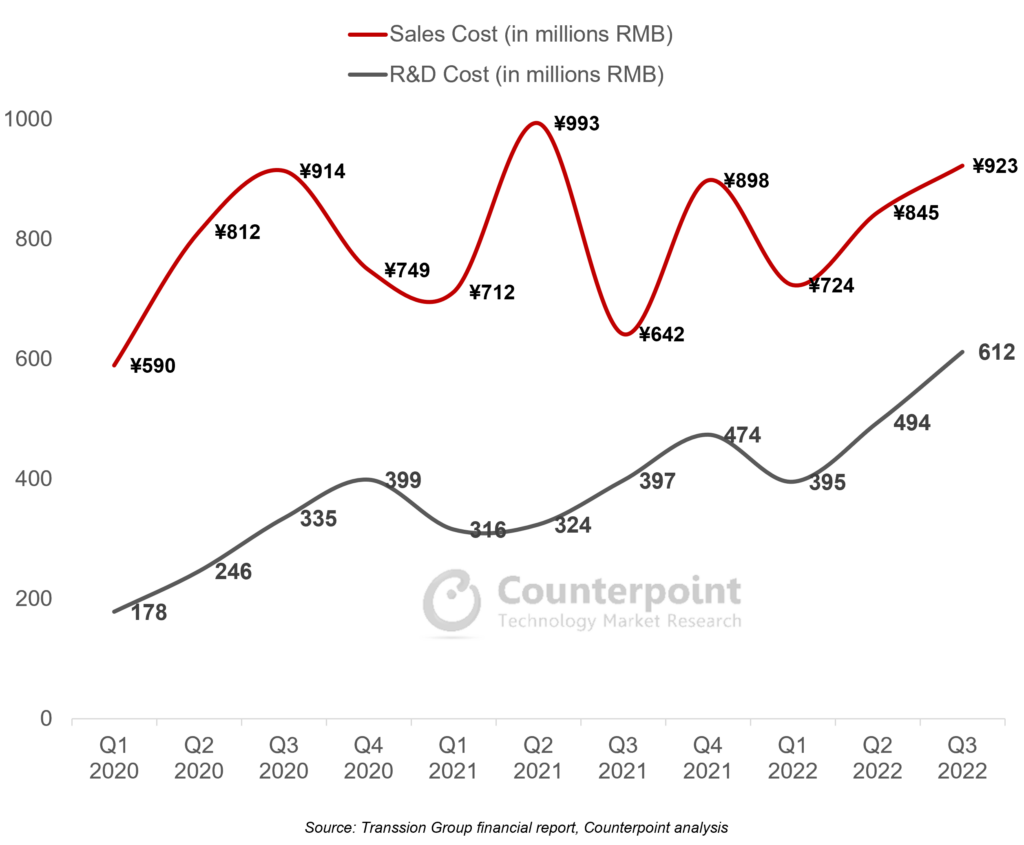
Three items, in particular, caught our attention in Transsion’s Q3 report:
- Inventory:Since the COVID-19 lockdowns, Transsion has moved decidedly away from the feature phone business and into the smartphone business. In parallel, inventory levels have also crept up, reaching an all-time high of 80% of quarterly revenues in Q2 2022, which caused discomfort for the management. In Q3, this level was brought down to a more manageable 57%, which put pressure on margins in the quarter but removed a significant uncertainty for future quarters, as the smartphone market is not expected to rebound until well into 2023.
- Sales cost:Other than the cost of goods sold, sales costs represent the biggest cost item in Transsion’s income statement. In a year when Transsion has reported slowing revenue growth, its sales costs have increased significantly as the company paves the way for an aggressive expansion into other regions. Transsion will be hoping the global smartphone market recovers quickly in 2023, but its investment case could come into doubt if smartphone shipments and market share do not pick up meaningfully in its key markets in the next few quarters.
- R&D:Transsion is spending heavily on R&D, which is an encouraging sign as the company aspires to move into higher-value smartphone segments and other smart device categories. We expect this trend to continue as the window of opportunity for entry-level devices narrows, considering device costs are expected to creep up, in line with the inflation rate.
Last quarter, we discussed Transsion’s stock options plan for 2022, which is linked to 2024 financial metrics. We expect the company to target 20-25% annual revenue growth rates for both 2023 and 2024. Much of this will depend on the company continuing to move up the smartphone value chain with 5G-capable devices, entry into IoT segments and monetization initiatives for its wide user base. Above all, the recovery of the global economy and smartphone market will be pivotal for Transsion as it gradually becomes more exposed to a wide range of different geographical locations.
Resilient Q2 Performance Driven by Pivot to Value, But Macroeconomic Challenges Remain
August 29, 2022
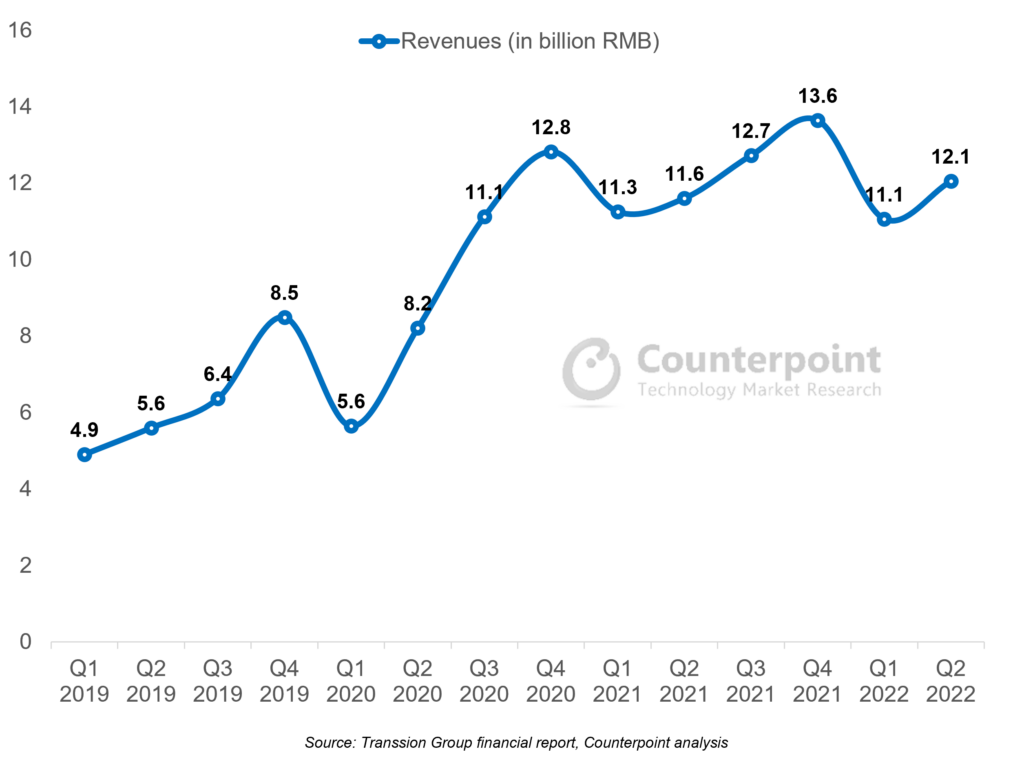
Transsion Holdings reported a 3.7% YoY increase in its Q2 2022 revenue to RMB 12.1 billion and a 4.5% YoY decline in net profit to RMB 1.04 billion. Considering the macroeconomic headwinds in Transsion’s core markets, the increase in revenue was a bright spot, especially compared with Q1 when the company posted a quarterly revenue drop for the first time since its market debut in September 2019.
Transsion Group Quarterly Revenue
Transsion’s Q2 smartphone shipments grew 4.1% YoY, an impressive performance despite a shrinking global market, whichretreated 9%YoY during the quarter. Geopolitical tensions and high inflation rates have hurt the global smartphone market in general. Further, companies exposed to the low- to mid-end segments and emerging markets are more prone to secondary impacts, such as the strain on customers from high food and energy prices, weaker local currencies against the US dollar, and higher government taxes and levies on ‘non-essential’ imports like consumer electronics.
Transsion GroupQ2 2022 Smartphone Shipments Analysis – Growth and Regional Contribution
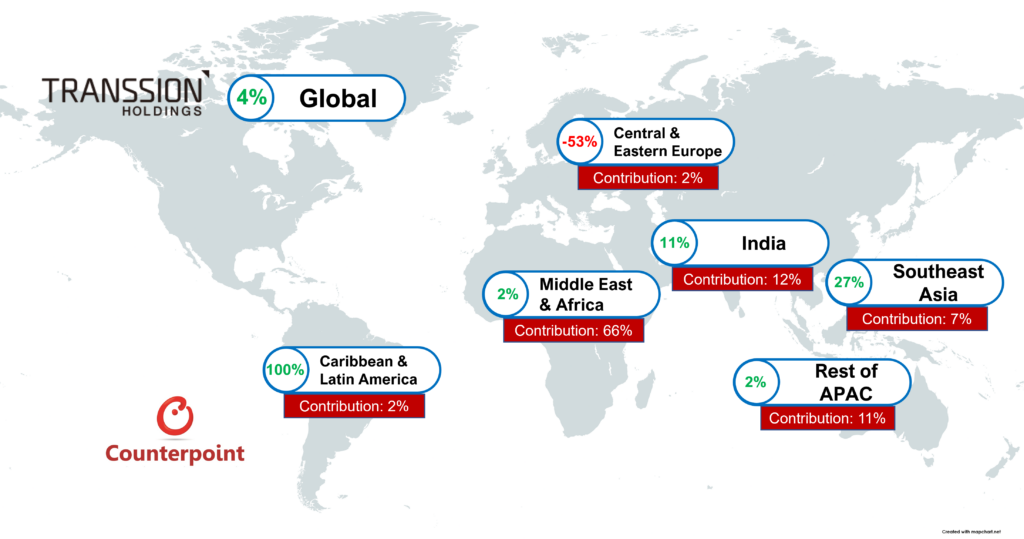
Transsion defied these global trends through resilient performance in its Africa home market and strong growth in other regions, most noticeably in India and Southeast Asia. In both these regions, Transsion is ranked sixth in terms of shipments, helped by the company’s double-digit annual growth rate. Gaining a foothold in these new markets helps the company diversify its revenue sources and also allows the company to move up the pricing curve. According to Counterpoint’s Model Sales Service, Transsion’s smartphone average selling prices (ASP) increased 14% YoY, mainly driven by the success of the company’s TECNO and Infinix brands. The brands’ latest products received good market reception and are edging closer to the $150 mark.
Due to the increased pricing, Transsion’s Q2 normalized gross profit margin reached 22.9%, up 1.4% YoY, to reverse a six-quarter slump. However, the bottom line retreated, mainly due to a significant 40% increase in R&D spending. In our view, this is a positive sign that the company is moving out of its comfort zone of focusing only on pricing competitiveness in its African home market and committing to make more sophisticated products for the higher value markets.
Despite our positive commentary, we also recognize the significant challenges brought on by the macro environment, which is not likely to ease in the near term. In Q2 2022, we observed inventory challenges across handset and component makers, including Transsion. The company’s inventories reached RMB 9.6 billion as at the end of Q2, 27% higher than that in Q4 2021 and 73% more than in Q4 2020. Currently, inventory levels are 19% of the company’s 12-month trailing revenue, which could become an issue if it remains high or if revenue declines in the coming months.
We also note that the company’s recently announced stock options plan for 2022 is linked to its targeted 2024 financial metrics. The plan suggests that the company forecasts revenue and net profit to increase 15% and 32.25% respectively as a baseline case, or 20% and 44% respectively as a bull case by 2024. The targets are compared with the metrics from 2021, which was a strong financial year for Transsion, indicating that the company is extremely bullish about the next couple of years.
Growth Worries in Africa, India See First Revenue Drop Since COVID-19, But Diversification Efforts on Track
June 6, 2022
Transsion Holdings reported Q1 2022 earnings that saw revenues and net profit drop 1.8% and 7.6% YoY respectively. This is Transsion’s first revenue and profit drop since it went public in September 2019. The company’s performance during the quarter was impacted mainly by the stalled growth in its home market Africa and in India, which saw inflationary pressures hitting lower-income consumers significantly. Smartphone sales were down in the region for the first time since the pandemic. However, the company was cushioned by growth in other regions, and margins remained intact despite inventory build-up.
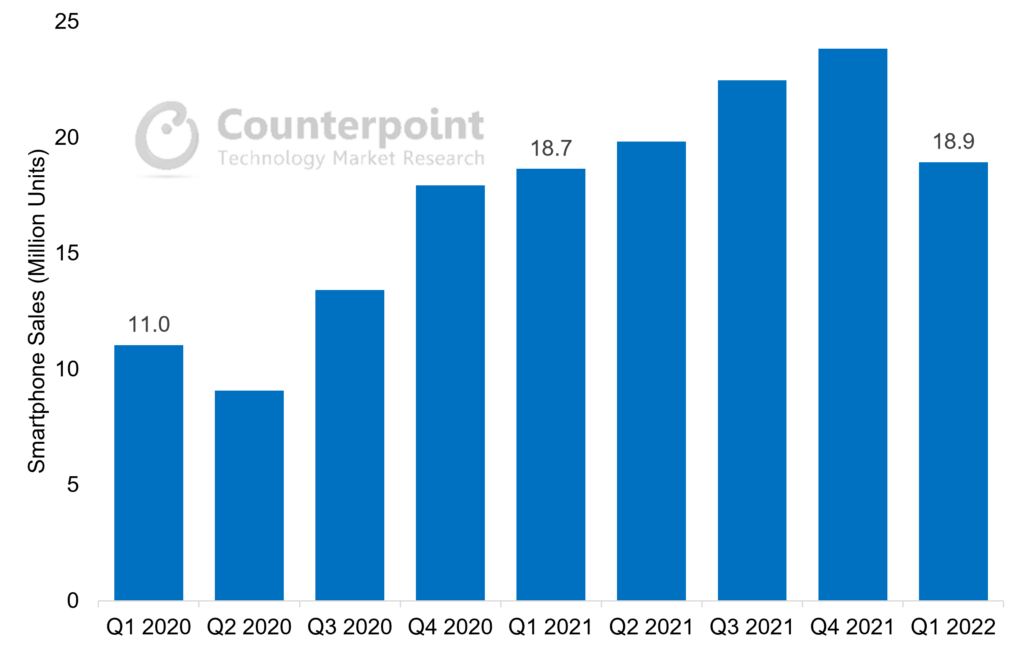
According to Counterpoint Research’sMarket Pulseservice, cumulative Transsion smartphone shipments reached 18.9 million units in Q1 2022. This was a small increase of 1.6%, the slowest YoY growth rate since the pandemic.
Transsion Group Quarterly Smartphone Sales
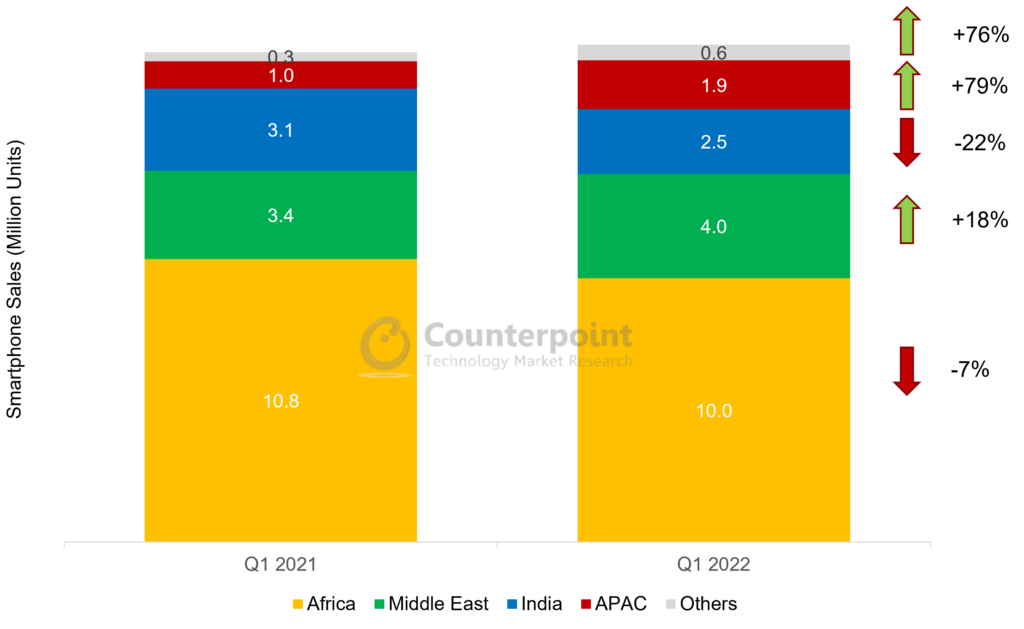
Looking further under the hood, there are significant regional disparities, however. In Africa, Transsion saw a 7% decline in smartphone sales in Q1 2022, mainly due to the inflationary impact on consumer sentiment. Most large African markets were already running double-digit inflation during 2021, but the Ukraine war had far-reaching consequences as food imports were hampered, affecting lower-income consumers more. Depreciating local currencies also put pressure on the company’s supply chain and margins.
In India, similar macro concerns and impact of the Omicron wave saw the smartphone market record the first Q1 drop ever. Here, Transsion smartphone sales dropped 22%. The market sentiment in India is expected to remain weak in Q2, but sales are likely to see growth due to the low base of Q2 2021 when the market was hit hard by the Delta wave.
On the other hand, Transsion had resilient performances in the Middle East and APAC, which show its diversification efforts are working. In both regions, the company is finding success in penetrating the entry-level segment in key countries like Pakistan and Bangladesh. Transsion’s 79% sales increase in APAC runs counter to the broader market. In the Middle East, the 18% sales increase is likely to extend further in 2022, as the region is expected to be the best-performing smartphone market due to the economic growth driven by oil revenue increases, mainly in Gulf Cooperation Council (GCC) countries.
Transsion Group Smartphone Sales by Region, Q1 2022 vs Q1 2021 (In million units)
Transsion’s normalized gross profit margins for Q1 2022 decreased to 21.4%, or 2% less than the same period in the previous year. Significant cost pressures persisted due to lingering supply chain disruptions, component shortages and high inventory levels. Rising revenues from other regions are also likely to cap the company’s margins, as it enjoys far higher margins in its home market Africa. However, Transsion now derives 87% of its revenues from the smartphone business, and as feature phone-to-smartphone migration continues for its emerging market customers, we see further room for the company’s revenues and margins to grow.
Transsion signs off 2021 in style: Smartphone market share continues to increase in emerging markets
April 28, 2022
与梦Transsion控股公布2021年业绩nues up 31.8% YoY and net profit up 45.5% YoY. These results were driven mainly by increasing smartphone sales and market share, which widened in the core African market, while achieving breakthroughs in key South Asian countries like Pakistan, Bangladesh and India. IoT and internet services, which accounted for 6.5% of the group’s revenues in 2021, also saw robust triple-digit growth.
According to Counterpoint Research’sMarket Monitorservice, cumulative Transsion handset shipments reached 184 million units in 2021, an all-time high. Smartphones, in particular, grew 61%.
Transsion Group Handset Shipment and Revenue Analysis
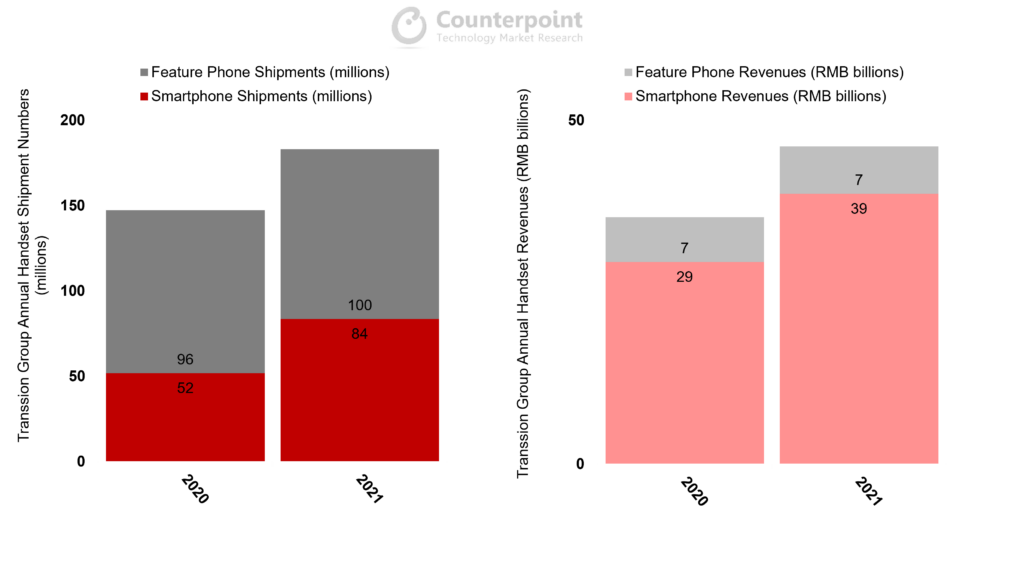
Sources: Counterpoint Market Monitor Service, Transsion Group financial statements
Transsion continued to do well in its home market Africa, where it already dominates with close to 45% share across its three brands. However, Africa accounted for only half of the shipment increases in 2021. In India, Transsion almost doubled its smartphone sales in one year, while the company is already the biggest smartphone OEM in Pakistan. As such, Transsion smartphone sales attributed to Africa decreased from 67% in 2020 to 56% in 2021. A widening geographical footprint, accompanied by an enriched portfolio, can help the company diversify its customer base and increase its technical prowess.
The company also reported surprisingly good revenue growth from other businesses. Revenues not attributed to handsets, which mainly include IoT and internet services, grew 68% YoY to RMB 3.2 billion. Their contribution to group revenues now stands at 6.5%. This is due to new products in the wearables, TWS, notebook and TV categories. But more importantly, Transsion’s ‘Matrix of Internet Products’ became meaningful growth engines. Apps under the Transsion umbrella saw installations increase 240% YoY, with three apps – Phoenix, Boomplay and Scooper (with MAUs of 100 million, 68 million and 27 million respectively) – becoming main gateways to the internet for African users. User and eventually revenue growth from apps will become ever more important factors in Transsion’s future strategy, particularly in Africa, as its handset business will inevitably hit road bumps in the future.
Transsion IoT & Internet Services Analysis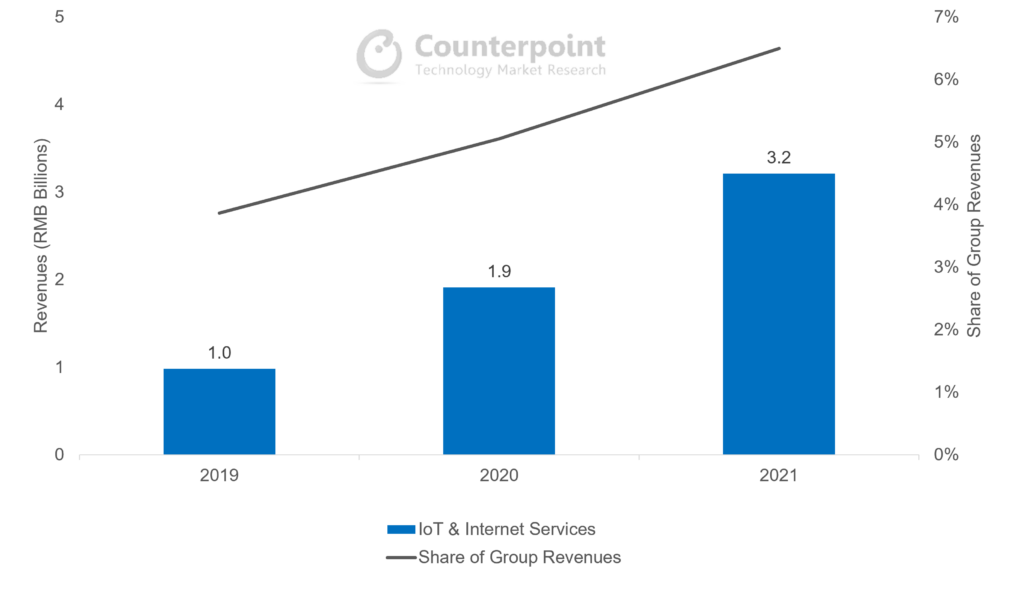
Source: Transsion Group Financial Statements
Transsion’s normalized gross profit margins decreased to 21.3% for the year, after staying above 23% for the first three quarters of 2021. There were significant cost pressures in the second half of the year, especially due to supply chain disruptions and component shortages. We expect these issues to gradually ease in 2022 as the supply and demand dynamics in the semiconductor industry improve, and supply chains become more resilient to shocks. However, foreign exchange fluctuations and inflationary pressures in key markets will be the new destabilizing factors for the company, as risks shift from the supply to the demand side in the wider global handset market.
Transsion handset sales, profit continue to improve despite cost pressures
November 24, 2021
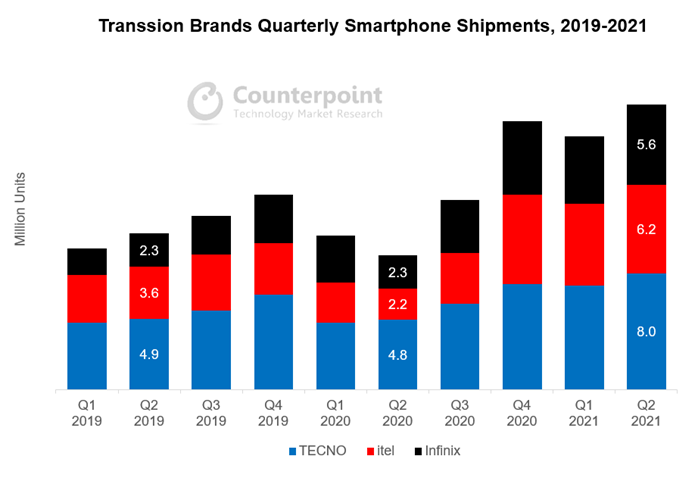
Transsion Holdings reported Q3 2021 results with revenues up 16% YoY and net profit up 33% YoY. These positive results were driven once again by further pivoting to smartphone sales, especially in the core African market. According to Counterpoint Research’sMarket Monitorservice, cumulative Transsion smartphone shipments surpassed 20 million units for the first time ever, coming in at 23 million. This represents a growth rate of 75% YoY.
Transsion Group Handset Shipment and Revenue Analysis
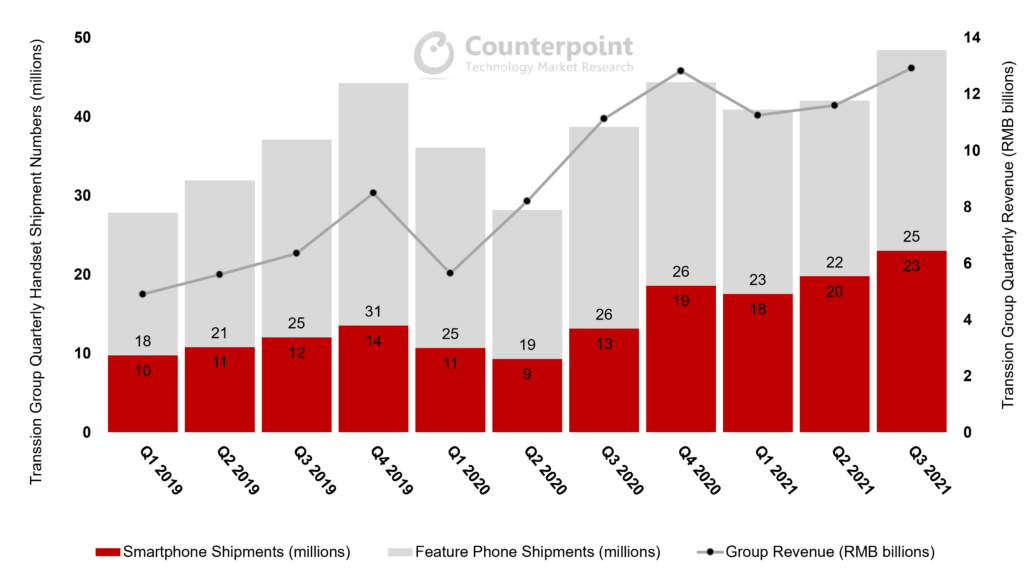
While feature phone shipment growth moderated in Q3 2021, the bulk of Transsion’s revenue growth was driven by smartphones. Heading into the Q4 holiday shopping season and 2022, we may see Transsion’s smartphone shipments overtake feature phones for the first time.
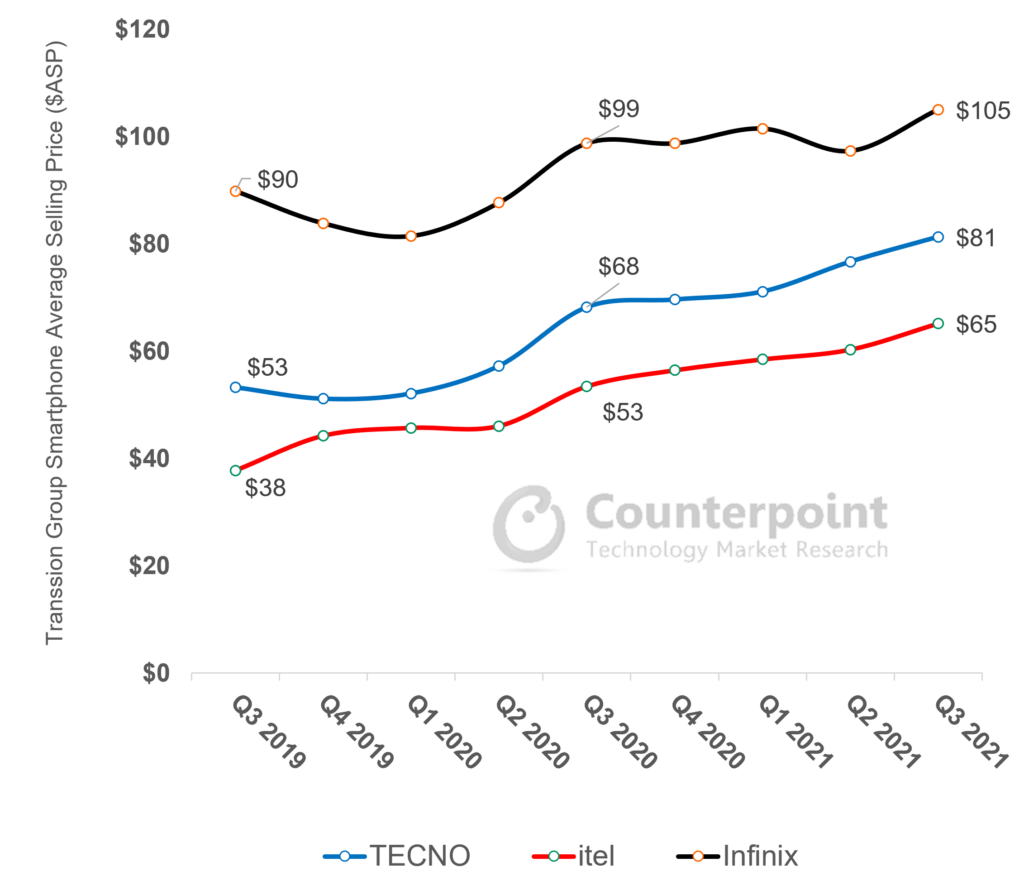
Over the past couple of years, as Transsion smartphones penetrated more markets, the average selling price (ASP) saw a noticeable increase. While the ASP showed a mixed trend in the second half of 2019, it increased decisively during 2020 and is showing no signs of slowing down in 2021. Looking at Transsion’s brands closely, TECNO, itel and Infinix saw ASP increases of 56%, 43% and 29% respectively over the past 18 months. These point to positive consumer sentiment and changing perception of digital and mobile services. More consumers in emerging markets now recognize that a decent smartphone is an important component of their daily lives.
Transsion Group Smartphone Average Selling Price ($)
Transsion毛利率的规范化increased to 25.3% in Q3, compared to 25% in Q2 and 23% in Q1. The company managed to navigate the ongoing component shortages well and was able to pass upstream cost increases to consumers. Selling, General & Administrative (SG&A) expenses and financing costs dropped as well. Furthermore, ventures outside sub-Saharan Africa, including in higher value markets in Southeast Asia and the Middle East, contributed to higher profit margins. Profitability may increase further as the supply chain situation stabilizes in 2022.
Smartphone Sales and Profitability Double Boost as Company Diversification Efforts Gather Pace
September 30, 2021
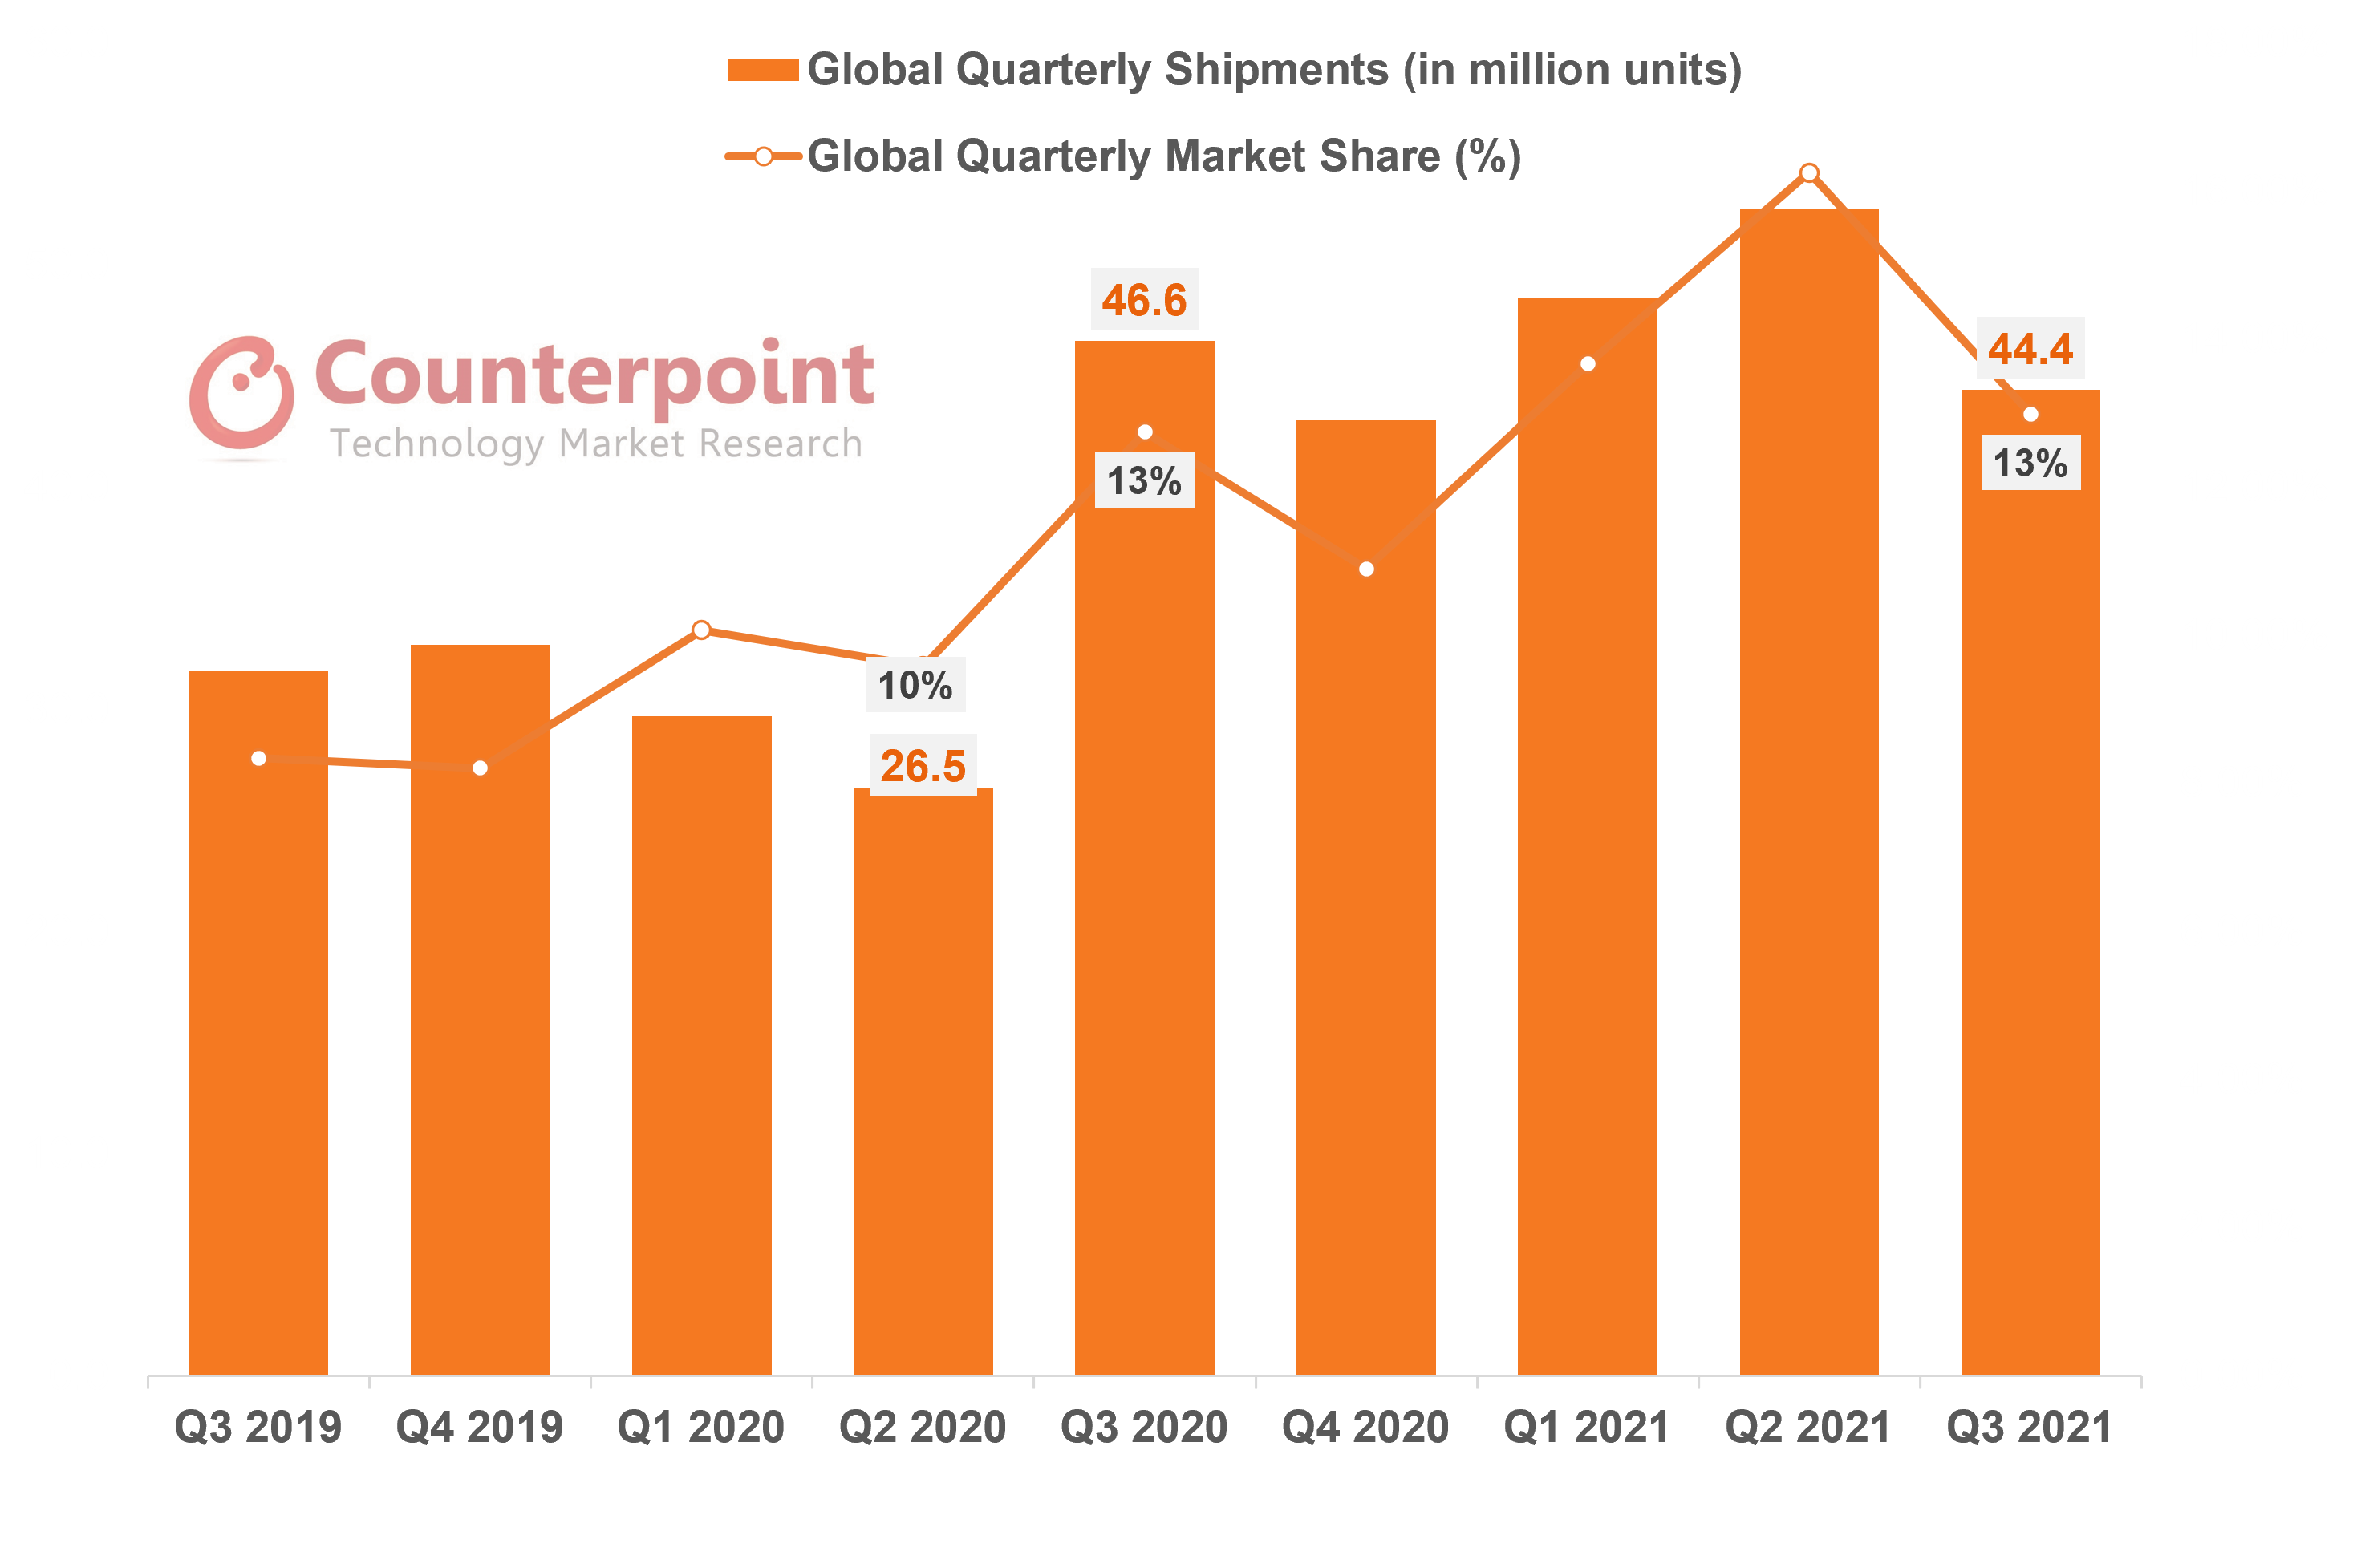
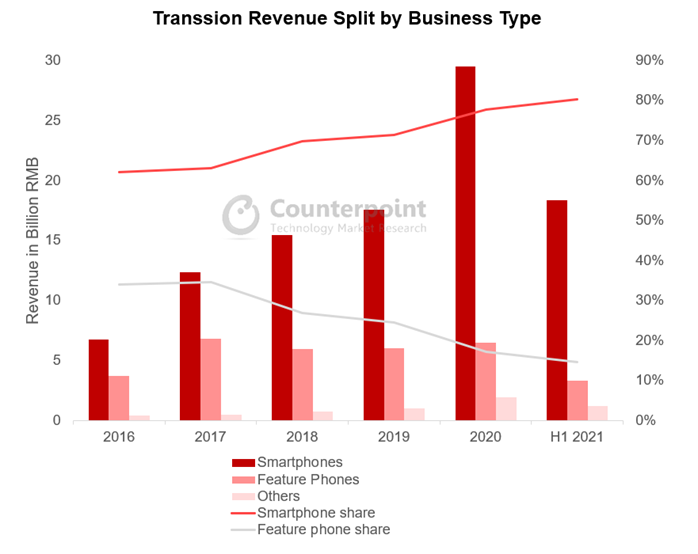
Transsion Holdings continued to see strong performance in H1 2021 with revenues and net income growing 65% and 59% YoY respectively, driven primarily by surging handset sales in its home market Africa, as well as successful ventures in other developing countries. According to Counterpoint Research’sMarket Monitor service, cumulative Transsion smartphone shipments in H1 2021 reached a record high of 37.3 million, taking the company’s share in the global smartphone market to 5.5% from 3.5% a year ago.
Looking at Transsion’s overall product strategy, we can see that it is shifting materially from feature phones to smartphones in response to market changes. In 2019, 33% of the company’s handsets were smartphones, but in the latest quarter this number has gone up to 47%. In the company’s latest earnings release, smartphones account for over 80% of its revenues, a record high.
Commenting on Transsion’s commitment to smartphones,Senior Analyst Yang Wangsaid, “Transsion is rapidly transforming and upgrading its product portfolio. The move is driven by the accelerating demand for internet-capable phones in itshome market Africa, where the COVID-19 pandemic showed the value of the internet to consumers who were forced to stay at home. The region’s internet and mobile money services are also gathering steam along with a significant drop in data costs. While all OEMs stand to benefit from the consumer’s shift, Transsion gains the most as its distribution and pricing strategies are most ready to tap into new consumer clusters, which previously did not consider buying a smartphone.”
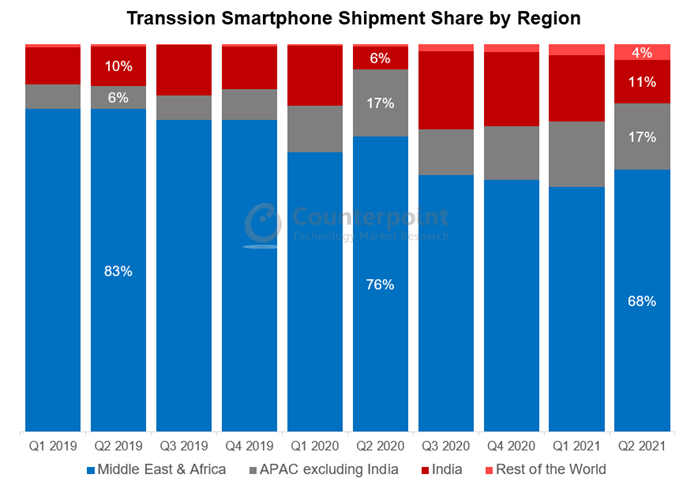
Apart from product transformation, the other significant shift in the Transsion strategy is geographical diversification. Compared to two years ago, Transsion’s share of smartphone shipments in the Middle East and Africa (MEA) region has dropped from 83% to 68%. On the other hand, shipments have increased rapidly in APAC countries such as India, Pakistan, Bangladesh, Indonesia and Thailand.Indiaspecifically has been the growth engine for Transsion, with shipments almost reaching 20% of the company’s global total in H2 2020, before the Delta wave halted the progress.
Commenting on Transsion’s moves in India,SeniorAnalyst Prachir Singhsaid, “Transsion brands, especially TECNO, have been focusing on a hybrid channel strategy in India, with an increased emphasis on online channels. This was executed with great success as Transsion brands contributed to 7% of the online smartphone market in India in Q2 2021, compared to 2% in Q2 2020. TECNO’s online smartphone shipments grew almost 20x YoY in Q2 2021, while itel increased its online share by launching online exclusive models like the Vision 1 Pro and A47. From a product positioning point of view, Transsion brands have been focusing on providing specs like higher display size, multi-camera capability and bigger battery, which are the top spec preferences for consumers in the sub-$150 segment.”
Going forward, Transsion’s fundamentals are expected to remain solid, as it continues to hold enormous clout in its Africa home market. Smartphone penetration will gradually expand, with new users continuing to be brought into the internet world. On the other hand, Chinese brands such as Xiaomi, OPPO and vivo are strengthening their market penetration efforts in certain African markets to address the medium-range segment (<$200). This price band is above Transsion’s typical playing field, so the newcomers are unlikely to affect its market share in the short term. However, we have seen in recent years Transsion’s effort to produce more premium phones and enter the <$200 price band. Therefore, there may be a time in the future when Transsion competes directly with the likes of Xiaomi, OPPO and vivo.